

Key Points
NCOA4 mediates mobilization of hepatic iron stores after blood loss.
NCOA4 expression is upregulated in a HIF-1α/HIF-2α–dependent manner under conditions that promote HIF stabilization.

Abstract
The mechanisms by which phlebotomy promotes the mobilization of hepatic iron stores are not well understood. NCOA4 (nuclear receptor coactivator 4) is a widely expressed intracellular protein previously shown to mediate the autophagic degradation of ferritin. Here, we investigate a local requirement for NCOA4 in the regulation of hepatic iron stores and examine mechanisms of NCOA4 regulation. Hepatocyte-targeted Ncoa4 knockdown in nonphlebotomized mice had only modest effects on hepatic ferritin subunit levels and nonheme iron concentration. After phlebotomy, mice with hepatocyte-targeted Ncoa4 knockdown exhibited anemia and hypoferremia similar to control mice with intact Ncoa4 regulation but showed a markedly impaired ability to lower hepatic ferritin subunit levels and hepatic nonheme iron concentration. This impaired hepatic response was observed even when dietary iron was limited. In both human and murine hepatoma cell lines, treatment with chemicals that stabilize hypoxia inducible factor (HIF), including desferrioxamine, cobalt chloride, and dimethyloxalylglycine, raised NCOA4 messenger RNA. This NCOA4 messenger RNA induction occurred within 3 hours, preceded a rise in NCOA4 protein, and was attenuated in the setting of dual HIF-1α and HIF-2α knockdown. In summary, we show for the first time that NCOA4 plays a local role in facilitating iron mobilization from the liver after blood loss and that HIF regulates NCOA4 expression in cells of hepatic origin. Because the prolyl hydroxylases that regulate HIF stability are oxygen- and iron-dependent enzymes, our findings suggest a novel mechanism by which hypoxia and iron deficiency may modulate NCOA4 expression to impact iron homeostasis.
Introduction
The liver plays a unique role in systemic iron regulation by serving as the body’s major iron depot. Within the liver, iron is stored primarily in hepatocytes within ferritin,1,2 a 24-subunit protein nanocage of heavy and light chains that contains a ferrihydrite mineral core.3,4 When excess iron is present in the body, hepatic ferritin levels rise, as does liver iron content.5 Conversely, iron stored in the liver can be mobilized for use when extrahepatic iron demands increase, such as after acute blood loss.1,6 In HFE-associated hemochromatosis, therapeutic phlebotomy is the standard of care to reduce liver iron accumulation.7 Despite the demonstrated efficacy of phlebotomy in mobilizing liver iron stores, the underlying molecular mechanisms are not yet well understood.
Recent in vitro studies have revealed that ferritin degradation is regulated by the coiled coil domain protein NCOA4 (nuclear receptor coactivator 4).8,9 In iron-deficient cells, NCOA4 interacts with the ferritin heavy chain and facilitates the delivery of ferritin to lysosomes for degradation (a process that has been termed ferritinophagy).9 Mice with global germline disruption of Ncoa4 exhibit hyperferremia, microcytic anemia, and elevated ferritin level and nonheme iron in multiple organs, demonstrating that NCOA4 is essential for maintaining systemic iron balance.10 NCOA4 is expressed in a variety of tissues,11 and recent studies have dissected the function of NCOA4 in the erythroid compartment. Mice with tissue-specific ablation of Ncoa4 in the erythroid lineage show increased nonheme iron levels in the bone marrow but exhibit mild microcytic anemia,12 consistent with prior work showing NCOA4 depletion impairs hemoglobinization in cultured erythroblasts13 and K562 erythroleukemia cells.14
The role of NCOA4 in nonerythroid cells and stimuli that regulate NCOA4 expression in different tissues require further clarification. NCOA4 was originally described as a coactivator of nuclear hormone receptors,15-18 and studies in cancer cell lines have shown NCOA4 messenger RNA (mRNA) modulation by thyroid19 and sex hormones20 and by knockdown of SOD221 and SOX4.22 Expression of ncoa4 was lost in Gata1-deficient zebrafish embryos23 but was upregulated in muscles of myostatin-deficient mice.24 Whether these regulatory mechanisms have relevance to NCOA4's role in iron metabolism is unclear.
In this study, we use a hepatocyte-targeted NCOA4 knockdown approach to define the local role of NCOA4 in regulating liver iron stores after phlebotomy. Additionally, we expand the current understanding of NCOA4 regulation by defining factors that govern NCOA4 mRNA levels in cells of hepatic origin.
Methods
Small interfering RNA reagents
Triantennary N-acetylgalactosamine (GalNAc)-conjugated small interfering RNAs (siRNAs) targeting murine Ncoa4 (5′-GGCCAAUUCAAUUGUCUUAUU-3′ [sense]; 5′-AAUAAGACAAUUGAAUUGGCCCA-3′ [antisense]) and luciferase,25 kindly provided by Alnylam Pharmaceuticals, were synthesized and characterized as described.26 Unconjugated commercial siRNAs are listed in supplemental Table 1 available on the Blood Web site.
In vitro studies
Hepa1-6 cells (ATCC CRL-1830) and Hep 3B2.1-7 (Hep3B) cells (ATCC HB-8064) were cultured in standard media at 37°C in 95% humidified air and 5% CO2. Treatments with ferric ammonium citrate, desferrioxamine, cobalt chloride, and dimethyloxalylglycine are described in supplemental Methods. Transfections were performed in 6-well plates with 10 nM total siRNA using Lipofectamine RNAiMAX (ThermoFisher).
Animal care and treatments
Animal studies were approved by the Yale University Institutional Animal Care & Use Committee. Female C57BL/6N mice (see supplemental Methods for sex rationale) were purchased from Charles River at 4 weeks of age, housed in the Yale Animal Resources Center with free access to food and water, and maintained on an iron-replete diet (Teklad Custom Diet TD.140595 [AIN-76A modification supplemented with 45 ppm iron as FeSO4; total iron content 46-51 ppm]), which meets growth requirements27 but avoids excessive hepatic iron loading.28 Sterile GalNAc-siRNA solutions or saline vehicle (≤220 μL volume) were injected subcutaneously under isoflurane anesthesia. Terminal blood samples were collected from the retro-orbital sinus under ketamine/xylazine anesthesia for serum preparation and complete blood count per the supplemental Methods, and organs were harvested after being euthanized. For phlebotomy experiments, blood (500 μL) was removed from the retro-orbital sinus under isoflurane anesthesia, followed immediately by intraperitoneal injection of warmed sterile saline (500 μL) as volume replacement. Teklad Custom Diet TD.80396 (2-6 ppm iron) was the iron-deficient diet.
Analysis of serum and tissue iron content
Nonheme iron concentrations of mouse tissues were determined by bathophenanthroline quantification.29 Serum iron concentrations and total iron binding capacity (TIBC) were determined by the BioVision TIBC Kit. Transferrin saturation was calculated as serum iron divided by TIBC.
RNA analysis
Total RNA from hepatoma cells and bone marrow cells was isolated using the RNeasy Mini Kit with on-column DNase digestion (Qiagen). Total RNA from homogenized, flash-frozen tissues was isolated using TRIzol (Invitrogen) and treated with DNase I (Invitrogen). RNA (500 µg) was reverse transcribed (iScript cDNA Synthesis Kit; Bio-Rad) and amplified in duplicates using the iTaq Universal SYBR Green Supermix (Bio-Rad) on an ABI7500 Real-Time PCR System. Primer sequences are given in supplemental Table 2.
Immunoblotting
Preparation of cell and liver lysates, as well as antibodies and immunoblotting conditions, is described in supplemental Methods and supplemental Table 3. NCOA4 antibody (Bethyl #A302-272A) specificity is demonstrated in supplemental Figure 1.
Statistical analysis
Statistical analyses were conducted in Prism 8 using unpaired, 2-tailed Student t test or using 1-way or 2-way analysis of variance (ANOVA) with Tukey’s post hoc test. P < .05 was considered statistically significant.
Results
GalNAc-Ncoa4-siRNA reduces Ncoa4 expression in mouse liver
To reduce NCOA4 expression in mouse liver, we developed triantennary N-acetylgalactosamine (GalNAc) conjugated siRNA targeting Ncoa4 (GalNAc-Ncoa4-siRNA). GalNAc-conjugated siRNAs suppress hepatocellular target RNAs in humans and other animals by promoting siRNA uptake by the asialoglycoprotein receptor (ASGPR), an endocytic receptor that shows extremely high expression by hepatocytes but minimal expression in extrahepatic tissues.30,31 We validated that GalNAc-Ncoa4-siRNA treatment lowered Ncoa4 mRNA levels in murine Hepa1-6 hepatoma cells, whereas GalNAc-conjugated siRNA targeting the firefly luciferase gene (GalNAc-Luc-siRNA) did not (Figure 1A). Twenty-four hours after injection, mice treated with GalNAc-Ncoa4-siRNA showed significantly lower liver Ncoa4 mRNA compared with controls treated with either GalNAc-Luc-siRNA or saline vehicle (Figure 1B). GalNAc-Ncoa4-siRNA induced marked Ncoa4 knockdown in liver but not other organs (Figure 1C).
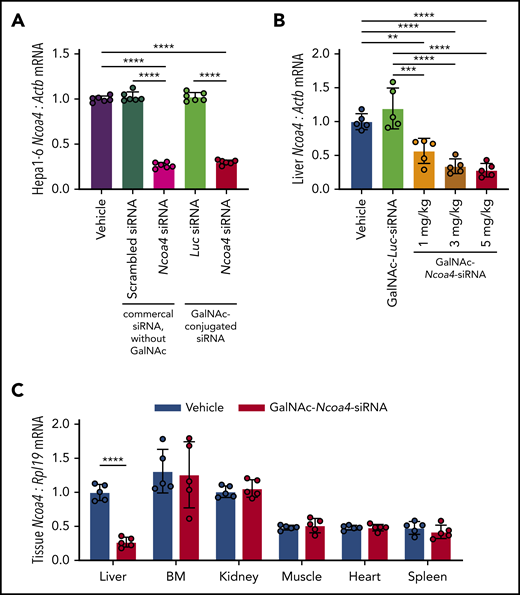
GalNAc-Ncoa4-siRNA induces Ncoa4 knockdown in murine hepatoma cells and mouse liver. (A) Ncoa4 expression relative to β-actin (Actb) in total RNA prepared from Hepa1-6 cells harvested 24 hours after treatment with transfection reagent alone (vehicle) or after transfection of a commercial scrambled control siRNA lacking a GalNAc-modification (Ambion Silencer Select Control No. 1 siRNA, cat. #4390843), a commercial murine Ncoa4-targeting siRNA lacking a GalNAc-modification (Ambion Silencer Select Ncoa4 siRNA #s77517), GalNAc-Luc-siRNA (Luc), or GalNAc-Ncoa4-siRNA. siRNAs (10 nM) were delivered with Lipofectamine RNAiMAX to 2.5 × 10⁵ cells per well. n = 6 per group. The mean mRNA expression ratio obtained from vehicle-treated cells was normalized to 1. In the absence of transfection reagent, direct addition of GalNAc-Ncoa4-siRNA to the culture media did not suppress Ncoa4 mRNA (data not shown), consistent with the reported absence of ASGPR expression in Hepa1-6 cells.63 (B) Ncoa4 expression relative to Actb in total RNA prepared from mouse livers harvested 24 hours after injection of vehicle, GalNAc-Luc-siRNA (3 mg/kg), or GalNAc-Ncoa4-siRNA (1, 3, or 5 mg/kg). The mean mRNA ratio obtained from livers of vehicle-treated mice was normalized to 1. n = 5 per group. (C) Ncoa4 expression relative to Rpl19 in total RNA prepared from a panel of mouse tissues harvested 24 hours after injection of either vehicle or GalNAc-Ncoa4-siRNA (5 mg/kg). BM, bone marrow. Expression of Rpl19 (rather than Actb) was used for normalization because of high expression of other actin isoforms in cardiac and skeletal muscle. The mean mRNA ratio obtained from livers of vehicle-treated mice was normalized to 1. n = 5 per group. For all panels, data represent mean ± standard deviation (SD). **P < .01, ***P < .001, and ****P < .0001 by 1-way ANOVA with Tukey’s post hoc test (panels A and B) or by Student t test (panel C).
GalNAc-Ncoa4-siRNA induces Ncoa4 knockdown in murine hepatoma cells and mouse liver. (A) Ncoa4 expression relative to β-actin (Actb) in total RNA prepared from Hepa1-6 cells harvested 24 hours after treatment with transfection reagent alone (vehicle) or after transfection of a commercial scrambled control siRNA lacking a GalNAc-modification (Ambion Silencer Select Control No. 1 siRNA, cat. #4390843), a commercial murine Ncoa4-targeting siRNA lacking a GalNAc-modification (Ambion Silencer Select Ncoa4 siRNA #s77517), GalNAc-Luc-siRNA (Luc), or GalNAc-Ncoa4-siRNA. siRNAs (10 nM) were delivered with Lipofectamine RNAiMAX to 2.5 × 10⁵ cells per well. n = 6 per group. The mean mRNA expression ratio obtained from vehicle-treated cells was normalized to 1. In the absence of transfection reagent, direct addition of GalNAc-Ncoa4-siRNA to the culture media did not suppress Ncoa4 mRNA (data not shown), consistent with the reported absence of ASGPR expression in Hepa1-6 cells.63 (B) Ncoa4 expression relative to Actb in total RNA prepared from mouse livers harvested 24 hours after injection of vehicle, GalNAc-Luc-siRNA (3 mg/kg), or GalNAc-Ncoa4-siRNA (1, 3, or 5 mg/kg). The mean mRNA ratio obtained from livers of vehicle-treated mice was normalized to 1. n = 5 per group. (C) Ncoa4 expression relative to Rpl19 in total RNA prepared from a panel of mouse tissues harvested 24 hours after injection of either vehicle or GalNAc-Ncoa4-siRNA (5 mg/kg). BM, bone marrow. Expression of Rpl19 (rather than Actb) was used for normalization because of high expression of other actin isoforms in cardiac and skeletal muscle. The mean mRNA ratio obtained from livers of vehicle-treated mice was normalized to 1. n = 5 per group. For all panels, data represent mean ± standard deviation (SD). **P < .01, ***P < .001, and ****P < .0001 by 1-way ANOVA with Tukey’s post hoc test (panels A and B) or by Student t test (panel C).
Because GalNAc-conjugated siRNA administered at 3 mg/kg dosing induced sustained (≥3 weeks) hepatic knockdown of other target mRNAs in mice,32,33 we used 3 mg/kg GalNAc-siRNA dosing for subsequent experiments. Mice showed normal body weight and complete blood count parameters when followed for 4 weeks after a single injection of GalNAc-Ncoa4-siRNA (supplemental Figure 2A-D). Compared with controls treated with either GalNAc-Luc-siRNA or saline, mice that received a single injection of GalNAc-Ncoa4-siRNA exhibited a marked reduction in hepatic Ncoa4 mRNA (Figure 2A) and protein (Figure 2B) that persisted at 4 weeks. Starting at 2 weeks after injection, liver nonheme iron concentration (LIC) was significantly higher in mice treated with GalNAc-Ncoa4-siRNA compared with either control group (Figure 2C). Four weeks after injection, hepatic protein levels of ferritin light chain (FTL) and ferritin heavy chain (FTH) subunits were significantly higher in mice treated with GalNAc-Ncoa4-siRNA compared with control groups (Figure 2D). However, GalNAc-Ncoa4-siRNA did not significantly alter serum ferritin or serum iron levels (supplemental Figure 2E-F), nor did it increase hepatic ferritin subunit mRNA (supplemental Figure 2G-H). GalNAc-Ncoa4-siRNA treatment did not alter liver histology, induce hepatic fibrosis, or raise hepatic mRNA encoding the acute phase reactant serum amyloid A1 (supplemental Figure 3A-B).
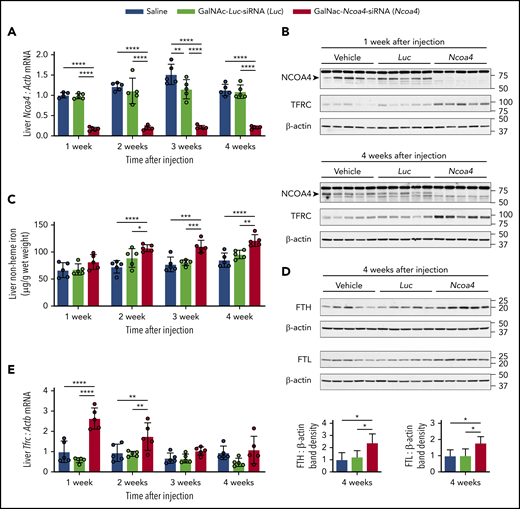
GalNAc-Ncoa4-siRNA treatment produces durable Ncoa4 knockdown in mouse liver and raises hepatic nonheme iron concentration. Shown are analyses of parameters assessed in mouse livers harvested 1, 2, 3, or 4 weeks after a single injection of vehicle, GalNAc-Luc-siRNA (3 mg/kg), or GalNAc-Ncoa4-siRNA (3 mg/kg). (A) Hepatic Ncoa4 mRNA expression relative to Actb. (B) Immunoblotting analyses of NCOA4, TFRC, and β-actin in liver protein lysates. Black arrowhead denotes a 70-kDa band corresponding to the expected molecular weight of NCOA4. (C) Liver nonheme iron concentration. (D) Immunoblotting analyses of FTL, FTH, and β-actin in liver protein lysates. The mean band density of FTL or FTH relative to β-actin from livers harvested 4 weeks after vehicle injection was normalized to 1. (E) Hepatic Tfrc mRNA expression relative to Actb. For panels A and E, the mean mRNA ratio obtained from livers harvested 1 week after vehicle injection was normalized to 1. For panels B and D, numbers on the right indicate the position of molecular weight markers in kiloDaltons. n = 5 per group. For all bar graphs, data represent mean ± SD. *P < .05, **P < .01, ***P < .001, and ****P < .0001 by 2-way ANOVA (panels A, C, E) or 1-way ANOVA (panel D) with Tukey’s post hoc test.
GalNAc-Ncoa4-siRNA treatment produces durable Ncoa4 knockdown in mouse liver and raises hepatic nonheme iron concentration. Shown are analyses of parameters assessed in mouse livers harvested 1, 2, 3, or 4 weeks after a single injection of vehicle, GalNAc-Luc-siRNA (3 mg/kg), or GalNAc-Ncoa4-siRNA (3 mg/kg). (A) Hepatic Ncoa4 mRNA expression relative to Actb. (B) Immunoblotting analyses of NCOA4, TFRC, and β-actin in liver protein lysates. Black arrowhead denotes a 70-kDa band corresponding to the expected molecular weight of NCOA4. (C) Liver nonheme iron concentration. (D) Immunoblotting analyses of FTL, FTH, and β-actin in liver protein lysates. The mean band density of FTL or FTH relative to β-actin from livers harvested 4 weeks after vehicle injection was normalized to 1. (E) Hepatic Tfrc mRNA expression relative to Actb. For panels A and E, the mean mRNA ratio obtained from livers harvested 1 week after vehicle injection was normalized to 1. For panels B and D, numbers on the right indicate the position of molecular weight markers in kiloDaltons. n = 5 per group. For all bar graphs, data represent mean ± SD. *P < .05, **P < .01, ***P < .001, and ****P < .0001 by 2-way ANOVA (panels A, C, E) or 1-way ANOVA (panel D) with Tukey’s post hoc test.
Compared with controls, mice treated with GalNAc-Ncoa4-siRNA showed elevated hepatic transferrin receptor (Tfrc) mRNA and protein (Figure 2B,E), suggesting aberrant iron homeostasis.34 Although mice treated with GalNAc-Ncoa4-siRNA showed higher LIC, their mean levels of serum hepcidin and of hepatic hepcidin (Hamp) and Bmp6 mRNA did not exceed those of controls (supplemental Figure 4A-C). When normalized to LIC, Hamp and Bmp6 mRNA levels in mice treated with GalNAc-Ncoa4-siRNA were significantly lower than both control groups 4 weeks after injection (supplemental Figure 4D-E). In mice treated with GalNAc-Ncoa4-siRNA, nonheme iron concentrations of kidney, heart, pancreas, muscle, and spleen did not exceed those of controls (supplemental Figure 5A-E). Collectively, these findings demonstrate that GalNAc-Ncoa4-siRNA achieves an acute reduction in hepatic Ncoa4 expression and that this reduction, when sustained, promotes modest but significant increases in LIC and hepatic ferritin subunit levels.
Hepatocyte-targeted NCOA4 knockdown impairs hepatic iron mobilization after blood loss
We next sought to determine whether hepatocyte-targeted Ncoa4 knockdown impairs the mobilization of iron stores from the liver after acute blood loss (Figure 3A). Eight-week-old C57BL/6N mice, raised on an iron-replete diet, received a single subcutaneous injection of GalNAc-Ncoa4-siRNA, GalNAc-Luc-siRNA, or saline vehicle. Seven days later, when significant NCOA4 protein knockdown was expected in mice treated with GalNAc-Ncoa4-siRNA (Figure 2B), mice in each treatment group were subjected to a single 500-μL phlebotomy that was followed immediately by volume replacement (intraperitoneally injected warmed, sterile saline). Because phlebotomy might remove GalNAc-Ncoa4-siRNA from the body and possibly reduce efficacy of NCOA4 knockdown achieved in the postphlebotomy period, immediately after phlebotomy, mice in each treatment group received a second subcutaneous injection matching the treatment they received at 8 weeks of age (ie, GalNAc-Ncoa4-siRNA, GalNAc-Luc-siRNA, or vehicle). To limit the availability of dietary iron to support erythropoietic recovery, mice in all 3 treatment groups were transferred to an iron-deficient diet (2-6 ppm) immediately after phlebotomy. Untreated, nonphlebotomized 8-week-old mice raised on the iron-replete diet were also phenotyped to provide an experimental baseline.
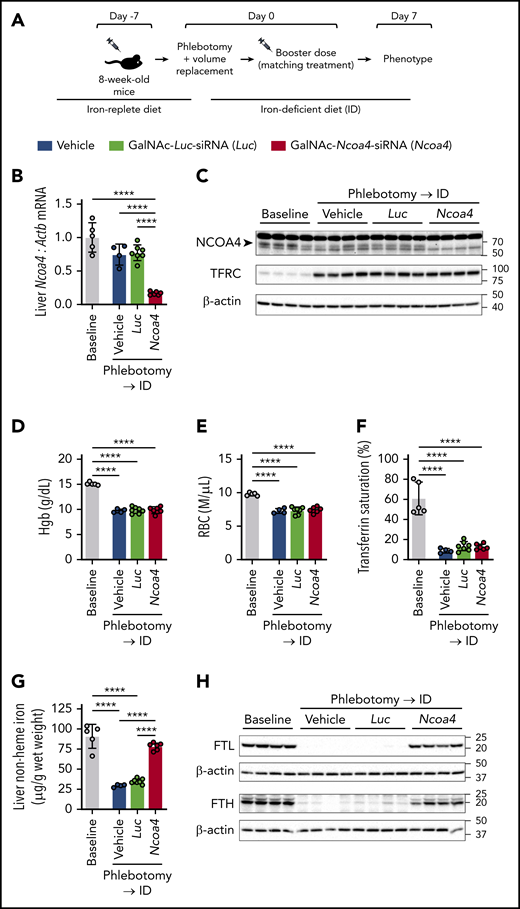
Large-volume phlebotomy fails to induce a marked reduction in liver nonheme iron concentration in mice with hepatocyte-targeted Ncoa4 knockdown. (A) Experimental design. Eight-week-old C57BL/6N mice raised on a 45 ppm iron-replete diet underwent a single subcutaneous (SC) injection of saline vehicle, GalNAc-Luc-siRNA (3 mg/kg), or GalNAc-Ncoa4-siRNA (3 mg/kg) 7 days before phlebotomy. On experimental day 0, mice in each treatment group underwent a single 500-μL phlebotomy, which was immediately followed by (1) intraperitoneal volume replacement, (2) a second SC injection matching the initial treatment (ie, a booster dose), and (3) transfer to a 2 to 6 ppm iron-deficient diet (ID). (B-H) Murine parameters assessed 7 days after phlebotomy. To provide an experimental baseline for comparison, data from 8-week-old nonphlebotomized mice that were maintained on the iron-replete diet and did not receive any injections are also presented (Baseline group). (B) Hepatic Ncoa4 mRNA expression relative to Actb. The mean mRNA ratio obtained from livers of the baseline group was normalized to 1. (C) Immunoblotting analyses of NCOA4, TFRC, and β-actin in liver protein lysates. The black arrowhead denotes a 70-kDa band corresponding to the expected molecular weight of NCOA4. (D) Hgb level. (E) RBC. (F) Transferrin saturation. (G) Liver nonheme iron concentration. (H) Immunoblotting analyses of FTL, FTH, and β-actin in liver protein lysates. n = 4-7 per group. For all bar graphs, data represent mean ± SD. In panels C and H, numbers on the right indicate the position of molecular weight markers in kiloDaltons. ****P < .0001 by 1-way ANOVA with Tukey’s post hoc test.
Large-volume phlebotomy fails to induce a marked reduction in liver nonheme iron concentration in mice with hepatocyte-targeted Ncoa4 knockdown. (A) Experimental design. Eight-week-old C57BL/6N mice raised on a 45 ppm iron-replete diet underwent a single subcutaneous (SC) injection of saline vehicle, GalNAc-Luc-siRNA (3 mg/kg), or GalNAc-Ncoa4-siRNA (3 mg/kg) 7 days before phlebotomy. On experimental day 0, mice in each treatment group underwent a single 500-μL phlebotomy, which was immediately followed by (1) intraperitoneal volume replacement, (2) a second SC injection matching the initial treatment (ie, a booster dose), and (3) transfer to a 2 to 6 ppm iron-deficient diet (ID). (B-H) Murine parameters assessed 7 days after phlebotomy. To provide an experimental baseline for comparison, data from 8-week-old nonphlebotomized mice that were maintained on the iron-replete diet and did not receive any injections are also presented (Baseline group). (B) Hepatic Ncoa4 mRNA expression relative to Actb. The mean mRNA ratio obtained from livers of the baseline group was normalized to 1. (C) Immunoblotting analyses of NCOA4, TFRC, and β-actin in liver protein lysates. The black arrowhead denotes a 70-kDa band corresponding to the expected molecular weight of NCOA4. (D) Hgb level. (E) RBC. (F) Transferrin saturation. (G) Liver nonheme iron concentration. (H) Immunoblotting analyses of FTL, FTH, and β-actin in liver protein lysates. n = 4-7 per group. For all bar graphs, data represent mean ± SD. In panels C and H, numbers on the right indicate the position of molecular weight markers in kiloDaltons. ****P < .0001 by 1-way ANOVA with Tukey’s post hoc test.
One week after phlebotomy, mice injected with GalNAc-Ncoa4-siRNA showed markedly suppressed hepatic Ncoa4 mRNA and protein levels (Figure 3B-C). Compared with the nonphlebotomized baseline group, mice in all 3 phlebotomized groups showed similar reductions in hemoglobin (Hgb), red blood cell count (RBC), transferrin saturation, serum iron, hepatic Hamp mRNA, and splenic nonheme iron concentration (Figure 3D-F; supplemental Figure 6A-C). The phlebotomized groups also showed similar increases in hepatic TFRC protein (Figure 3C) and spleen-to-body weight ratio (supplemental Figure 6D), as well as similar circulating reticulocyte counts and erythroid precursor distribution in the bone marrow (supplemental Figure 6E-F).
Despite exhibiting similar degrees of anemia and hypoferremia, phlebotomized mice that received GalNAc-Ncoa4-siRNA differed from phlebotomized controls in selected hepatic responses 1 week after phlebotomy. Although the LIC of phlebotomized mice injected with vehicle or GalNAc-Luc-siRNA was similarly reduced compared with the nonphlebotomized baseline group, the LIC of those injected with GalNAc-Ncoa4-siRNA was not significantly different from the LIC of nonphlebotomized mice (Figure 3G). Moreover, phlebotomized mice treated with vehicle or GalNAc-Luc-siRNA showed marked reductions in hepatic FTL and FTH subunits compared with nonphlebotomized mice, whereas phlebotomized mice treated with GalNAc-Ncoa4-siRNA showed higher hepatic FTL and FTH protein levels compared with the other phlebotomized groups (Figure 3H). Thus, mice with hepatocyte-targeted Ncoa4 knockdown exhibit impaired mobilization of hepatic iron stores after bleeding.
Mice treated with GalNAc-Ncoa4-siRNA after phlebotomy also showed abnormal hepatic responses if they remained on the iron-replete diet after phlebotomy (supplemental Figure 7A). Indeed, in contrast to phlebotomized controls injected with vehicle, phlebotomized mice with hepatocyte-targeted Ncoa4 knockdown (supplemental Figure 7B-D) failed to lower hepatic FTL, hepatic FTH, or LIC (supplemental Figure 7E-G) and also showed abnormal elevations of Tfrc mRNA and protein (supplemental Figure 7C-D,H). Compared with a nonphlebotomized baseline group, phlebotomized mice treated with GalNAc-Ncoa4-siRNA or vehicle showed similar reductions in serum iron, transferrin saturation, and hepatic Hamp mRNA on postphlebotomy day 3; however, on postphlebotomy day 7, Hamp mRNA and transferrin saturation differed in mice treated with GalNAc-Ncoa4-siRNA vs vehicle (supplemental Figure 8A-C). After phlebotomy, mice treated with GalNAc-Ncoa4-siRNA or vehicle showed similar changes in spleen-to-body weight ratio and splenic nonheme iron concentration, as well as similar absolute Hgb, RBC, and reticulocyte count (supplemental Figure 8D-H). Thus, in the setting of abundant dietary iron, the hematologic recovery that occurs within the first week after phlebotomy could be achieved without a reduction in hepatic iron stores.
NCOA4 expression is increased by chemicals that stabilize HIF
The finding that NCOA4 was required for mobilization of hepatic iron stores after phlebotomy suggests that physiologic changes after blood loss might enhance NCOA4 activity. Because NCOA4 protein may be degraded with ferritin in the lysosome during ferritinophagy, we hypothesized that conditions such as acute iron deficiency and/or hypoxia may induce NCOA4 mRNA as a mechanism to sustain NCOA4 supply for ferritinophagy. Indeed, we found that treatment of human Hep3B hepatoma cells with the iron chelator desferrioxamine (DFO) raised mRNA levels of TFRC (Figure 4A), a marker of intracellular iron deficiency, and of NCOA4 (Figure 4B). DFO treatment promotes stabilization of hypoxia inducible factor (HIF) transcription factors because the HIF prolyl hydroxylases (PHDs) that allow HIF-α subunits to be targeted for degradation are oxygen- and iron-dependent enzymes.35 Therefore, we examined the effects of other HIF-stabilizing chemicals on NCOA4 expression. NCOA4 mRNA in Hep3B cells was also significantly elevated on exposure to cobalt chloride (CoCl2), an antagonist of iron in PHDs36 (Figure 4C), and on exposure to dimethyloxalylglycine (DMOG), a synthetic analog of the endogenous PHD substrate α-ketoglutarate and a competitive inhibitor of PHDs37 (Figure 4D). Treatment with DFO, CoCl2, and DMOG also raised Ncoa4 mRNA in murine Hepa1-6 cells (supplemental Figure 9A-D). Additionally, by mining a published gene expression dataset,38 we found that mean Ncoa4 mRNA levels were higher in livers of mice after chronic exposure to hypoxic vs normoxic atmosphere (supplemental Figure 9E).
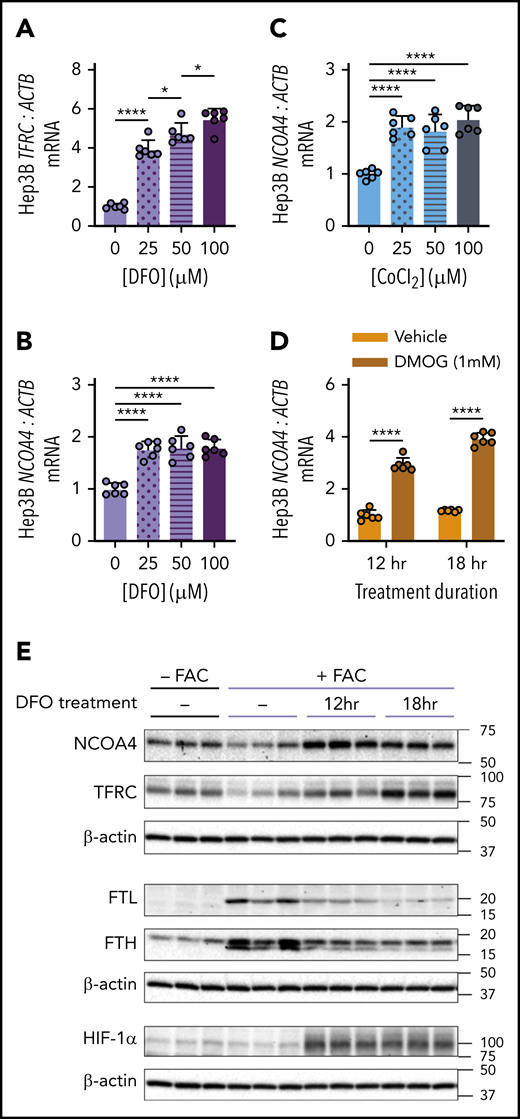
Chemicals that stabilize HIF raise NCOA4 expression in human hepatoma cells. (A) TFRC mRNA expression relative to ACTB in Hep3B cells after 18-hour treatment with the indicated concentrations of DFO. (B) NCOA4 mRNA expression relative to ACTB in Hep3B cells after 18-hour treatment with the indicated concentrations of DFO. (C) NCOA4 mRNA expression relative to ACTB in Hep3B cells after 18-hour treatment with the indicated concentrations of CoCl2. (D) NCOA4 mRNA expression relative to ACTB in Hep3B cells after 12- or 18-hour treatment with 1 mM DMOG or vehicle (dimethyl sulfoxide). For panels A-D, Hep3B cells were seeded in complete growth media (CM) at 2.5 × 10⁵ cells/well in 6-well plates. The following day, media were replaced with CM supplemented with the indicated concentration of the respective HIF-stabilizing chemical. After the treatment period indicated, RNA was harvested for quantitative reverse transcriptase-polymerase chain reaction analysis. n = 6 per group. For panels A-C, the mean mRNA ratio from cells that were not treated with the respective HIF-stabilizing chemical was normalized to 1. For panel D, the mean mRNA ratio from vehicle-treated cells at 12 hours was normalized to 1. For all bar graphs, data represent mean ± SD. (E) Immunoblotting analyses of NCOA4, TFRC, FTL, FTH, HIF-1α, and β-actin in protein lysates from Hep3B cells with or without FAC pretreatment and harvested before DFO treatment (−) or after 12 or 18 hours of DFO treatment, as outlined in supplemental Figure 10A. Hep3B cells were seeded at 2.5 × 10⁵ cells per well in 6-well plates in CM. After 24 hours, media were removed and replaced with either CM (−FAC) or CM supplemented with 50 μM FAC (+FAC). After an additional 24 hours, media were replaced with CM supplemented with 100 μM DFO. Proteins were harvested from the +FAC and −FAC groups at 3 timepoints: immediately before addition of DFO-supplemented CM (0 hr) and at 12 or 18 hours after addition of DFO-supplemented CM. Numbers on the right indicate the position of molecular weight markers in kiloDaltons. *P < .05 and ****P < .0001 by 1-way ANOVA (panels A-C) or 2-way ANOVA (panel D) with Tukey’s post hoc test.
Chemicals that stabilize HIF raise NCOA4 expression in human hepatoma cells. (A) TFRC mRNA expression relative to ACTB in Hep3B cells after 18-hour treatment with the indicated concentrations of DFO. (B) NCOA4 mRNA expression relative to ACTB in Hep3B cells after 18-hour treatment with the indicated concentrations of DFO. (C) NCOA4 mRNA expression relative to ACTB in Hep3B cells after 18-hour treatment with the indicated concentrations of CoCl2. (D) NCOA4 mRNA expression relative to ACTB in Hep3B cells after 12- or 18-hour treatment with 1 mM DMOG or vehicle (dimethyl sulfoxide). For panels A-D, Hep3B cells were seeded in complete growth media (CM) at 2.5 × 10⁵ cells/well in 6-well plates. The following day, media were replaced with CM supplemented with the indicated concentration of the respective HIF-stabilizing chemical. After the treatment period indicated, RNA was harvested for quantitative reverse transcriptase-polymerase chain reaction analysis. n = 6 per group. For panels A-C, the mean mRNA ratio from cells that were not treated with the respective HIF-stabilizing chemical was normalized to 1. For panel D, the mean mRNA ratio from vehicle-treated cells at 12 hours was normalized to 1. For all bar graphs, data represent mean ± SD. (E) Immunoblotting analyses of NCOA4, TFRC, FTL, FTH, HIF-1α, and β-actin in protein lysates from Hep3B cells with or without FAC pretreatment and harvested before DFO treatment (−) or after 12 or 18 hours of DFO treatment, as outlined in supplemental Figure 10A. Hep3B cells were seeded at 2.5 × 10⁵ cells per well in 6-well plates in CM. After 24 hours, media were removed and replaced with either CM (−FAC) or CM supplemented with 50 μM FAC (+FAC). After an additional 24 hours, media were replaced with CM supplemented with 100 μM DFO. Proteins were harvested from the +FAC and −FAC groups at 3 timepoints: immediately before addition of DFO-supplemented CM (0 hr) and at 12 or 18 hours after addition of DFO-supplemented CM. Numbers on the right indicate the position of molecular weight markers in kiloDaltons. *P < .05 and ****P < .0001 by 1-way ANOVA (panels A-C) or 2-way ANOVA (panel D) with Tukey’s post hoc test.
We next examined whether modulating iron status could alter NCOA4 protein levels in Hep3B cells (supplemental Figure 10A). Pretreating cells with ferric ammonium citrate (FAC) decreased protein levels of NCOA4 and TFRC and increased FTL and FTH (Figure 4E). In cells that received FAC pretreatment (Figure 4E), subsequent DFO treatment raised levels of NCOA4, TFRC, and hypoxia-inducible factor 1α (HIF-1α) but caused a progressive decrease in FTL and FTH. In the absence of FAC pretreatment, DFO also increased NCOA4, TFRC, and HIF-1α (supplemental Figure 10B). FTL and FTH levels, however, could not be assessed without FAC pretreatment because of low expression (data not shown). Collectively, these findings demonstrate that NCOA4 mRNA and protein levels rise after DFO treatment and that this upregulation occurs under conditions where HIF-1α protein is elevated.
NCOA4 expression is regulated by HIF
HIF-1α and HIF-2α subunits can heterodimerize with the constitutively expressed HIF-1β subunit to activate hypoxia response element (HRE)-mediated gene expression.39 To examine whether either HIF-α subunit could regulate NCOA4 mRNA expression, we knocked down HIF1A and/or HIF2A (official gene symbol EPAS1) using commercial siRNA and examined the ability of subsequent DFO treatment to raise NCOA4 mRNA in Hep3B cells. Transfection with HIF1A and/or HIF2A siRNA suppressed the respective mRNA regardless of DFO treatment (Figure 5A-B). As expected, in cells transfected with scrambled siRNA, DFO treatment significantly raised NCOA4 mRNA. Selective knockdown of HIF1A did not affect the induction of NCOA4 by DFO (Figure 5C), although HIF1A knockdown did cause a significant rise in HIF2A (Figure 5B), which might compensate for a reduction in HIF-1α. Selective knockdown of HIF2A significantly impaired the ability of DFO treatment to raise NCOA4 while dual knockdown of HIF1A/HIF2A further blunted the induction of NCOA4 mRNA (Figure 5C).
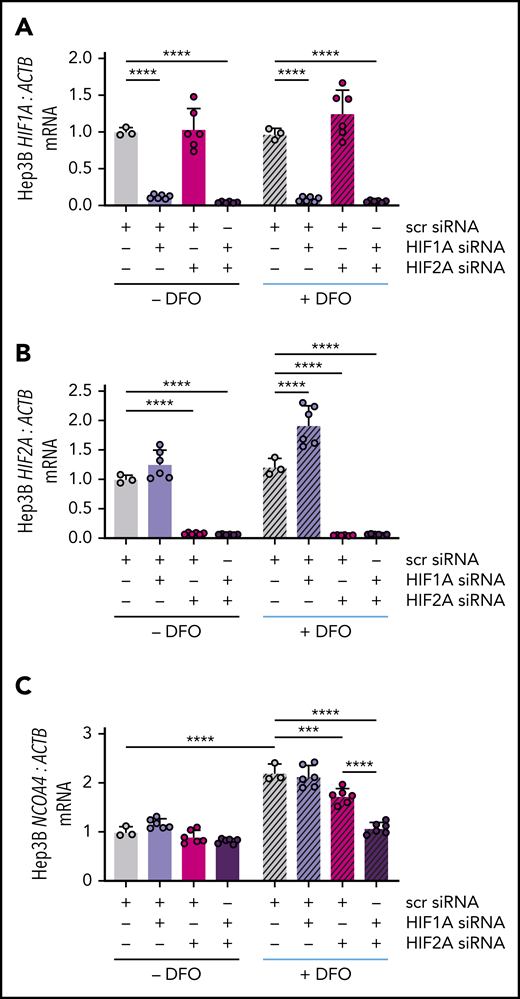
NCOA4 mRNA induction by DFO is blocked by combined HIF1A and HIF2A knockdown. (A) HIF1A, (B) HIF2A, and (C) NCOA4 expression relative to ACTB in Hep3B cells that were or were not treated with DFO after transfection with the indicated siRNAs. In this experiment, Hep3B cells (2.5 × 10⁵ cells per well in 6-well plates) were reverse-transfected with scrambled siRNA, HIF1A siRNA, and/or HIF2A siRNA in CM without antibiotics. Control cells were transfected with 10 nM scrambled siRNA. To deplete cells of either HIF1A or HIF2A, 5 nM scrambled siRNA plus 5 nM of the specific siRNA were used to control for total siRNA concentration. To deplete cells of both HIF1A and HIF2A, 5 nM of each specific siRNA was used. Twenty-four hours after transfection, some wells received additional DFO-supplemented CM without antibiotics to achieve a final DFO concentration of 100 μM (+DFO), whereas other wells received additional CM without antibiotics or DFO (−DFO). RNA was harvested for quantitative reverse transcriptase-polymerase chain reaction analysis 18 hours later. For all panels, the mean mRNA ratio from control cells that were not treated with DFO was normalized to 1. n = 3-6 per group. For all bar graphs, data represent mean ± SD. ***P < .001 and ****P < .0001 by 2-way ANOVA with Tukey’s post hoc test.
NCOA4 mRNA induction by DFO is blocked by combined HIF1A and HIF2A knockdown. (A) HIF1A, (B) HIF2A, and (C) NCOA4 expression relative to ACTB in Hep3B cells that were or were not treated with DFO after transfection with the indicated siRNAs. In this experiment, Hep3B cells (2.5 × 10⁵ cells per well in 6-well plates) were reverse-transfected with scrambled siRNA, HIF1A siRNA, and/or HIF2A siRNA in CM without antibiotics. Control cells were transfected with 10 nM scrambled siRNA. To deplete cells of either HIF1A or HIF2A, 5 nM scrambled siRNA plus 5 nM of the specific siRNA were used to control for total siRNA concentration. To deplete cells of both HIF1A and HIF2A, 5 nM of each specific siRNA was used. Twenty-four hours after transfection, some wells received additional DFO-supplemented CM without antibiotics to achieve a final DFO concentration of 100 μM (+DFO), whereas other wells received additional CM without antibiotics or DFO (−DFO). RNA was harvested for quantitative reverse transcriptase-polymerase chain reaction analysis 18 hours later. For all panels, the mean mRNA ratio from control cells that were not treated with DFO was normalized to 1. n = 3-6 per group. For all bar graphs, data represent mean ± SD. ***P < .001 and ****P < .0001 by 2-way ANOVA with Tukey’s post hoc test.
We next assessed a role for HIF-1α and HIF-2α in regulating NCOA4 protein levels (supplemental Figure 11). DFO treatment markedly raised HIF-1α and HIF-2α protein levels and transiently induced NCOA4 protein in Hep3B cells transfected with scrambled siRNA. However, the transient NCOA4 induction by DFO was attenuated in cells with dual HIF1A/HIF2A knockdown (Figure 6A). To dissect whether HIF-1α, HIF-2α, or both mediate the increase in NCOA4 protein levels after DFO treatment, we examined the response to DFO treatment in Hep3B cells transfected with HIF1A and/or HIF2A siRNA. As expected, in cells transfected with scrambled siRNA, DFO treatment increased NCOA4 protein, but in cells with dual HIF1A/HIF2A knockdown, DFO treatment was significantly less effective in raising NCOA4 protein (Figure 6B). Moreover, the induction of NCOA4 after DFO treatment was impaired to a similar degree in cells with selective HIF2A knockdown and in cells with dual HIF1A/HIF2A knockdown (Figure 6C). By contrast, selective HIF1A knockdown enhanced the induction of NCOA4 protein by DFO (Figure 6C); this induction may be driven by the compensatory increase in HIF-2α protein observed (P < .0001; scrambled vs HIF1A knockdown). Together, these results support a role for HIF-2α in NCOA4 regulation but do not exclude a role for HIF-1α.
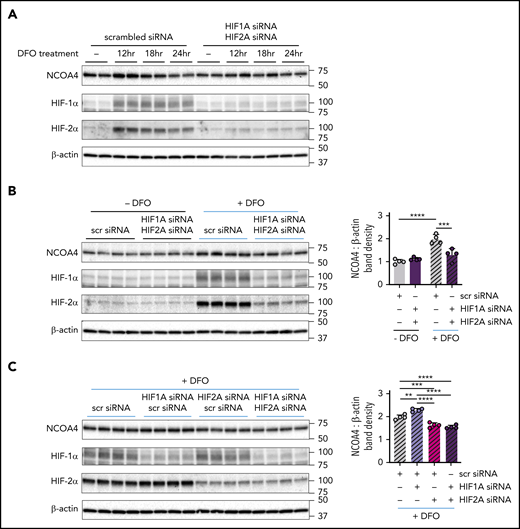
NCOA4 protein induction by DFO is modulated by HIF knockdown. (A) Immunoblotting analyses of NCOA4, HIF-1α, HIF-2α, and β-actin in protein lysates harvested from transfected Hep3B cells either before DFO treatment (−) or after 12, 18, or 24 hours of DFO treatment. For panel A, Hep3B cells, which had been grown in CM supplemented with 50 μM FAC (CM+FAC), were seeded at 2.5 × 10⁵ cells per well in 6-well plates and reverse transfected with either scrambled siRNA alone (10 nM) or with both HIF1A siRNA and HIF2A siRNA (each at 5 nM) in CM+FAC without antibiotics. Twenty-four hours later, the media were replaced with antibiotic-free CM supplemented with 100 μM DFO. Proteins were harvested from each siRNA group at 4 timepoints: immediately before addition of DFO-supplemented CM (0 hr) and at 12, 18, and 24 hours after addition of DFO-supplemented media, as diagramed in supplemental Figure 11. n = 2 per group. (B) Immunoblotting analyses of NCOA4, HIF-1α, HIF-2α, and β-actin in protein lysates harvested from Hep3B cells that were or were not treated with DFO, after transfection with the indicated siRNAs. The mean band density of NCOA4 relative to β-actin from Hep3B cells transfected with scrambled siRNA and not treated with DFO was normalized to 1. (C) Immunoblotting analyses of NCOA4, HIF-1α, HIF-2α, and β-actin in protein lysates harvested from Hep3B cells that were treated with DFO, after transfection with the indicated siRNAs. To facilitate relative comparisons between data in panels B and C, the data in panel C have been normalized by setting the mean NCOA4-to-β-actin band density ratio from the DFO-treated scrambled siRNA group (gray hatched bars in panel C) to its normalized mean value from panel B (gray hatched bars in panel B). For panels B and C, Hep3B cells (grown in CM supplemented with 50 μM FAC) were seeded at 2.5 × 10⁵ cells per well in 6-well plates and reverse transfected with scrambled siRNA, HIF1A siRNA, and/or HIF2A siRNA in the same combinations and concentrations used in Figure 5. Twenty-four hours after transfection, media was replaced with CM without antibiotics supplemented with 100 μM DFO (+DFO) or with CM without antibiotics (−DFO). Proteins were harvested 12 hours after the change in media. n = 4 per group. For both bar graphs, data represent mean ± SD. **P < .01, ***P < .001, and ****P < .0001 by 2-way (panel B) or 1-way ANOVA (panel C) with Tukey’s post hoc test. Numbers on the right indicate the position of molecular weight markers in kiloDaltons.
NCOA4 protein induction by DFO is modulated by HIF knockdown. (A) Immunoblotting analyses of NCOA4, HIF-1α, HIF-2α, and β-actin in protein lysates harvested from transfected Hep3B cells either before DFO treatment (−) or after 12, 18, or 24 hours of DFO treatment. For panel A, Hep3B cells, which had been grown in CM supplemented with 50 μM FAC (CM+FAC), were seeded at 2.5 × 10⁵ cells per well in 6-well plates and reverse transfected with either scrambled siRNA alone (10 nM) or with both HIF1A siRNA and HIF2A siRNA (each at 5 nM) in CM+FAC without antibiotics. Twenty-four hours later, the media were replaced with antibiotic-free CM supplemented with 100 μM DFO. Proteins were harvested from each siRNA group at 4 timepoints: immediately before addition of DFO-supplemented CM (0 hr) and at 12, 18, and 24 hours after addition of DFO-supplemented media, as diagramed in supplemental Figure 11. n = 2 per group. (B) Immunoblotting analyses of NCOA4, HIF-1α, HIF-2α, and β-actin in protein lysates harvested from Hep3B cells that were or were not treated with DFO, after transfection with the indicated siRNAs. The mean band density of NCOA4 relative to β-actin from Hep3B cells transfected with scrambled siRNA and not treated with DFO was normalized to 1. (C) Immunoblotting analyses of NCOA4, HIF-1α, HIF-2α, and β-actin in protein lysates harvested from Hep3B cells that were treated with DFO, after transfection with the indicated siRNAs. To facilitate relative comparisons between data in panels B and C, the data in panel C have been normalized by setting the mean NCOA4-to-β-actin band density ratio from the DFO-treated scrambled siRNA group (gray hatched bars in panel C) to its normalized mean value from panel B (gray hatched bars in panel B). For panels B and C, Hep3B cells (grown in CM supplemented with 50 μM FAC) were seeded at 2.5 × 10⁵ cells per well in 6-well plates and reverse transfected with scrambled siRNA, HIF1A siRNA, and/or HIF2A siRNA in the same combinations and concentrations used in Figure 5. Twenty-four hours after transfection, media was replaced with CM without antibiotics supplemented with 100 μM DFO (+DFO) or with CM without antibiotics (−DFO). Proteins were harvested 12 hours after the change in media. n = 4 per group. For both bar graphs, data represent mean ± SD. **P < .01, ***P < .001, and ****P < .0001 by 2-way (panel B) or 1-way ANOVA (panel C) with Tukey’s post hoc test. Numbers on the right indicate the position of molecular weight markers in kiloDaltons.
Compatible with direct transcriptional activation of NCOA4 by HIF, DFO significantly raised NCOA4 mRNA levels by 3 hours after treatment (Figure 7A). Increased HIF-1α and HIF-2α protein levels were observed within the first 3 hours of treatment, whereas elevated NCOA4 protein was evident by 6 hours (Figure 7B). By mining genome-wide chromatin immunoprecipitation (ChIP)-seq data from HepG2 hepatoma cells,40 we identified a region approximately 1.5 kb upstream of NCOA4 exon 1 bound by HIF-1α, HIF-2α, and HIF-1β (Figure 7C). HIF-1α binding to this region was also detected by genome-wide ChIP-on-chip in HepG2 and 2 other human cell lines.41 A canonical HRE motif falls at the center of this region (Figure 7C).
![DFO treatment causes an acute rise in NCOA4 mRNA and protein. (A) NCOA4 mRNA expression relative to ACTB in Hep3B cells that were treated with CM supplemented with DFO (+DFO) or with CM alone (−DFO) for the indicated time periods. The mean mRNA ratio from cells not treated with DFO and harvested at 3 hours was normalized to 1. n = 6 per group. **P < .01 and ****P < .0001 by 2-way ANOVA. n.s., not significant. (B) Immunoblotting analyses of NCOA4, HIF-1α, HIF-2α, and β-actin in protein lysates harvested from Hep3B cells that were treated with CM supplemented with DFO (+DFO) or with CM alone (−DFO) for the indicated time periods. Numbers on the right indicate the position of molecular weight markers in kiloDaltons. For panels A and B, Hep3B cells were seeded at 2.5 × 10⁵ cells/well in CM in 6-well plates. Twenty-four hours later (time 0 hr), some wells received additional DFO-supplemented CM to achieve a final DFO concentration of 100 μM (+DFO), whereas other wells received additional CM without DFO (− DFO). RNA and proteins were harvested 3, 6, 9, and 12 hours later. (C) Genomic binding profile of HIF-1α, HIF-2α, and HIF-1β (ARNT) subunits at the NCOA4 gene locus in HepG2 cells subjected to hypoxia. (Ci) A 50-kb genomic region of chromosome 10 containing the NCOA4 locus. (Cii) The genomic region shaded in gray from subpanel i is expanded to provide a high-resolution view of the NCOA4 promoter region. ChIP-seq data (Gene Expression Omnibus [GEO] DataSet GSE120885; GEO sample accession shown for each track),40 and genomic coordinates of the HIF-1α binding region identified by ChIP-on-chip (GEO DataSet GSE16347)41 were visualized in the UCSC Genome Browser (http://genome.ucsc.edu).64 The orange line indicates the genomic position of an HRE motif (chr10:51 563,614-51 563,618 on GRCh37/hg19 assembly). Also shown are DNase I hypersensitivity sites (DHS) identified in HepG2 cells and human hepatocytes by ENCODE65,66; chromatin accessibility has been proposed as a major factor in predicting HIF binding to the HRE motif.67 (D) Proposed model of HIF-mediated NCOA4 regulation in hepatocyte iron homeostasis. Under conditions of hypoxia and/or iron deficiency, such as after acute blood loss, the stabilized HIF-α subunit heterodimerizes with the HIF-β subunit and binds an HRE motif in the NCOA4 promoter region to enhance NCOA4 expression. This maintains a supply of NCOA4 protein to support ferritinophagy, making iron available for cellular export to meet extrahepatic iron demands.](https://ash.silverchair-cdn.com/ash/content_public/journal/blood/136/23/10.1182_blood.2020006321/2/m_bloodbld2020006321f7.png?Expires=1769093118&Signature=hWnhM6D5j3h5o3W568gJjUZOL9CotUU7xcMKCqVKB1Bahd89Z5xdwpT0hPteliuiGMHoYMEq~-2s4gWYLwh399VVnFcxt0J8IB6DExqOWDtIzUD6ds-0y7BQlS4N4CmFrfiwEZQ3iKlImynzCvWwQDAksa59j0GN8br8ytbCSwVSHYEyt2~QlCgVXlVroOSlLUdQf~Ve3X4jcyePNYFq5Flsxp-MSc4E2Q3g~c5uy2v-CM9xaVyQd9dRo3qa3slIkF5b3Zd2enMI~Gch9gOuuDHcMCVv2jnYHteABwfOYPdSF6lX-yLXBy4vQ3MheuSikTfPcYUbOEO1~5HL9NJ63Q__&Key-Pair-Id=APKAIE5G5CRDK6RD3PGA)
DFO treatment causes an acute rise in NCOA4 mRNA and protein. (A) NCOA4 mRNA expression relative to ACTB in Hep3B cells that were treated with CM supplemented with DFO (+DFO) or with CM alone (−DFO) for the indicated time periods. The mean mRNA ratio from cells not treated with DFO and harvested at 3 hours was normalized to 1. n = 6 per group. **P < .01 and ****P < .0001 by 2-way ANOVA. n.s., not significant. (B) Immunoblotting analyses of NCOA4, HIF-1α, HIF-2α, and β-actin in protein lysates harvested from Hep3B cells that were treated with CM supplemented with DFO (+DFO) or with CM alone (−DFO) for the indicated time periods. Numbers on the right indicate the position of molecular weight markers in kiloDaltons. For panels A and B, Hep3B cells were seeded at 2.5 × 10⁵ cells/well in CM in 6-well plates. Twenty-four hours later (time 0 hr), some wells received additional DFO-supplemented CM to achieve a final DFO concentration of 100 μM (+DFO), whereas other wells received additional CM without DFO (− DFO). RNA and proteins were harvested 3, 6, 9, and 12 hours later. (C) Genomic binding profile of HIF-1α, HIF-2α, and HIF-1β (ARNT) subunits at the NCOA4 gene locus in HepG2 cells subjected to hypoxia. (Ci) A 50-kb genomic region of chromosome 10 containing the NCOA4 locus. (Cii) The genomic region shaded in gray from subpanel i is expanded to provide a high-resolution view of the NCOA4 promoter region. ChIP-seq data (Gene Expression Omnibus [GEO] DataSet GSE120885; GEO sample accession shown for each track),40 and genomic coordinates of the HIF-1α binding region identified by ChIP-on-chip (GEO DataSet GSE16347)41 were visualized in the UCSC Genome Browser (http://genome.ucsc.edu).64 The orange line indicates the genomic position of an HRE motif (chr10:51 563,614-51 563,618 on GRCh37/hg19 assembly). Also shown are DNase I hypersensitivity sites (DHS) identified in HepG2 cells and human hepatocytes by ENCODE65,66 ; chromatin accessibility has been proposed as a major factor in predicting HIF binding to the HRE motif.67 (D) Proposed model of HIF-mediated NCOA4 regulation in hepatocyte iron homeostasis. Under conditions of hypoxia and/or iron deficiency, such as after acute blood loss, the stabilized HIF-α subunit heterodimerizes with the HIF-β subunit and binds an HRE motif in the NCOA4 promoter region to enhance NCOA4 expression. This maintains a supply of NCOA4 protein to support ferritinophagy, making iron available for cellular export to meet extrahepatic iron demands.
DFO treatment causes an acute rise in NCOA4 mRNA and protein. (A) NCOA4 mRNA expression relative to ACTB in Hep3B cells that were treated with CM supplemented with DFO (+DFO) or with CM alone (−DFO) for the indicated time periods. The mean mRNA ratio from cells not treated with DFO and harvested at 3 hours was normalized to 1. n = 6 per group. **P < .01 and ****P < .0001 by 2-way ANOVA. n.s., not significant. (B) Immunoblotting analyses of NCOA4, HIF-1α, HIF-2α, and β-actin in protein lysates harvested from Hep3B cells that were treated with CM supplemented with DFO (+DFO) or with CM alone (−DFO) for the indicated time periods. Numbers on the right indicate the position of molecular weight markers in kiloDaltons. For panels A and B, Hep3B cells were seeded at 2.5 × 10⁵ cells/well in CM in 6-well plates. Twenty-four hours later (time 0 hr), some wells received additional DFO-supplemented CM to achieve a final DFO concentration of 100 μM (+DFO), whereas other wells received additional CM without DFO (− DFO). RNA and proteins were harvested 3, 6, 9, and 12 hours later. (C) Genomic binding profile of HIF-1α, HIF-2α, and HIF-1β (ARNT) subunits at the NCOA4 gene locus in HepG2 cells subjected to hypoxia. (Ci) A 50-kb genomic region of chromosome 10 containing the NCOA4 locus. (Cii) The genomic region shaded in gray from subpanel i is expanded to provide a high-resolution view of the NCOA4 promoter region. ChIP-seq data (Gene Expression Omnibus [GEO] DataSet GSE120885; GEO sample accession shown for each track),40 and genomic coordinates of the HIF-1α binding region identified by ChIP-on-chip (GEO DataSet GSE16347)41 were visualized in the UCSC Genome Browser (http://genome.ucsc.edu).64 The orange line indicates the genomic position of an HRE motif (chr10:51 563,614-51 563,618 on GRCh37/hg19 assembly). Also shown are DNase I hypersensitivity sites (DHS) identified in HepG2 cells and human hepatocytes by ENCODE65,66 ; chromatin accessibility has been proposed as a major factor in predicting HIF binding to the HRE motif.67 (D) Proposed model of HIF-mediated NCOA4 regulation in hepatocyte iron homeostasis. Under conditions of hypoxia and/or iron deficiency, such as after acute blood loss, the stabilized HIF-α subunit heterodimerizes with the HIF-β subunit and binds an HRE motif in the NCOA4 promoter region to enhance NCOA4 expression. This maintains a supply of NCOA4 protein to support ferritinophagy, making iron available for cellular export to meet extrahepatic iron demands.
Discussion
NCOA4 is a ubiquitously expressed intracellular protein shown by in vitro studies8,9 to mediate the selective autophagic degradation of ferritin, the cellular iron storage complex. In this study, we show that in response to phlebotomy, mice with hepatocyte-targeted NCOA4 knockdown fail to appropriately lower liver iron stores, despite exhibiting the same degree of anemia and hypoferremia as phlebotomized controls. We also report for the first time that HIF-stabilizing chemicals raise NCOA4 mRNA levels in human and murine hepatoma cells and that dual HIF-1α/ HIF-2α knockdown attenuates the induction of NCOA4 by DFO treatment in Hep3B cells. These findings demonstrate that HIF regulates NCOA4 expression in cells of hepatic origin. Because the PHDs that regulate HIF stability are oxygen- and iron-dependent enzymes, our findings suggest a mechanism by which hypoxia and iron deficiency may alter NCOA4 expression to impact iron homeostasis (Figure 7D).
To achieve hepatocyte-targeted Ncoa4 knockdown, we used GalNAc-conjugated Ncoa4-targeting siRNA (GalNAc-Ncoa4-siRNA). Previous studies have shown that radiolabeled GalNAc-conjugated siRNAs are largely restricted to hepatocytes in the liver, with little or none detected in nonparenchymal cells.26,42 We found that GalNAc-Ncoa4-siRNA treatment caused marked Ncoa4 knockdown (∼80%) in mouse liver, which persisted for 4 weeks. The remaining Ncoa4 mRNA is likely attributable to expression in hepatic nonparenchymal cells. A single injection of GalNAc-Ncoa4-siRNA induced moderate increases in LIC and hepatic ferritin subunit levels after 4 weeks but did not increase nonheme iron content in other organs examined. Thus, any potential uptake of GalNAc-Ncoa4-siRNA by nonhepatic tissues is insufficient to raise their nonheme iron levels. Additionally, these changes in LIC and hepatic FTH/FTL were not nonspecific effects of GalNAc-conjugated siRNA, because they were not observed in control mice treated with GalNAc-Luc-siRNA. Of note, mice with constitutive global germline disruption of Ncoa410 or tamoxifen-induced global Ncoa4 loss12 showed much greater hepatic iron loading and FTH elevation, which may reflect disruption of Ncoa4 in all hepatic cell types and/or higher dietary iron content.
Gene expression analyses suggested aberrant hepatic iron homeostasis in mice with hepatocyte-targeted Ncoa4 knockdown. Hepatic transferrin receptor (TFRC) expression typically relates inversely to hepatic iron content,43,44 as Tfrc mRNA is stabilized by the binding of iron regulatory proteins on its iron response elements under low iron conditions.34 However, in mice treated with GalNAc-Ncoa4-siRNA, the rise in LIC was accompanied by hepatic TFRC elevation (Figure 2B, D-E). A prior study9 found NCOA4 knockdown in cancer cell lines raised levels of TFRC and the iron regulatory protein IRP2, suggesting that NCOA4 activity may influence the availability of intracellular iron. In mice, dietary iron loading induces expression of hepcidin45 and the BMP6 ligand,46 which is produced by liver sinusoidal endothelial cells and acts on hepatocytes to promote hepcidin production.47 In mice treated with GalNAc-Ncoa4-siRNA, however, the rise in LIC after 4 weeks was not accompanied by elevations of hepatic Hamp or Bmp6 mRNA or of serum hepcidin, suggesting that GalNAc-Ncoa4-siRNA treatment may disrupt normal hepatic iron-sensing pathways.
Leveraging the ability of GalNAc-Ncoa4-siRNA to achieve an acute and sustained reduction in hepatic Ncoa4 expression, we examined the effect of hepatocyte-targeted Ncoa4 knockdown on hepatic iron responses to large-volume phlebotomy. When dietary iron was abundant, mice treated with GalNAc-Ncoa4-siRNA failed to appropriately lower LIC and ferritin subunit levels after blood loss; however, hematologic recovery during the first week after phlebotomy was not dependent on a reduction in hepatic iron stores (supplemental Figures 7 and 8). When dietary iron was restricted, mice treated with GalNAc-Ncoa4-siRNA failed to appropriately lower LIC and ferritin subunit levels 1 week after blood loss, despite exhibiting the same degree of anemia and hypoferremia as controls (Figure 3). Thus, although in vitro studies indicate that ferritin degradation occurs through both lysosomal and proteasomal pathways,48-52 our findings suggest that NCOA4-independent cellular pathways do not have major roles in the large-scale mobilization of hepatic iron stores that occurs when dietary iron availability is restricted after phlebotomy.
Studies in cultured cells indicate that during, intracellular iron deficiency, NCOA4 regulates the delivery of ferritin to lysosomes, thereby regulating ferritin degradation.8,9 Our study reveals an effect of iron deficiency on NCOA4 mRNA, which we suggest may operate to maintain a supply of NCOA4 protein to support ferritinophagy. We found that treating human Hep3B hepatoma cells with the iron chelator DFO raised NCOA4 mRNA levels by 3 hours and protein levels by 6 hours (Figure 7A-B). NCOA4 mRNA levels remained elevated for at least 18 hours with DFO treatment (Figure 4B). Interestingly, NCOA4 protein levels appeared to decline after 12 hours of DFO treatment, whereas ferritin subunit levels also declined with DFO exposure (Figure 4E). These observations are compatible with the model9,14 in which NCOA4 protein is degraded alongside its ferritin cargo in the lysosome during iron deficiency. We note that the acute rise in NCOA4 protein observed in Hep3B cells on DFO treatment could reflect the combined effects of increased NCOA4 mRNA for translation and decreased NCOA4 protein degradation by the proteasome, because the HERC2 E3 ubiquitin-protein ligase can promote NCOA4 turnover under iron-replete conditions.14
We probed the mechanism underlying the upregulation of NCOA4 mRNA levels after DFO treatment. Although upregulation of NCOA4 mRNA levels under iron-deficient conditions could suggest that NCOA4 mRNA is regulated by iron regulatory proteins (IRPs), we and others9 have been unable to detect a canonical iron response element in the 3′ untranslated region of the NCOA4 mRNA. Because iron chelation can stabilize HIF,35 we hypothesized that HIF mediates the induction of NCOA4 mRNA on DFO treatment. Indeed, NCOA4 mRNA levels in human and murine hepatoma cells were also increased after treatment with DMOG, which stabilizes HIF not by acting as an iron chelator but rather as a competitive inhibitor of PHDs. Our knockdown studies in Hep3B cells dissected requirements for HIF-1α and HIF-2α, each of which can activate HRE-mediated gene expression, in NCOA4 regulation. Our results support a role for HIF-2α but do not exclude a role for HIF-1α. Published ChIP-seq data in hepatoma cells40 in fact suggest that both HIF-1α and HIF-2α can bind a region of the NCOA4 promoter that contains an HRE motif (Figure 7C).
Importantly, although HIF-1α and HIF-2α bind a common HRE sequence motif, they play distinct roles in regulating gene expression, which can reflect their tissue-specific expression, temporal pattern of induction, and interactions with other transcription factors.53-56 In our studies, mice were subjected to phlebotomy, a perturbation that alters both iron and oxygen homeostasis, and were phenotyped at time points to focus on LIC as a primary end point. At these time points, an upregulation of hepatic Ncoa4 mRNA was observed inconsistently in phlebotomized mice with intact Ncoa4 regulation (compare baseline vs saline vehicle groups in Figure 3B and in supplemental Figure 7B). We suggest that hepatic Ncoa4 mRNA levels after phlebotomy may reflect context-specific regulation by HIF, as well as crosstalk57,58 between HIF and iron regulatory mechanisms. Future examination of the acute hepatic responses to phlebotomy may be instructive, given that serum levels of erythropoietin, a HIF-2α target gene, peak in mice at 15 hours after bleeding under a similar phlebotomy protocol.59 Notably, in zebrafish larvae, hypoxic exposure significantly raised Ncoa4 mRNA by 1.6-fold within 24 hours.60 Whether modulating HIF may impact other reported functions of NCOA4, such as regulating DNA replication origins61 and serving as a coactivator of nuclear hormone receptors,15-18,62 remains to be tested.
In summary, we found that NCOA4 mediates the mobilization of hepatic iron stores after blood loss and that cells of hepatic origin upregulate NCOA4 on HIF stabilization. Small-molecule stabilizers of HIF, which increase erythropoietin production, are being developed for treatment of renal anemia.39 It will be of interest to determine whether these drugs also raise hepatic NCOA4 expression, potentially mobilizing liver iron and contributing to their beneficial effects on erythropoiesis.
Presented in part in abstract form at the 59th Annual Meeting of the American Society of Hematology, Atlanta, GA, 9 December 2017; the 60th annual meeting of the American Society of Hematology, San Diego, CA, 1 December 2018; and the 61th annual meeting of the American Society of Hematology, Orlando, FL, 8 December 2019.
For sharing of original data, please e-mail the corresponding author at karin.finberg@yale.edu.
The online version of this article contains a data supplement.
The publication costs of this article were defrayed in part by page charge payment. Therefore, and solely to indicate this fact, this article is hereby marked “advertisement” in accordance with 18 USC section 1734.
Acknowledgments
The authors thank James Butler, Mark Fleming, Chang Cao, Vincent Schulz, Jeanne Hendrickson, and Diane Krause for helpful discussions.
This work was supported by a Gruber Science Fellowship (X.L.), a Burroughs Wellcome Career Awards for Medical Scientists (K.E.F.), a Cooley’s Anemia Foundation Research Fellowship (K.E.F.), and National Institutes of Health (NIH), National Institute of General Medical Sciences grant T32 GM007205 (L.G.), NIH, National Heart, Lung, and Blood Institute grant T32 HL00797416 (N.A.-L.), and NIH, National Institute of Diabetes and Digestive and Kidney Diseases grants U54 DK106857 (Yale Cooperative Center for Excellence in Hematology) and P30 DK34989 (Yale Liver Center).
Authorship
Contribution: X.L., L.L., A.S., L.G., A.J., D.L., N.A.-L., and K.E.F. performed experiments and analyzed data. X.L. performed statistical analyses, prepared figures and tables, and wrote the manuscript. K.E.F. designed the study and wrote the manuscript.
Conflict-of-interest disclosure: The authors declare no competing financial interests.
The current affiliation for A.S. is Department of Pediatrics, Cincinnati Children's Hospital Medical Center, Cincinnati, OH.
Correspondence: Karin E. Finberg, Yale School of Medicine, Department of Pathology, 310 Cedar St, PO Box 208023, New Haven, CT 06520-8023; e-mail: karin.finberg@yale.edu.

This feature is available to Subscribers Only
Sign In or Create an Account Close Modal