

Key Points
Live cell tracking in a rhesus macaque model reveals that glucocorticoids induce bone marrow migration of eosinophils.
The effect is dependent on the glucocorticoid-responsive chemokine receptor CXCR4.

Abstract
Glucocorticoids are considered first-line therapy in a variety of eosinophilic disorders. They lead to a transient, profound decrease in circulating human eosinophils within hours of administration. The phenomenon of glucocorticoid-induced eosinopenia has been the basis for the use of glucocorticoids in eosinophilic disorders, and it has intrigued clinicians for 7 decades, yet its mechanism remains unexplained. To investigate, we first studied the response of circulating eosinophils to in vivo glucocorticoid administration in 3 species and found that the response in rhesus macaques, but not in mice, closely resembled that in humans. We then developed an isolation technique to purify rhesus macaque eosinophils from peripheral blood and performed live tracking of zirconium-89-oxine–labeled eosinophils by serial positron emission tomography/computed tomography imaging, before and after administration of glucocorticoids. Glucocorticoids induced rapid bone marrow homing of eosinophils. The kinetics of glucocorticoid-induced eosinopenia and bone marrow migration were consistent with those of the induction of the glucocorticoid-responsive chemokine receptor CXCR4, and selective blockade of CXCR4 reduced or eliminated the early glucocorticoid-induced reduction in blood eosinophils. Our results indicate that glucocorticoid-induced eosinopenia results from CXCR4-dependent migration of eosinophils to the bone marrow. These findings provide insight into the mechanism of action of glucocorticoids in eosinophilic disorders, with implications for the study of glucocorticoid resistance and the development of more targeted therapies. The human study was registered at ClinicalTrials.gov as #NCT02798523.
Introduction
Glucocorticoids are considered first-line therapy in a variety of eosinophilic disorders.1 Although the therapy is often effective, prolonged glucocorticoid use is associated with substantial toxicity.2 Our understanding of the mechanism of action of glucocorticoids in eosinophilic diseases remains very limited and has prevented the development of therapeutic alternatives that are equally efficacious but less toxic.
The first evidence that glucocorticoids could influence human eosinophil biology predated their now widespread clinical use as anti-inflammatory and immunosuppressive agents. In the year preceding the first therapeutic use of glucocorticoids, it was noted that the administration of either exogenous adrenocorticotropic hormone or hydrocortisone (then known as Kendall’s compound F) led to a profound, transient drop in circulating human eosinophils.3 The rapid eosinopenic response to exogenous adrenocorticotropic hormone was found to be so reproducible that the hormone was historically used in a clinical test of adrenocortical function, the Thorn test.4 The mechanism by which this phenomenon occurs has intrigued clinicians since that time and remains unexplained.
In principle, the rapid clearance of eosinophils from the peripheral circulation after glucocorticoid administration could result from changes in the expression of surface molecules on eosinophils, endothelial cells, or cells of the mononuclear phagocyte system; from an increase in the secretion of eosinophil chemoattractants in tissues; or from a combination of these factors. The kinetics of the response, with onset between 60 and 120 minutes after glucocorticoid administration,5 is not compatible with a decreased rate of myelopoiesis or eosinophil release from the bone marrow as a likely mechanism. In the earliest studies, intravascular lysis of eosinophils was considered but not supported by analyses of human blood exposed ex vivo to a glucocorticoid, and a normal eosinopenic response to glucocorticoids in splenectomized humans6 suggested that splenic sequestration is not the only mechanism involved.
Rodent models have not offered a convincing explanation for glucocorticoid-induced eosinopenia. The phenomenon has been documented in rats and guinea pigs, but histologic studies in those species have yielded inconclusive results.6-8 The recent findings of only modest levels of overlap in the glucocorticoid receptor binding sites identified by chromatin immunoprecipitation sequencing in different mouse or human cell lines,9,10 and evidence that the transcriptional response to glucocorticoids is highly cell type dependent,11 highlight the need for careful species model selection and a focus on specific cell types when trying to understand the effects of glucocorticoids in humans.
Studies of the effects of glucocorticoids on molecules that promote eosinophil adhesion12-14 or chemoattraction15-18 provide important clues about the mechanisms by which glucocorticoids could help decrease eosinophil recruitment to sites of inflammation, but they do not provide an explanation for the rapid clearance of eosinophils from the peripheral circulation.
Our recent study of the genome-wide transcriptional response of human eosinophils to glucocorticoids after in vivo treatment suggested that glucocorticoids induce a proapoptotic transcriptional program, although eosinophil apoptosis was not observed before migration out of the circulation.5 The same study revealed a consistent increase in expression of the chemokine receptor CXCR4, at the RNA and protein levels, between 60 and 120 minutes after glucocorticoid administration, which coincided with the timing of eosinophil egress from the circulation. This finding led us to hypothesize that the mechanism of glucocorticoid-induced eosinopenia involves CXCR4 upregulation, followed by migration of eosinophils to tissues rich in the CXCR4 ligand CXCL12, such as the bone marrow. To test this hypothesis, we first studied the response of circulating eosinophils to glucocorticoid administration in humans and 2 animal models and identified the rhesus macaque (Macaca mulatta) as an appropriate model for glucocorticoid-induced eosinopenia. We then developed a method of purification of rhesus macaque eosinophils from peripheral blood by immunomagnetic negative selection and performed live tracking of radiolabeled eosinophils before and after in vivo glucocorticoid administration. For this, we used an ex vivo cell-labeling technique with zirconium-89 (89Zr)-oxine for positron emission tomography (PET) imaging that was recently developed by our group.19,20 Taking advantage of the high sensitivity and quantitative capability of PET and the long half-life of 89Zr (3.3 days), this method enables longitudinal tracking and quantitative measurement of cell distributions in vivo, with negligible levels of radioactivity.19,20 Finally, we tested whether selective CXCR4 blockade would be sufficient to reduce the rapid egress of eosinophils from the peripheral circulation after glucocorticoid administration.
Methods
Kinetics of human eosinophils after in vivo glucocorticoid administration
Twenty healthy volunteers (10 men, 10 women; mean age, 37 years) were enrolled under National Institutes of Health (NIH) protocol 16-I-0126, which was approved by the Institutional Review Board of the National Institute of Allergy and Infectious Diseases (NIAID). Written informed consent was obtained. Each participant received a single IV dose of 250 mg methylprednisolone (Solu-Medrol; Pfizer) over 30 minutes. A complete blood count (CBC) was performed before and 4 hours after the start of infusion.
Kinetics of mouse eosinophils after in vivo glucocorticoid administration
B6.SJL mice were obtained from Taconic Biosciences [B6.SJL Cd45a(Ly5a)/Nai] and were handled in accordance with protocols approved by the NIAID Institutional Animal Care and Use Committee. Mice were randomly assigned to 1 of 2 groups. One group (n = 5) received methylprednisolone (5 µg/g, IV). Another group (n = 5) received normal saline (0.9% sodium chloride, IV). A CBC was performed 4 hours after injection.
Rhesus macaque eosinophil purification
Rhesus macaques were housed, handled, and underwent procedures conforming to a protocol approved by the Institutional Animal Care and Use Committee of the National Heart, Lung, and Blood Institute. Supplemental Table 1 (available on the Blood Web site) summarizes the information on each rhesus macaque. Apheresis was performed on a Fenwal CS-3000 cell separator (Baxter Healthcare).21 After apheresis, blood (40-44 mL) was diluted 1:2 with phosphate-buffered saline (PBS), layered over Ficoll-Paque Plus (GE Healthcare Life Sciences), and centrifuged (700g for 30 minutes at 25°C without brake). The granulocyte layer was transferred to new tubes and red blood cells (RBCs) were hypotonically lysed with 30 mL ice-cold double-distilled water. Lysis was stopped with 10 mL 4× PBS. After centrifugation (170g for 10 minutes at 4°C), hypotonic lysis was repeated. Pooled granulocytes were washed and resuspended to a concentration of 10 to 12 million cells/mL in wash buffer (PBS, 1% bovine serum albumin, and 1 mM EDTA) with 1.1% human FcR Blocking Reagent (Miltenyi Biotec). After 10 minutes at 4°C, the cells were labeled with anti-human CD64-PE antibody followed by anti-PE MicroBeads UltraPure (Miltenyi Biotec) for negative selection on an autoMACS Pro Separator (Miltenyi Biotec). Eosinophil purity was measured by counting ≥300 cells on cytospin preparations after staining with Kwik-Diff (Thermo Fisher Scientific).
Flow cytometry
Membrane phenotyping of blood eosinophils from humans and rhesus macaques was performed on fresh whole blood. Aliquots of blood (100 µL) were incubated with antibodies, and the RBCs were lysed with 1 mL lysis buffer (BD Biosciences). Samples were then washed with 1 mL PBS with 1% bovine serum albumin (fluorescence-activated cell sorting [FACS] buffer), centrifuged (300g for 5 minutes at 4°C), and resuspended in FACS buffer. When indicated, 7-amino actinomycin D (BD Biosciences) was added 10 minutes before flow cytometry.
Intracellular staining for eosinophil peroxidase (EPX) was performed on rhesus granulocytes obtained by Ficoll separation of blood and RBC lysis. The cells were incubated in FACS buffer with 10% mouse serum for 10 minutes on ice, then with anti-human VLA4-PE or anti-human CD64-PE. Samples were washed twice in PBS, then fixed with PBS with 1% paraformaldehyde (EM Sciences), for 10 minutes. After they were washed in FACS buffer with centrifugation (400g for 7 minutes at 4°C), the samples were permeabilized for 10 minutes with 100 μL FACS buffer with 0.1% saponin (IC FACS buffer; Sigma-Aldrich). The samples were washed with IC FACS buffer, blocked again for 10 minutes with 10% mouse serum, and stained with an anti-human EPX-Alexa700 antibody in IC FACS buffer.
To assess viability with or without 89Zr-oxine labeling, we incubated the cells with annexin V-FITC and propidium iodide in 1× binding buffer for 15 minutes at room temperature. Cell activation was assessed by staining with an anti-human CD69 antibody.
Acquisition was performed on an LSRII flow cytometer (BD Biosciences). Data were analyzed with FlowJo, v9.9.6 or v10.4.2.
Chemotaxis assays
Chemotaxis was assessed in Costar 24-well Transwell plates with 5.0-µm pore inserts (Corning). Cell culture medium (500 µL), with or without 100 ng/mL recombinant rhesus CCL11 (eotaxin; MyBiosource), was added to the lower chamber. Eosinophils (3 × 10⁵ cells/100 µL culture medium) were added to the upper chamber and incubated for 2 hours at 37°C with 5% CO2. Cells collected separately from the upper or lower chambers were quantified on an LSRII flow cytometer with a 180-second acquisition interval at high speed and constant flow. The proportion of migrating eosinophils was defined as the number of cells in the lower chamber over the sum of the cells in the upper and lower chambers. Data were analyzed with FlowJo, v9.9.6.
89Zr-oxine eosinophil labeling
89Zr-oxalate solution was produced at the institutional cyclotron facility and converted to 89ZrCl4.22 The 89Zr-oxine complex was generated as previously described.19 Purified eosinophils in PBS were incubated with 89Zr-oxine at 61.7 to 98.7 kBq/106 cells in a 30:1 volume ratio for 15 minutes at room temperature and washed 3 times by centrifugation at 170g for 10 minutes at 4°C in PBS with 1% autologous rhesus serum. The activity used for labeling was determined based on previous studies,19,20 to achieve doses that would not be radiotoxic to the cells (∼37 kBq/106 cells), with a labeling efficiency of ∼30% of the incubated activity.
Eosinophil tracking by PET/CT imaging
Deferoxamine was infused through a central catheter at an initial dose of 500 mg for 2 to 4 hours, followed by 2 to 3 mg/kg per hour, for the duration of the imaging study. Autologous 89Zr-oxine-labeled eosinophils were transferred to rhesus macaques IV (10.5 × 10⁶ to 97.3 × 10⁶ cells; 35.5 ± 8.0 kBq/106 cells, at 4.5 × 10⁶ ± 3.1 × 10⁶ cells/146.0 ± 81.5 kBq/kg) and PET/computed tomography (CT) imaging was serially acquired on a GE Discovery MI DR PET/CT system. On day 0, imaging was performed immediately after cell transfer (10-minute time point, corresponding to the midpoint of a 20-minute imaging period). To evaluate the kinetics of eosinophil passage through the lungs after reinjection, day 0 imaging was performed again 1 hour after cell transfer in 4 of the animals (supplemental Table 1). On day 1, imaging was performed at baseline (BL), then hourly for 4 hours. In the glucocorticoid group, 4 mg/kg methylprednisolone was injected 30 minutes after BL imaging. In the control group, no injection was performed. On day 2, a single image was obtained. PET images were reconstructed using GE’s Q CLEAR algorithm. VivoQuant (build 3.5; InVicro) was used to merge maximum intensity projection (MIP) PET images and CT. For quantification of 89Zr activity, volumes of interest were drawn on the acquired images, delineating the major organs with MIM Software v6.7.13; activity concentrations were then extracted and corrected for decay. For bone marrow, 89Zr activity in the trunk, humeri, and proximal half of femurs was quantified to keep the measured range consistent among PET scans and animals. The percentage of injected dose (% ID) was calculated by dividing the organ activity by the injected dose.
For quantification of 89Zr activity in blood, it is not possible to draw volumes of interest by delineating the entire vascular compartment, because most of the blood is expected to be in small vessels and capillaries. Therefore, we drew volumes of interest on the proximal aorta and inferior vena cava, to extract activity concentrations, and used the estimated blood volume of 60 mL/kg23 to calculate the blood % ID.
Kinetics of rhesus macaque eosinophils after in vivo glucocorticoid and/or plerixafor administration
Each animal received plerixafor (1 mg/kg, subcutaneously; Sigma), glucocorticoid (methylprednisolone, 4 mg/kg, IV), or plerixafor and glucocorticoid. In the plerixafor experiment, a CBC was performed at 0, 2, 4, 6, and 8 hours after treatment. In the glucocorticoid experiment, a CBC was performed at 0, 2, 4, and 6 hours after treatment. At each time point, CXCR4 expression on blood eosinophils was quantified by flow cytometry. In the combination experiment, glucocorticoid was given 6 hours after plerixafor injection, when the absolute eosinophil counts (AECs) had plateaued (supplemental Figure 6). CBCs were performed before (at BL) and 2 hours after glucocorticoid treatment. When the same animal was studied in more than 1 regimen, at least 2 weeks of washout time was given between experiments.
Statistics
Statistical comparisons of sample means in 2 independent groups of subjects were performed by 2-sample Student t tests. Statistical comparisons of sample means within the same group of subjects were performed by paired Student t tests.
To study the longitudinal trend of eosinophil localization in the different organs in glucocorticoid-treated or control rhesus macaques, linear regression was performed over the 3 macaques in the glucocorticoid arm and over the 3 macaques in the control arm, separately. In both regressions, the response was the organ 89Zr activity (expressed as a decay-corrected percentage of the injected dose) observed from BL to 4 hours; the regressors included the type of organ, the observation time, and their interaction. P values were calculated by the Wald test, which indicates whether a slope is significantly different from 0.
Additional details and product catalog numbers may be found in the supplemental Methods and in supplemental Table 2.
Results
The response of circulating eosinophils to glucocorticoid administration is similar in humans and rhesus macaques, but different in mice
We began by comparing the kinetics of the response of eosinophils and other major blood cell types to the administration of glucocorticoids in healthy human volunteers and in 2 animal models: rhesus macaque and mouse (Mus musculus). In the human volunteers (n = 20), who received an IV dose of 250 mg of methylprednisolone, we observed the expected change in cell composition: the proportion of neutrophils increased, whereas the proportions of lymphocytes, monocytes, eosinophils, and basophils decreased (Figure 1A, left; supplemental Figure 1). The decline in the relative and absolute counts of circulating eosinophils was reproducible across subjects and was statistically significant (Figure 1B, left). These findings were very similar to those observed in the adult rhesus macaques (n = 4), which received an IV dose of 4 mg/kg methylprednisolone. The similarities between the rhesus model and humans included the overall cell composition of peripheral blood (Figure 1A, center), as well as the relative and absolute counts of circulating eosinophils (Figure 1B, center), at BL and in response to the glucocorticoid. The results observed in rhesus and humans were different from those observed in the mice, which received an IV dose of 5 µg/g of methylprednisolone (n = 5) or vehicle (n = 5). In the mouse model, the relative increase in neutrophils in response to glucocorticoids was much less pronounced (Figure 1A, right) and the decline in blood eosinophils was not observed (Figure 1B, right). We concluded that the rhesus macaque would be a more appropriate model for the study of glucocorticoid-induced eosinopenia.

In vivo kinetics of circulating eosinophils and other blood cells after glucocorticoid administration in 3 species. Twenty healthy human volunteers received a single IV dose of glucocorticoid (methylprednisolone, 250 mg). Four adult rhesus macaques received a single IV dose of glucocorticoid (methylprednisolone, 4 mg/kg). Ten adult B6.SJL mice were randomly divided into 2 groups. One group (n = 5) received a single IV dose of glucocorticoid (methylprednisolone, 5 µg/g). Another group (n = 5) received vehicle (normal saline) at the same volume as the glucocorticoid-treated animals. The cell composition of peripheral blood was assayed by automated CBCs in a clinical laboratory. (A) Blood composition among the 3 species, at BL and in response to glucocorticoid (GC). The relative proportion of each color corresponds to the mean percentage of the respective cell type in the species displayed. WBC, white blood cell. (B) Top: relative abundance (expressed as a percentage of total WBCs) of eosinophils in peripheral blood, before and after glucocorticoid administration, in each of the 3 species. Bottom: AEC in peripheral blood, before and after glucocorticoid administration, in each of the species. In human and rhesus macaque cells, values at BL and in response to glucocorticoid (4 hours) are shown. In mice, values in vehicle- or glucocorticoid-treated animals are shown. Error bars represent the mean ± SD. Statistical analyses of the human and rhesus data were performed with a paired Student t test. Statistical analysis of the mouse data was performed with a Student t test for independent samples.
In vivo kinetics of circulating eosinophils and other blood cells after glucocorticoid administration in 3 species. Twenty healthy human volunteers received a single IV dose of glucocorticoid (methylprednisolone, 250 mg). Four adult rhesus macaques received a single IV dose of glucocorticoid (methylprednisolone, 4 mg/kg). Ten adult B6.SJL mice were randomly divided into 2 groups. One group (n = 5) received a single IV dose of glucocorticoid (methylprednisolone, 5 µg/g). Another group (n = 5) received vehicle (normal saline) at the same volume as the glucocorticoid-treated animals. The cell composition of peripheral blood was assayed by automated CBCs in a clinical laboratory. (A) Blood composition among the 3 species, at BL and in response to glucocorticoid (GC). The relative proportion of each color corresponds to the mean percentage of the respective cell type in the species displayed. WBC, white blood cell. (B) Top: relative abundance (expressed as a percentage of total WBCs) of eosinophils in peripheral blood, before and after glucocorticoid administration, in each of the 3 species. Bottom: AEC in peripheral blood, before and after glucocorticoid administration, in each of the species. In human and rhesus macaque cells, values at BL and in response to glucocorticoid (4 hours) are shown. In mice, values in vehicle- or glucocorticoid-treated animals are shown. Error bars represent the mean ± SD. Statistical analyses of the human and rhesus data were performed with a paired Student t test. Statistical analysis of the mouse data was performed with a Student t test for independent samples.
Rhesus eosinophils can be purified as CD64-negative granulocytes and radiolabeled without toxicity
As an initial step toward live cell tracking, we needed a method of purification of circulating rhesus eosinophils. Circulating rhesus neutrophils do not express CD16,24 which is the major surface marker used to discriminate human neutrophils from eosinophils. Siglec-8, a surface receptor that serves as a marker for human eosinophils, is not expressed on rhesus eosinophils.25 We found that the integrin VLA4 was expressed on human and rhesus blood eosinophils and that CD64 was expressed on rhesus neutrophils but not on eosinophils (Figure 2A). To confirm that CD64-negative rhesus granulocytes were indeed eosinophils, we studied granulocyte pellets after Ficoll centrifugation. VLA4+ rhesus granulocytes were also positive for the eosinophil-specific intracellular marker EPX, and the same was true of the CD64− fraction (Figure 2B).

Purification and 89Zr-oxine labeling of rhesus blood eosinophils. (A) Flow cytometric analysis with cell surface staining for CD16, Siglec-8, VLA4, or CD64 in human and rhesus whole-blood samples. Representative plots are shown for each marker. (B) Representative dot plots show flow cytometric analysis with cell surface staining for VLA4 or CD64 followed by intracellular staining for EPX in rhesus granulocytes. (C) A representative image shows nuclear and cytoplasmic morphology of rhesus eosinophils after purification. (D) Eosinophil purity in the CD64-negative rhesus granulocyte fraction. Shown is the relative abundance of 5 WBC types in the purified cell fraction in 5 independent experiments. Error bars represent mean ± SD. (E-H) Apoptosis, viability, activation, and migration assays measured by flow cytometry in purified rhesus eosinophils, with or without 89Zr-oxine labeling: percentage of cells positive for the early apoptosis marker annexin V (E), in 4 independent experiments; percentage of nonviable cells, defined as cells positive for both annexin V and propidium iodide, in 4 independent experiments; (G) percentage of cells positive for the activation marker CD69, in 3 independent experiments (F); and in vitro migration of purified rhesus eosinophils, with or without 89Zr-oxine labeling (H), toward control (no chemokine) or recombinant rhesus CCL11. The percentage of cells that migrated toward CCL11 on a Transwell assay after 2 hours of incubation, in 4 independent experiments, is shown. Statistical analysis of the data in panels E-H was performed with the paired Student t test.
Purification and 89Zr-oxine labeling of rhesus blood eosinophils. (A) Flow cytometric analysis with cell surface staining for CD16, Siglec-8, VLA4, or CD64 in human and rhesus whole-blood samples. Representative plots are shown for each marker. (B) Representative dot plots show flow cytometric analysis with cell surface staining for VLA4 or CD64 followed by intracellular staining for EPX in rhesus granulocytes. (C) A representative image shows nuclear and cytoplasmic morphology of rhesus eosinophils after purification. (D) Eosinophil purity in the CD64-negative rhesus granulocyte fraction. Shown is the relative abundance of 5 WBC types in the purified cell fraction in 5 independent experiments. Error bars represent mean ± SD. (E-H) Apoptosis, viability, activation, and migration assays measured by flow cytometry in purified rhesus eosinophils, with or without 89Zr-oxine labeling: percentage of cells positive for the early apoptosis marker annexin V (E), in 4 independent experiments; percentage of nonviable cells, defined as cells positive for both annexin V and propidium iodide, in 4 independent experiments; (G) percentage of cells positive for the activation marker CD69, in 3 independent experiments (F); and in vitro migration of purified rhesus eosinophils, with or without 89Zr-oxine labeling (H), toward control (no chemokine) or recombinant rhesus CCL11. The percentage of cells that migrated toward CCL11 on a Transwell assay after 2 hours of incubation, in 4 independent experiments, is shown. Statistical analysis of the data in panels E-H was performed with the paired Student t test.
Immunomagnetic negative selection of rhesus granulocytes with anti-CD64 antibodies yielded a cell population with the classic histologic features of eosinophils on light microscopy (Figure 2C). No signs of eosinophil degranulation were observed on cytospin preparations. The eosinophil purity of the CD64− fraction after negative selection, as measured by manual counting on cytospin slides, had a mean of 89.7% and a range of 82.6% to 96.0%. The main contaminating cell types were lymphocytes (mean = 4.8%) and neutrophils (mean = 2.1%) (Figure 2D).
Purified rhesus eosinophils were then subjected to 89Zr-oxine labeling at 35.5 ± 8.0 kBq/106 cells. Radiolabeling with 89Zr-oxine did not induce significant changes in the proportion of cells that underwent apoptosis (Figure 2E), the proportion of nonviable cells (Figure 2F), the proportion of activated cells (Figure 2G), or the functional response of the cells to a chemotactic stimulus (Figure 2H).
Eosinophils migrate to the bone marrow after glucocorticoid administration
To directly address the question of where eosinophils migrate when they leave the circulation after glucocorticoid administration, we transferred autologous 89Zr-oxine-labeled rhesus eosinophils and performed serial PET/CT imaging. Because 89Zr is released from dead cells, deferoxamine was infused throughout the imaging period to chelate free 89Zr for renal clearance and thus allow for serial imaging of live cells. Figure 3A summarizes the experimental design.

Glucocorticoids induce bone marrow migration of eosinophils. Circulating rhesus eosinophils were purified, labeled with 89Zr-oxine, and reinjected. PET/CT imaging was performed to track the location of the cells over time, with or without glucocorticoid administration. (A) Experimental design. Day 0 corresponds to the day of cell reinjection. Imaging on day 0 was performed immediately after reinjection (indicated by the 10-minute time point, which corresponds to the midpoint of the 20-minute imaging session), and 1 hour after reinjection. On day 1, animals in the treatment arm each received a single intravenous dose of glucocorticoid (GC, methylprednisolone 4 mg/kg), administered 30 minutes after BL PET imaging. Subsequent images were acquired hourly (counting from the time of BL imaging) for 4 hours. Control (Ctrl) animals were imaged serially at the same time points, without GC administration. Three independent experiments were performed per group, each on a different day in an unrelated adult rhesus macaque. The abbreviations and colors for each time point are preserved in the other panels of the figure to facilitate interpretation. (B) Live tracking of 89Zr-oxine–labeled eosinophils in the first hour after cell reinjection on day 0. Representative MIP PET/CT images at 10 minutes and 1 hour on day 0 are shown (top, SUV: standardized uptake value). The quantification of 89Zr distribution expressed as % ID with decay correction, is plotted for each organ at each imaging time point (bottom). These values indicate the percentage of the total 89Zr activity in a given organ’s volume, relative to the injected dose. (C) Live tracking of 89Zr-oxine labeled eosinophils in the absence (top) or presence (bottom) of glucocorticoid administration on day 1. Representative MIP PET/CT images at BL and 4 hours. (D) Sagittal and axial images of the spine in glucocorticoid-treated animals, before (BL) and after (4 hours) glucocorticoid injection. The red lines indicate the locations of the axial slice planes shown at the bottom. PET/CT images of 1 representative animal are shown. (E) Localization of 89Zr-oxine labeled eosinophils over time, with or without glucocorticoid administration. The x-axis is the time (in hours) after BL imaging. The y-axis displays 89Zr-oxine labeled eosinophil distribution, expressed as a decay-corrected percentage of the injected dose. Data are displayed separately for each of 4 organs: bone marrow, liver, lung, or spleen. Linear regression was performed separately for the 3 animals in the glucocorticoid arm and the 3 animals in the control arm. In both regressions, the response is organ 89Zr distribution (from the 89Zr-oxine labeled-eosinophils) expressed as a percentage of the injected dose; the regressors are the type of organ, the observation time point, and their interaction. The slope, or rate of change in each organ, is shown along with the P value from a Wald test indicative of whether the slope is significantly different from 0.
Glucocorticoids induce bone marrow migration of eosinophils. Circulating rhesus eosinophils were purified, labeled with 89Zr-oxine, and reinjected. PET/CT imaging was performed to track the location of the cells over time, with or without glucocorticoid administration. (A) Experimental design. Day 0 corresponds to the day of cell reinjection. Imaging on day 0 was performed immediately after reinjection (indicated by the 10-minute time point, which corresponds to the midpoint of the 20-minute imaging session), and 1 hour after reinjection. On day 1, animals in the treatment arm each received a single intravenous dose of glucocorticoid (GC, methylprednisolone 4 mg/kg), administered 30 minutes after BL PET imaging. Subsequent images were acquired hourly (counting from the time of BL imaging) for 4 hours. Control (Ctrl) animals were imaged serially at the same time points, without GC administration. Three independent experiments were performed per group, each on a different day in an unrelated adult rhesus macaque. The abbreviations and colors for each time point are preserved in the other panels of the figure to facilitate interpretation. (B) Live tracking of 89Zr-oxine–labeled eosinophils in the first hour after cell reinjection on day 0. Representative MIP PET/CT images at 10 minutes and 1 hour on day 0 are shown (top, SUV: standardized uptake value). The quantification of 89Zr distribution expressed as % ID with decay correction, is plotted for each organ at each imaging time point (bottom). These values indicate the percentage of the total 89Zr activity in a given organ’s volume, relative to the injected dose. (C) Live tracking of 89Zr-oxine labeled eosinophils in the absence (top) or presence (bottom) of glucocorticoid administration on day 1. Representative MIP PET/CT images at BL and 4 hours. (D) Sagittal and axial images of the spine in glucocorticoid-treated animals, before (BL) and after (4 hours) glucocorticoid injection. The red lines indicate the locations of the axial slice planes shown at the bottom. PET/CT images of 1 representative animal are shown. (E) Localization of 89Zr-oxine labeled eosinophils over time, with or without glucocorticoid administration. The x-axis is the time (in hours) after BL imaging. The y-axis displays 89Zr-oxine labeled eosinophil distribution, expressed as a decay-corrected percentage of the injected dose. Data are displayed separately for each of 4 organs: bone marrow, liver, lung, or spleen. Linear regression was performed separately for the 3 animals in the glucocorticoid arm and the 3 animals in the control arm. In both regressions, the response is organ 89Zr distribution (from the 89Zr-oxine labeled-eosinophils) expressed as a percentage of the injected dose; the regressors are the type of organ, the observation time point, and their interaction. The slope, or rate of change in each organ, is shown along with the P value from a Wald test indicative of whether the slope is significantly different from 0.
We first assessed the pattern of eosinophil distribution after reinjection, in the absence of glucocorticoid administration. Shortly after IV transfer, eosinophils migrated primarily to the lungs. By 1 hour, the cells had transited through the lungs, and ∼22% had migrated to the bone marrow, 19% to the liver, and 5% to the spleen, where they remained in similar proportions 1 and 2 days after reinjection (Figure 3B; supplemental Figure 2).
To test the effect of glucocorticoid administration, we chose day 1 after cell transfer, when the cells had reached a steady state of distribution. We administered methylprednisolone (4 mg/kg, IV) to 3 unrelated adult rhesus macaques and performed serial PET imaging hourly for 4 hours after BL imaging. As a negative control, we followed the same imaging regimen on 3 adult rhesus macaques without methylprednisolone administration (Figure 3A). Within 4 hours of glucocorticoid administration, we observed the expected drop in the relative counts of circulating eosinophils, as well as a decrease in cell-associated 89Zr activity in peripheral blood (supplemental Figure 3). At the same time, 89Zr signals in the bone marrow had increased, with the signals often filling the bone marrow area, suggesting that glucocorticoids had induced rapid bone marrow homing of eosinophils (Figure 3C-D; supplemental Video 1). We then quantified the 89Zr activity over time in the 4 organs in which 89Zr signal had been detected: bone marrow, liver, lungs, and spleen. As expected, in untreated animals, the distribution of 89Zr remained stable in the 4 organs (Figure 3E, left). In contrast, in glucocorticoid-treated animals, the distribution of 89Zr in the bone marrow increased significantly after glucocorticoid administration (slope = 1.58; P = .038; mean increase = 5.6% of injected dose), whereas the distribution in the other organs showed no significant change (Figure 3E, right). In the same time interval, the estimated reduction in 89Zr activity in the blood (mean reduction = 6.1% of injected dose; supplemental Figure 4) corresponded approximately to the observed increase in signal in the bone marrow, indicating that the observed change in the bone marrow was sufficient to explain the depletion of radiolabeled eosinophils from the blood.
Glucocorticoid-induced eosinopenia is CXCR4 dependent
We had previously found that glucocorticoids induce expression of the chemokine receptor CXCR4 in human eosinophils between 60 and 120 minutes after medication administration, which coincides with the timing of eosinophil egress from the circulation.5 The human and rhesus macaque genomes have a fully conserved glucocorticoid response element (GRE) near the CXCR4 transcription start site (Figure 4A). This specific recognition motif is known to be absent from the mouse genome at the Cxcr4 locus, and in vitro treatment of mouse hematopoietic stem or progenitor cells with a glucocorticoid has been shown not to upregulate Cxcr4 at the transcript or protein levels.26 A sequence homology search revealed that the human and rhesus GRE immediately upstream of CXCR4 is partially conserved in guinea pigs and absent in the mouse or rat genomes, although a search for matches of the GR position weight matrix (JASPAR27 Core 2018: MA0113.3) with the program PWMScan28 revealed other predicted GRE sequences upstream of Cxcr4 in the mouse and rat genomes.
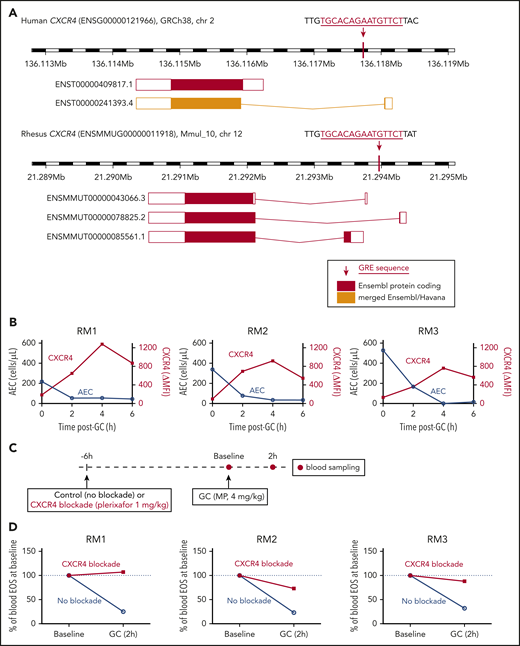
Glucocorticoid-induced eosinopenia is CXCR4 dependent. (A) The CXCR4 locus in the human and rhesus genomes, highlighting the location of the GREs relative to the known transcript isoforms in each species. (B) Peripheral blood AECs and eosinophil surface expression of CXCR4 over time after a single dose of methylprednisolone (4 mg/kg IV). Results of 3 independent experiments, each in 1 unrelated adult rhesus macaque. CXCR4 surface levels are expressed as ΔMFI (MFI CXCR4 staining minus MFI isotype control). (C) Experimental design for testing the effect of CXCR4 blockade on glucocorticoid-induced eosinopenia. (D) Glucocorticoid-induced eosinopenia in the presence or absence of CXCR4 blockade. Eosinophil counts are expressed as a percentage of the BL count for each condition. Results of 3 independent experiments, each in 1 unrelated adult rhesus macaque. GC, glucocorticoid; MP, methylprednisolone; RM, rhesus macaque.
Glucocorticoid-induced eosinopenia is CXCR4 dependent. (A) The CXCR4 locus in the human and rhesus genomes, highlighting the location of the GREs relative to the known transcript isoforms in each species. (B) Peripheral blood AECs and eosinophil surface expression of CXCR4 over time after a single dose of methylprednisolone (4 mg/kg IV). Results of 3 independent experiments, each in 1 unrelated adult rhesus macaque. CXCR4 surface levels are expressed as ΔMFI (MFI CXCR4 staining minus MFI isotype control). (C) Experimental design for testing the effect of CXCR4 blockade on glucocorticoid-induced eosinopenia. (D) Glucocorticoid-induced eosinopenia in the presence or absence of CXCR4 blockade. Eosinophil counts are expressed as a percentage of the BL count for each condition. Results of 3 independent experiments, each in 1 unrelated adult rhesus macaque. GC, glucocorticoid; MP, methylprednisolone; RM, rhesus macaque.
Given the high level of conservation between the rhesus and human genomes at the CXCR4 locus, including the presence of a fully conserved GRE, we then tested whether glucocorticoids lead to an increase in CXCR4 expression on the surface of rhesus eosinophils and whether the kinetics of this effect are consistent with those of glucocorticoid-induced eosinopenia, as had been observed in humans. We administered methylprednisolone (4 mg/kg, IV) to 3 unrelated adult rhesus macaques and measured circulating eosinophil counts and CXCR4 expression on eosinophils serially, before and after each administration. We found that the kinetics of glucocorticoid-induced eosinopenia was similar between rhesus and human, with the greatest effect occurring in the first 2 hours after administration of the medication. Surface expression of CXCR4 in circulating rhesus eosinophils increased as the eosinophil count dropped (Figure 4B; supplemental Figure 5), consistent with our prior observations in humans.5
To test whether glucocorticoid-induced eosinopenia was CXCR4-dependent, we then administered methylprednisolone (4 mg/kg, IV) to 3 unrelated adult rhesus macaques, in the presence or absence of the CXCR4 blocker plerixafor, which inhibits the interaction between CXCR4 and its canonical ligand, CXCL12 (Figure 4C). Because plerixafor is known to mobilize cells from the bone marrow, we first studied the effect of plerixafor alone on circulating eosinophil counts over time. Plerixafor led to an increase in circulating rhesus eosinophils, which stabilized after 6 hours (supplemental Figure 6). Based on this observation, we chose 6 hours as the most appropriate time interval between plerixafor and glucocorticoid administration (Figure 4C). We then measured circulating eosinophil counts before and at the critical 2-hour interval after glucocorticoid administration. In the absence of CXCR4 blockade, we observed the expected decrease in circulating eosinophils within 2 hours of glucocorticoid administration. In the presence of CXCR4 blockade, glucocorticoid-induced eosinopenia was decreased or eliminated (Figure 4D).
Although plerixafor is usually considered to be a specific CXCR4 blocker, there is biochemical evidence that it also binds the atypical chemokine receptor ACKR3 (previously called CXCR7). To assess whether ACKR3 could also play a role in glucocorticoid-induced eosinopenia or be a potential confounder in our CXCR4 blockade experiments, we reviewed our existing data set from the human eosinophil transcriptome analysis before and at 3 time points after in vivo administration of a glucocorticoid (GEO accession number GSE111789). We found no evidence of ACKR3 expression in human eosinophils at BL or in response to glucocorticoids (supplemental Figure 7).
To explore the possibility that, in addition to induction of CXCR4 expression, glucocorticoids could induce CXCL12 expression in target tissues, we reviewed our existing data set of transcriptome analysis in 9 hematopoietic or nonhematopoietic primary human cell types treated in vitro with a glucocorticoid (GEO accession number GSE112101). We found no evidence of induction of CXCL12 expression in any of the human cell types studied, and a statistically significant reduction in CXCL12 expression in fibroblasts, myoblasts, and osteoblasts (supplemental Figure 8).
Discussion
The phenomenon of glucocorticoid-induced eosinopenia has intrigued clinicians for 7 decades and is the basis for the now widespread use of glucocorticoids to treat diseases in which eosinophils play an important pathophysiologic role. Our findings indicate that the mechanism of glucocorticoid-induced eosinopenia involves CXCR4-dependent migration of circulating eosinophils to the bone marrow.
We first studied the eosinophil response to in vivo glucocorticoid administration in 3 species: human, mouse, and rhesus macaque. Our results highlight the importance of relying on experimental data rather than predictions or assumptions about interspecies differences or similarities when studying the response to glucocorticoids, in keeping with the growing evidence of substantial species and cell type-specificity in the patterns of GR binding and transcriptional response to glucocorticoids. The extent of this specificity and the fact that there are thousands of GREs in the genome of each species, with different GR binding patterns in each cell type, mean that, even when a similar phenotypic response to glucocorticoids is observed among species, the underlying mechanism could be different. We identified the rhesus macaque as an appropriate model for the study of glucocorticoid-induced eosinopenia, because the kinetics of the eosinopenic response, the GRE of interest, and the timing of CXCR4 upregulation by eosinophils in response to in vivo glucocorticoid treatment mirrored those in humans. We then developed a method for purification of rhesus eosinophils by immunomagnetic negative selection, which resulted in high purity, viability, and normal function. To study the migration pattern of eosinophils after glucocorticoid administration in vivo, we relied on an 89Zr-oxine ex vivo cell labeling method for PET imaging that had recently been developed by our team. This method offers the advantages of high sensitivity and minimal toxicity to hematopoietic cells when optimal radiolabeling doses are used.19,20,29 In the present study, 89Zr-oxine labeling did not induce measurable changes in apoptosis, activation, or in vitro migration in purified eosinophils before reinjection. Deferoxamine was infused continuously throughout the imaging period, to bind any free 89Zr released from eosinophils and facilitate its rapid urinary clearance. In the absence of deferoxamine, free 89Zr can bind hydroxyapatite within bones30 or be transferred from dead cells to phagocytes.
Shortly after reinjection, eosinophils were distributed primarily to the lungs. Their transit time through the lungs was shorter than that of most cells that have been tracked in vivo to date,31-33 but consistent with a previous study of human eosinophils and neutrophils labeled with 99mTc–hexamethylpropyleneamine oxime.34 Within 1 hour of reinjection, the cells reached a steady state of distribution, which was stable for at least 48 hours, providing a time window for evaluating the effect of glucocorticoid administration on eosinophil migration in vivo.
This method enabled us to document that the primary site of eosinophil migration after glucocorticoid administration is the bone marrow. In human and rhesus circulating eosinophils, glucocorticoids induced expression of the chemokine receptor CXCR4 between 60 and 120 minutes after the medication was administered, coinciding with the timing of eosinophil egress from the circulation. The bone marrow is rich in the CXCR4 ligand CXCL12, which likely serves as the main chemoattractant. We therefore tested the effect of selective pharmacologic blockade of the CXCR4/CXCL12 interaction by the small molecule plerixafor on glucocorticoid-induced eosinopenia. Because CXCR4 blockade is known to mobilize eosinophils from the bone marrow, we first had to identify a kinetic window for investigating the effect of CXCR4 blockade on glucocorticoid administration. To accomplish this, we measured eosinophil counts over time, before and after CXCR4 blockade with plerixafor alone. We found that plerixafor led to the expected early rise in eosinophil counts and that this increase stabilized at ∼6 hours. This time frame offered a kinetic window for studying the effect of CXCR4 blockade on glucocorticoid administration at a time when the eosinophil count was stable, but when we would still expect there to be sufficient plerixafor (a drug with a plasma half-life of 3-5 hours) in the circulation to effectively block the newly expressed CXCR4. Knowing from the preceding imaging studies that glucocorticoids induce migration of eosinophils to the bone marrow, if the mechanism of glucocorticoid-induced eosinopenia was unrelated to CXCR4, we would have expected glucocorticoids to disrupt the balance and lead to a decrease in circulating eosinophil counts, similar to that observed in the absence of CXCR4 blockade. Instead, glucocorticoid-induced eosinopenia was blunted or eliminated in the presence of the CXCR4 blocker, indicating that bone marrow migration of eosinophils induced by glucocorticoids is indeed CXCR4-dependent and likely is the major mechanism behind glucocorticoid-induced eosinopenia, although the contribution of other mechanisms cannot be ruled out.
It is possible that glucocorticoid-induced upregulation of CXCR4 on eosinophils already in the bone marrow, resulting in increased retention, contributes to the decrease seen in the blood, but data supporting this hypothesis are lacking to date. Moreover, pharmacokinetic data on an anti-IL-5 antibody, which causes maturational arrest of cells in the bone marrow, suggest that the appreciable impact of decreased bone marrow release of eosinophils is not reflected in blood levels until 12 to 24 hours,35 which is inconsistent with the rapid kinetics of glucocorticoid-induced eosinopenia. Also, although we cannot completely exclude a role for other mechanisms, our review of existing data sets of primary human cells treated in vivo or in vitro with glucocorticoids suggests that upregulation of ACKR3 in eosinophils, or of CXCL12 in target tissues, is unlikely to be involved in glucocorticoid-induced eosinopenia.
Our results are most consistent with a model in which the threshold for surface CXCR4 expression for eosinophils to migrate to the bone marrow is considerably lower than the peak level of expression induced by glucocorticoids. Such a model would explain why migration occurs as surface CXCR4 levels increase and is nearly complete before the peak level of surface CXCR4 expression is reached. In this model, the levels of CXCR4 expression observed at 6 hours, which are still substantially higher than those observed at BL, could be sufficient to keep the cells out of the circulation. However, the fate of eosinophils after glucocorticoid-induced bone marrow migration is not yet clear, and it is possible that eosinophils are retained in the bone marrow by other mechanisms after the peak of CXCR4 expression. We know from previous studies that, in addition to CXCR4, glucocorticoids induce the expression of a proapoptotic transcriptional program in circulating eosinophils, which includes increased expression of the proapoptotic genes BTG1, PRUNE2, TXNIP, and BCL2L11.5 However, apoptosis of human eosinophils does not occur before their egress from the peripheral circulation.5 Because the CXCR4-dependent migration of eosinophils to the bone marrow occurs within the first 2 hours of glucocorticoid administration, if the glucocorticoid-induced transcriptional reprogramming of the cells is sufficient for them to undergo apoptosis, it seems likely that this occurs in the bone marrow, where they could be cleared by cells of the mononuclear phagocyte system.
Beyond the interest in explaining a decades-old medical mystery, dissecting the mechanism of glucocorticoid-induced eosinopenia is important for at least 2 reasons. First, glucocorticoids are highly effective in most patients, but their use results in substantial toxicity related to effects that are outside of the target tissue. A better understanding of their effects on eosinophils opens the possibility of identifying more targeted therapies that, alone or in combination, could target the specific effects that result in clinical benefit for patients with eosinophilic disorders, without the many side effects that are associated with glucocorticoid therapy. Second, patients with eosinophilic disorders vary in the magnitude of their clinical response to glucocorticoids, and the identification and management of glucocorticoid-resistant patients therefore remains a challenge.36 It is important to establish the extent to which glucocorticoid resistance in patients with eosinophilic disorders could be related to the level of induction of CXCR4 expression, to the BL level of CXCL12 expression, or to genetic variation at these 2 loci.
For original data sets or protocols, please contact the corresponding authors.
The online version of this article contains a data supplement.
The publication costs of this article were defrayed in part by page charge payment. Therefore, and solely to indicate this fact, this article is hereby marked “advertisement” in accordance with 18 USC section 1734.
Acknowledgments
The authors thank Kate Stringaris, Robert Reger, and Robert Donahue for constructive discussion and technical assistance; Karen Keeran, Kenneth Jeffries, Victoria Haley, Arthur Zetts, and the Division of Veterinary Resources (DVR) staff for animal care; Lawrence Szajek for generating 89ZrCl4; Philip Eclarinal, Alicia Forest, and Hoa Tieu for assisting with the PET/CT scans; and Erina He (National Institutes of Health [NIH] Medical Arts) for creating the video.
This work was supported by the Intramural Research Programs of the National Institutes of Health, National Institute of Allergy and Infectious Diseases, the National Heart, Lung and Blood Institute, the National Cancer Institute, and the National Institute of Arthritis and Musculoskeletal and Skin Diseases.
Authorship
Contribution: S.G.H., N.S., F.L., and L.M.F. drafted the manuscript; N.S., S.G.H., F.L., M.G., M.M., K.S., K.N.H., S.J.Y., N.S.L., R.R.C., T.H., and L.M.F. performed the experimental work; L.M.F., N.S., A.D.K., C.E.D., S.G,H., F.L., and P.L.C. designed the study; L.M.F., N.S., S.G.H., F.L., and Z.H. analyzed the data; and all authors reviewed and approved the final version of the manuscript.
Conflict-of-interest disclosure: P.L.C. and N.S. possess a US patent for the 89Zr-oxine complex cell-labeling method and have filed US and international patent applications for the generation and use of the 89Zr-oxine complex employed in this study. The remaining authors declare no competing financial interests.
The current affiliation of L.M.F. and M.G. is Systemic Autoimmunity Branch, National Institute of Arthritis and Musculoskeletal and Skin Diseases, National Institutes of Health, Bethesda, MD.
Correspondence: Luis M. Franco, Systemic Autoimmunity Branch, National Institute of Arthritis and Musculoskeletal and Skin Diseases, National Institutes of Health, Bethesda, MD 20892; e-mail: luis.franco@nih.gov; and Noriko Sato, National Cancer Institute, National Institutes of Health, Bethesda, MD 20892; e-mail: saton@mail.nih.gov.

This feature is available to Subscribers Only
Sign In or Create an Account Close Modal