

Key Points
RET cell surface expression and activity is enriched in HSCs.
RET activation by glial-derived neurotrophic factor and its coreceptor improves long-term HSC outgrowth in vitro and transplantation in vivo.

Abstract
Expansion of human hematopoietic stem cells (HSCs) is a rapidly advancing field showing great promise for clinical applications. Recent evidence has implicated the nervous system and glial family ligands (GFLs) as potential drivers of hematopoietic survival and self-renewal in the bone marrow niche; how to apply this process to HSC maintenance and expansion has yet to be explored. We show a role for the GFL receptor, RET, at the cell surface of HSCs in mediating sustained cellular growth, resistance to stress, and improved cell survival throughout in vitro expansion. HSCs treated with the key RET ligand/coreceptor complex, glial-derived neurotrophic factor and its coreceptor, exhibit improved progenitor function at primary transplantation and improved long-term HSC function at secondary transplantation. Finally, we show that RET drives a multifaceted intracellular signaling pathway, including key signaling intermediates protein kinase B, extracellular signal-regulated kinase 1/2, NF-κB, and p53, responsible for a wide range of cellular and genetic responses that improve cell growth and survival under culture conditions.
Introduction
Hematopoietic stem cells (HSCs) are highly potent stem cells of the blood system, known to reside in the bone marrow of adults and umbilical cord blood (UCB) during pregnancy. Although a bone marrow biopsy is invasive and harsh, collection of UCB represents a less invasive, clinically important source of HSCs and progenitors (HSPCs) for the treatment of a wide range of malignant and nonmalignant disorders. UCB has a lower incidence of graft-versus-host disease, with less stringent donor cross-matching required compared with classical donor sources, thus increasing its value for both hematologic and nonhematologic malignancies.1 Despite increased UCB banking, limited progenitor cell dose,2 delay of engraftment and immune reconstitution3 and the cost of double UCB transplantation in adults4 underscore the need to improve expansion and potency of these cells for the purposes of transplantation.
To address these limitations, critical advances have been made in both the identification and successful outgrowth of HSCs from bone marrow and UCB sources.5-11 In spite of these advances, further expansion of HSCs is required to address clinical issues associated with delayed engraftment/immune reconstitution and the relative paucity of HSCs produced at the end of current culture protocols.
In recent years, there has been increasing evidence that the nervous system may be important for communication with, and influence over, the hematopoietic system. Central to this theory, a receptor tyrosine kinase, RET, has been shown to be expressed in murine HSCs. RET plays an important role in their survival in vivo and potentiating outgrowth in vitro when activated by glial-derived neurotrophic factor (GDNF) family ligands and coreceptors, mediating Bcl2 expression.12 These findings indicate that neuronal signals are critically important for HSC efficacy and may have a role in mitigating the stress response exerted on HSCs during in vitro expansion.
Here, we investigated the role of RET at the cell surface of UCB-derived HSCs and the effect of the RET ligand/coreceptor complex (GDNF/GFRα1) on outgrowth, initial in vivo potency, and long-term stem cell potential of UCB-derived HSPCs. We monitored key changes in protein-signaling cascades to understand the intracellular state governed by RET, and provide a mechanism by which activation of RET can be a positive addition to current culture methods for clinical purposes.
Methods
Primary human samples
UCB was collected from full-term donors at the Royal London Hospital after informed consent was obtained. Mononuclear cells were isolated by density centrifugation using Ficoll-Paque (GE Healthcare). Cells were depleted for lineage markers by using an EasySep Human Progenitor Cell Enrichment Kit (Stemcell Technologies) according to the manufacturer’s instructions. Lineage depleted cells were stained with antibodies listed in the supplemental Key Resources Table (available on the Blood Web site) and sorted by using a BD FACSAria Fusion (BD Biosciences).
In vitro culture conditions
Human CD34+CD38– cells were cultured in StemSpan SFEMII (Stemcell Technologies) supplemented with human stem cell factor (SCF; 150 ng/mL), human FLT3-ligand (FLT3-L; 150 ng/mL), and human thrombopoietin (TPO; 20 ng/mL; PeproTech) and when indicated GDNF/GFRα1 (100 ng/mL, GDNF & GFRα1 mixed 1:1; R&D Systems), SR1 (750 nM; Stemcell Technologies), UM171 (35nM; Stemcell Technologies), or PZ1 (10 nM; MilliporeSigma). Cells were incubated in a tissue culture incubator at 37°C, 5% carbon dioxide for 7 days. For all culture experiments, independent pools of UCB were used for treatments vs control.
Xenotransplantation assays
Primary or cultured CD34+CD38– HSPCs were IV injected in 8- to 10-week-old unconditioned female NBSGW mice. Injected mice were euthanized after 12 weeks, in both primary and secondary transplantations, by cervical dislocation, and 6 rear bones and spleen were collected. Bone marrow was flushed by centrifugation, spleens were crushed and passed through a 100 μM strainer, and resulting cells were incubated in red blood cell lysis buffer (155 mM NH4Cl, 12 mM NaHCO3, 0.1 mM EDTA) for 5 minutes at room temperature. The remaining cells were stained with antibodies listed in the Key Resources Table and sorted and analyzed by using a BD FACSAria Fusion. Secondary transplantations were conducted as per the primary transplantations using human CD45+ cells sorted from primary mice as donors. Additional details are given in the supplemental Methods.
Results
The receptor tyrosine kinase RET is more active in CD34+CD38– HSPCs than in CD34+CD38+ HPCs
In human UCB, the CD34+CD38– compartment (HSPCs) contains HSCs able to engraft long term in immunodeficient mouse models. In comparison, the CD34+CD38+ compartment (HPCs) contains more differentiated progenitor cells and has no long-term HSC function in immunodeficient mice. We used PamGene kinome array technology to identify kinase activity differences between the HSPC and HPC compartments (supplemental Figure 1A).
Cell extracts from HSPCs and HPCs phosphorylated a range of peptides (supplemental Figure 1B) and could be clearly separated by cell cycle phosphorylations (eg, RBpS807/S811) (supplemental Figure 1C) and classical hematopoietic signaling molecules (eg, AKT1pY326, PRKDCpS2624/S2626) (supplemental Figure 1D-E). Upstream kinase analysis of the phosphorylations by HSPC extracts provides a functional annotation, assigning phosphorylation kinetics to kinase activities. This process revealed enrichment for well-described kinases such as JAK1/2 and FLT1/3/4 in the HSPC compartment (Figure 1A).

RET is functionally active in CD34+CD38– HSPCs, and cell surface expression enriches for HSC function. (A) Kinase activity alterations between CD34+CD38– HSPCs (green) and CD34+CD38+ HPCs (lilac). (B) Process network enrichment for significantly altered kinases and phosphorylation events from panel A. (C) z-normalized geometric mean fluorescence intensity of cell surface RET within the indicated populations. Significance was tested by using a paired Student t test for individual cord blood donors tested (N = 9). (D) Plot depicting frequencies and confidence interval for REThi (red) and RETlow (blue) CD34+CD38– cell in vivo engraftment at limiting dilution after 12 weeks (N = 3 mice per dose tested). (E) Table of 1/stem cell frequency numerical data calculated from the in vivo limiting dilution analysis presented in panel D, including: estimated stem cell frequency, upper and lower intervals of estimation, χ2 test, and estimated P value.
RET is functionally active in CD34+CD38– HSPCs, and cell surface expression enriches for HSC function. (A) Kinase activity alterations between CD34+CD38– HSPCs (green) and CD34+CD38+ HPCs (lilac). (B) Process network enrichment for significantly altered kinases and phosphorylation events from panel A. (C) z-normalized geometric mean fluorescence intensity of cell surface RET within the indicated populations. Significance was tested by using a paired Student t test for individual cord blood donors tested (N = 9). (D) Plot depicting frequencies and confidence interval for REThi (red) and RETlow (blue) CD34+CD38– cell in vivo engraftment at limiting dilution after 12 weeks (N = 3 mice per dose tested). (E) Table of 1/stem cell frequency numerical data calculated from the in vivo limiting dilution analysis presented in panel D, including: estimated stem cell frequency, upper and lower intervals of estimation, χ2 test, and estimated P value.
Differential phosphorylation events (supplemental Figure 1A) and kinase activities (Figure 1A) between HSPCs and HPCs showed strong enrichment in anti-apoptosis signaling, both by PI3K/AKT (false discovery rate [FDR] = 3.74E-13; 18 proteins) and MAPK/JAK/STAT (FDR = 1.896E-11; 15 proteins), erythropoietin signaling (FDR = 1.167E-10; 13 proteins), and inflammatory pathways, including interleukin-2 signaling (FDR = 4.045E-07, 9 proteins), TREM1 signaling (FDR = 4.726E-07; 10 proteins), and interferon-γ signaling (FDR = 4.726E-07; 9 proteins) (Figure 1B).
Interestingly, the receptor tyrosine kinase RET was specifically enriched in the HSPC fraction, with a mean final score of 2.3 based on 17 peptide phosphorylations (Figure 1A). RET is a transmembrane receptor tyrosine kinase, with well-defined ligand/coreceptor interactions, and publicly available data sets indicate that within the HSPC compartment, the RET gene is expressed at significantly higher levels in HSCs than more differentiated progenitor cells (supplemental Figure 1F). RET signaling, at the cell surface, shows a diverse array of responses in different cell types, and considering the well-defined ligand/coreceptor activation interaction,13 evidence of GFL support from the niche,14 and bioavailable stimulating factors in vitro,15 it provided an excellent candidate for further investigation.
RET cell surface expression functionally enriches for stem cell activity in the HSPC compartment
The RET protein must be at the cell surface for ligand/coreceptor-dependent transduction of signals across the membrane.16 When probing for RET at the cell surface, immunophenotypic HSCs (CD34+CD38–CD45RA–CD90+CD49f+) typically exhibit higher RET cell surface expression than multipotent progenitors (CD34+CD38–CD45RA–CD90–CD49f–, gating as per Notta et al17 ) (Figure 1C; supplemental Figure 1G-J). Multiple markers have been proposed to further purify HSCs within the CD34+CD38– compartment, and we sought to investigate the stem/progenitor cell frequency of cells expressing RET at the cell surface after 12 weeks in vivo. Selection of CD34+CD38– cells solely classified for cell surface expression of RET enriches for HSPC stem cell activity in an in vivo limiting dilution assay, with high RET HSPCs (REThi) showing a stem cell frequency of ∼1 in 135 cells and RETlow HSPCs showing an almost fourfold reduction in stem cell frequency of ∼1 in 531 cells (P = .026) (Figure 1D-E; supplemental Figure 2A). In addition, REThi HSPCs exhibit much more classical lineage balance in immunodeficient mice, whereas RETlow HSPCs are more myeloid biased (supplemental Figure 2B).
Activation of RET by GDNF/GFRα1 improves survival and expansion of HSPCs
A key question in hematopoietic stem cell biology remains how to grow HSCs in vitro for both engineering and expansion purposes.18 Currently, CD34+CD38– HSPCs can be grown in culture for 7 days with a minimal cocktail of cytokines, including SCF, FLT3-L, and TPO, retaining enough functional HSCs to engraft immunodeficient mice.19 To understand the role of RET at the surface of HSPCs and whether this could be a target for HSC maintenance and expansion, we added its primary ligand/coreceptor combination, GDNF/GFRα1, to the culture medium in addition to SCF/FLT3-L/TPO and cultured 5000 HSPCs for 7 days (Figure 2A). HSPCs expand up to 40-fold in minimal serum-free, SCF/FLT3-L/TPO–supplemented conditions over 7 days. The addition of GDNF/GFRα1 significantly increased the number of HSPCs by 71-fold at day 7 compared with input cells (Figure 2B).
![GDNF/GFRα1 treatment stimulates growth of transplantable HSCs. (A) Experimental design for GDNF/GFRα1–supplemented outgrowth of HSCs and transplantation ability. 1°TP and 2°TP represent the first and second transplantation, respectively. (B) Live cell count of in vitro cultured HSPCs (N = 5). Proportion of expanded HSCs (CD34+CD90+EPCR+) at day 3 (C) and day 7 (D) during in vitro culture (N = 5). (E) Percentage of human CD45+ (hCD45+) cells of total CD45+ bone marrow cells in primary transplantation mice (control [Ctrl], N = 12; GDNF/GFRα1, N = 10; SR1/UM171, N = 7; SR1/UM171/GDNF/GFRα1, N = 6). (F) Percentage of immunophenotypic HSCs (CD34+CD38–CD45RA–CD90+CD49f+) retained in hCD45 bone marrow cells in primary transplantation mice. (G) Percentage of hCD45+ cells of total CD45+ bone marrow cells in secondary transplantation mice (2 × 10⁵ hCD45 cells transplanted shown, N = 5 for all conditions). (H) Boxplot indicating 1/stem cell frequency of secondary transplanted hCD45+ cells. Estimates with upper and lower intervals are shown (N = 5 for top dose, N = 3 for all other doses). For all graphs, a Student t test was used to calculated significant differences. *P < .05 vs Ctrl; **P < .005 vs Ctrl; ***P < .0005 vs Ctrl; ****P < .00005 vs Ctrl.](https://ash.silverchair-cdn.com/ash/content_public/journal/blood/136/22/10.1182_blood.2020006302/1/m_bloodbld2020006302f2.png?Expires=1769107318&Signature=CS8ZlehA4GhEQD10hKqdSqrHZt45wisekro~IAQcZToR4lcpZcy797cyUAkgDE3n3tI0SPjcc4pBm1izECvJLmo4rxNHWkYwf-EBTVBuXOXHWu14HTco4jyORH0RWo9LYW1w6TYNpeGyiGncl0g5owVeFbCkcGHKSJTwERj52CD0kWai5MqNCdLSWBQ3bqmwzToOui5F34Ug9BZUs6BUiZJAoktYLyJ0GRBClq~2JlkJEBej8N5gmT-06GiazuKxjEem8OhGiI5JrQhtBDFPaRdCw6s0s8tzQnaBaXr8LIZAptH5WRbxXWcW2tEK0JD5qWX2NxScR9S1JPr-ao0VVg__&Key-Pair-Id=APKAIE5G5CRDK6RD3PGA)
GDNF/GFRα1 treatment stimulates growth of transplantable HSCs. (A) Experimental design for GDNF/GFRα1–supplemented outgrowth of HSCs and transplantation ability. 1°TP and 2°TP represent the first and second transplantation, respectively. (B) Live cell count of in vitro cultured HSPCs (N = 5). Proportion of expanded HSCs (CD34+CD90+EPCR+) at day 3 (C) and day 7 (D) during in vitro culture (N = 5). (E) Percentage of human CD45+ (hCD45+) cells of total CD45+ bone marrow cells in primary transplantation mice (control [Ctrl], N = 12; GDNF/GFRα1, N = 10; SR1/UM171, N = 7; SR1/UM171/GDNF/GFRα1, N = 6). (F) Percentage of immunophenotypic HSCs (CD34+CD38–CD45RA–CD90+CD49f+) retained in hCD45 bone marrow cells in primary transplantation mice. (G) Percentage of hCD45+ cells of total CD45+ bone marrow cells in secondary transplantation mice (2 × 10⁵ hCD45 cells transplanted shown, N = 5 for all conditions). (H) Boxplot indicating 1/stem cell frequency of secondary transplanted hCD45+ cells. Estimates with upper and lower intervals are shown (N = 5 for top dose, N = 3 for all other doses). For all graphs, a Student t test was used to calculated significant differences. *P < .05 vs Ctrl; **P < .005 vs Ctrl; ***P < .0005 vs Ctrl; ****P < .00005 vs Ctrl.
GDNF/GFRα1 treatment stimulates growth of transplantable HSCs. (A) Experimental design for GDNF/GFRα1–supplemented outgrowth of HSCs and transplantation ability. 1°TP and 2°TP represent the first and second transplantation, respectively. (B) Live cell count of in vitro cultured HSPCs (N = 5). Proportion of expanded HSCs (CD34+CD90+EPCR+) at day 3 (C) and day 7 (D) during in vitro culture (N = 5). (E) Percentage of human CD45+ (hCD45+) cells of total CD45+ bone marrow cells in primary transplantation mice (control [Ctrl], N = 12; GDNF/GFRα1, N = 10; SR1/UM171, N = 7; SR1/UM171/GDNF/GFRα1, N = 6). (F) Percentage of immunophenotypic HSCs (CD34+CD38–CD45RA–CD90+CD49f+) retained in hCD45 bone marrow cells in primary transplantation mice. (G) Percentage of hCD45+ cells of total CD45+ bone marrow cells in secondary transplantation mice (2 × 10⁵ hCD45 cells transplanted shown, N = 5 for all conditions). (H) Boxplot indicating 1/stem cell frequency of secondary transplanted hCD45+ cells. Estimates with upper and lower intervals are shown (N = 5 for top dose, N = 3 for all other doses). For all graphs, a Student t test was used to calculated significant differences. *P < .05 vs Ctrl; **P < .005 vs Ctrl; ***P < .0005 vs Ctrl; ****P < .00005 vs Ctrl.
It has previously been reported that endothelial protein C receptor (EPCR) expression marks expanded CD34+ cord blood stem cells in culture,20 and we used this marker in combination with CD90 to estimate the number of expanded HSCs in control and GDNF/GFRα1–treated conditions. The frequency of immunophenotypic HSCs within the cultures (CD34+CD90+EPCR+) was significantly enriched by GDNF/GFRα1 treatment at both day 3 (Figure 2C) and day 7 (Figure 2D; supplemental Figure 3A-C).
GDNF/GFRα1–cultured HSPCs have improved long-term in vivo engraftment
The gold standard for human HSC functionality under laboratory conditions is engraftment in immunodeficient mouse models to reveal stem/progenitor (primary engraftment for 12 weeks) and long-term self-renewing HSC (secondary engraftment for 12 weeks) function. The observed increase in cell numbers in the GDNF/GFRα1 cultures at day 7 may correlate with outgrowth of functional stem cells in this system, or may be due to another factor such as increased progenitor cell proliferation.21 To test the stem cell potency of cultured HSPCs in the presence of GDNF/GFRα1, we retrieved all cells from culture replicates at day 7 and transplanted them into immunodeficient mice harboring the cKitW41 mutation (1 well:1 mouse; NBSGW). Bone marrow and splenic engraftment was significantly higher after GDNF/GFRα1 treatment compared with control. The enhanced engraftment resulting from RET activation was comparable to the previously published combination of SR1/UM171, and the combination of SR1/UM171/GDNF/GFRα1 further improved engraftment (Figure 2E; supplemental Figure 3D-F). These data indicate that activation of RET can improve progenitor activity for colonizing primary recipients as a single addition to classical SCF/FTL3-L/TPO cytokines, similar to that of SR1/UM171. Analysis of the immunophenotypic HSC compartment within the human CD45+ cells from the bone marrow of primary recipient mice revealed a significant enrichment in all treatment cases (GDNF/GFRα1, SR1/UM171, and SR1/UM171/GDNF/GFRα1) compared with controls (Figure 2F). Together, these data indicate improved expansion of stem/progenitor cells treated with GDNF/GFRα1 and expansion in vivo of phenotypic long-term HSCs.
To test the long-term self-renewal HSC function and frequency of GDNF/GFRα1–treated cells, human CD45+ cells obtained from the bone marrow of primary mice were engrafted into secondary recipients in a limiting dilution fashion. Primary cells from GDNF/GFRα1, SR1/UM171, and SR1/UM171/GDNF/GFRα1 treatments engrafted secondary mice significantly better than controls at the highest dose tested (2 × 10⁵ human CD45+ injected) (Figure 2G; supplemental Figure 3G-I). The estimation of stem cell frequency according to extreme limiting dilution analysis indicated that control cells have very low long-term stem cell frequency (∼1 in 1 500 000). GDNF/GFRα1 treatment significantly improved long-term stem cell frequency by >75-fold (∼1 in 20 000). This was also improved in the SR1/UM171–treated cells (∼1 in 41 000), and the combination of SR1/UM171/GDNF/GFRα1 treatment was similar to GDNF/GFRα1 treatment alone with a moderate improvement (∼1 in 13 000) (Figure 2H; supplemental Figure 3H-J), indicating that GDNF/GFRα1 provides significant improvement in long-term HSC production. Considering initial cell expansion, total engraftment in primary mice, percentage of total bone marrow represented by rear leg long bones (∼20%), and long-term stem cell frequency in secondary recipients, GDNF/GFRα1 treatment increases HSC outgrowth over the experimental course compared with control conditions by ∼148-fold (∼742 vs ∼5 stem cells produced, respectively), compared with SR1/UM171 by ∼1.3-fold (∼565 stem cells produced), and was further improved by the triple combination (∼1275 stem cells produced) (supplemental Figure 3K).
RET activation induces a dynamic change in the kinome of HSPCs
To understand the specific changes governed by RET activation in HSPCs, we investigated functional changes in the kinome after GDNF/GFRα1 treatment using PamGene kinase profiling. Functional changes in both serine/threonine (Figure 3A) and tyrosine (Figure 3B) kinases in HSPCs were compared at days 0, 1, and 3 after GDNF/GFRα1 treatment. Because GDNF/GFRα1 is rapidly used and turned over in vitro, day 1 changes represent the acute early events, and day 3 changes represent longer reaching modifications in the kinome of treated HSPCs.
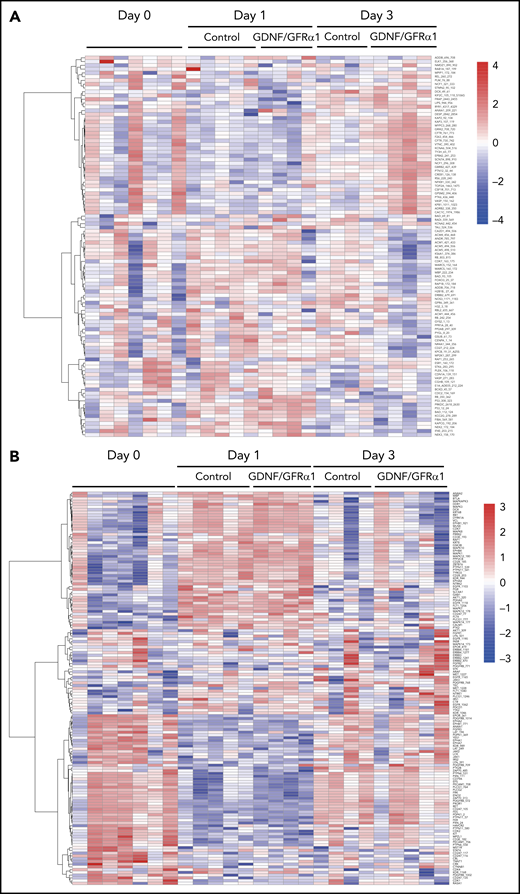

Activation of RET by GDNF/GFRα1 alters kinome dynamics during HSPC outgrowth. Heatmaps depicting serine/threonine (A) and tyrosine (B) containing row z-normalized peptide phosphorylations supervised by day and treatment. Rows are clustered by correlation. (C) Fold change differential phosphorylation of GDNF/GFRα1–treated CD34+CD38– cells compared with control after 1 day of culture. (D) Upstream kinases calculated as responsible for phosphorylations in panel C. (E) Fold change differential phosphorylation of GDNF/GFRα1–treated CD34+CD38– cells compared with control after 3 days of culture. (F) Upstream kinases calculated as responsible for phosphorylations in panel G. Red dots in panels C-F indicate significantly upregulated peptides or kinases; blue dots represent significantly downregulated peptides or kinases in response to GDNF/GFRα1 treatment.
Activation of RET by GDNF/GFRα1 alters kinome dynamics during HSPC outgrowth. Heatmaps depicting serine/threonine (A) and tyrosine (B) containing row z-normalized peptide phosphorylations supervised by day and treatment. Rows are clustered by correlation. (C) Fold change differential phosphorylation of GDNF/GFRα1–treated CD34+CD38– cells compared with control after 1 day of culture. (D) Upstream kinases calculated as responsible for phosphorylations in panel C. (E) Fold change differential phosphorylation of GDNF/GFRα1–treated CD34+CD38– cells compared with control after 3 days of culture. (F) Upstream kinases calculated as responsible for phosphorylations in panel G. Red dots in panels C-F indicate significantly upregulated peptides or kinases; blue dots represent significantly downregulated peptides or kinases in response to GDNF/GFRα1 treatment.
At the early time point after GDNF/GFRα1 treatment (day 1), significant phosphorylations on chip (Figure 3C) were predominantly representative of tyrosine kinase activity (Figure 3D; supplemental Figure 4A). At the late time point after GDNF/GFRα1 treatment (day 3), significant phosphorylations on chip (Figure 3E) were predominantly representative of serine/threonine kinase activity (Figure 3F; supplemental Figure 4B).
The early changes at day 1 were enriched in process networks for antiapoptotic PI3K/AKT signaling (P = 1.8e-7), anti-inflammatory interleukin-2 signaling (P = 1.9e-6), anti-apoptotic MAPK/JAK/STAT signaling (P = 5.3e-5), and Notch signaling (P = 1.4e-4) (Figure 4A). At day 3, changes were enriched for the same process networks seen at day 1, indicating that fundamental pathways are sustained beyond the immediate GDNF/GFRα1 downstream signaling, converging on anti-apoptosis and anti-inflammation.
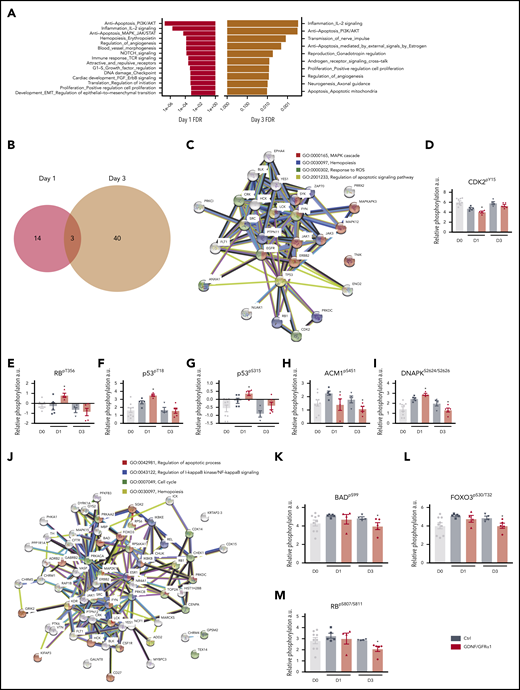
GDNF/GFRα1 treatment induces anti-apoptotic and anti-inflammatory processes in cultured HSPCs. (A) Enriched process networks from significantly changed peptides in GDNF/GFRα1 vs control (Ctrl) cultures after 1 day (left, red) or 3 days (right, mustard). (B) Venn diagram depicting overlap of significantly altered peptides between day 1 (red) and day 3 (mustard) from GDNF/GFRα1 vs Ctrl cultures. (C) String protein network for differential phosphorylation events at day 1. Lines indicate reported interactions. (D-I) Key differential phosphorylations induced by GDNF/GFRα1 treatment at day 1, represented as relative phosphorylation. A Student t test was used to measure significant differences. Day 0 CD34+CD38– input cells (gray), Ctrl (steel blue), and GDNF/GFRα1 (red) treatments at days 1 and 3 are presented. (J) String protein network for differential phosphorylation events at day 3. Lines indicate reported interactions. (K-M) Key differential phosphorylations induced by GDNF/GFRα1 treatment at day 3, represented as relative phosphorylation. For all graphs, a Student t test was used to calculate significant differences. *P < .05 vs Ctrl. Day 0 CD34+CD38− input cells (gray), Ctrl (steel blue), and GDNF/GFRα1 (red) treatments at days 1 and 3 are presented.
GDNF/GFRα1 treatment induces anti-apoptotic and anti-inflammatory processes in cultured HSPCs. (A) Enriched process networks from significantly changed peptides in GDNF/GFRα1 vs control (Ctrl) cultures after 1 day (left, red) or 3 days (right, mustard). (B) Venn diagram depicting overlap of significantly altered peptides between day 1 (red) and day 3 (mustard) from GDNF/GFRα1 vs Ctrl cultures. (C) String protein network for differential phosphorylation events at day 1. Lines indicate reported interactions. (D-I) Key differential phosphorylations induced by GDNF/GFRα1 treatment at day 1, represented as relative phosphorylation. A Student t test was used to measure significant differences. Day 0 CD34+CD38– input cells (gray), Ctrl (steel blue), and GDNF/GFRα1 (red) treatments at days 1 and 3 are presented. (J) String protein network for differential phosphorylation events at day 3. Lines indicate reported interactions. (K-M) Key differential phosphorylations induced by GDNF/GFRα1 treatment at day 3, represented as relative phosphorylation. For all graphs, a Student t test was used to calculate significant differences. *P < .05 vs Ctrl. Day 0 CD34+CD38− input cells (gray), Ctrl (steel blue), and GDNF/GFRα1 (red) treatments at days 1 and 3 are presented.
Differential phosphorylation events exclusively at the early time point (day 1) (Figure 4B-C) include cell cycle components CDK2pY15 and RBpT356 (indicative of an exit from mitosis and progression through the G1/S boundary) (Figure 4D-E), interleukin signaling components (eg, JAK3pY980/981) (supplemental Figure 5B), and the p53 anti-apoptotic phosphorylations at p53pT18 and p53pS315 (Figure 4F-G). These and other phosphorylation events (Figure 4H-I) indicate that cells treated with GDNF/GFRα1 at early time points are more positively cycling, have an earlier anti-inflammatory response, and exhibit increased anti-apoptotic activity.
In normoxic cultures, anti-inflammatory and anti-apoptotic signaling are important for HSC maintenance, expansion, and survival; phosphorylation networks in day 3 GDNF/GFRα1–treated cells represent a convergence on these key pathways (Figure 4J). For example, the phosphorylation of BADpS99, which is hyperphosphorylated when cells are under stress and are resisting apoptosis,22 is reduced under GDNF/GFRα1 treatment (Figure 4K). Upstream, FOXO3, the transcription factor responsible for expression of another pro-apoptotic factor, BIM, also exhibits reduced phosphorylation at S30/T32 in GDNF/GFRα1–treated cells, indicating there is a block in expression of pro-apoptotic genes such as BIM (Figure 4L). In addition, RB phosphorylation switches, and there is a significant reduction in RBpS807/811, resulting in less potential for BAX binding and further indication that anti-apoptotic functions are no longer required (Figure 4M). This switch in phosphorylation events between early and late time points coincides with the emergence of kinase activity by IKK complex members (IKKα, IKKβ, and IKK; Figure 3F; supplemental Figure 4B), a pathway known to be downstream of RET-induced AKT/ERK activity.23 These pathways indicate that a mechanism of protection by GDNF/GFRα1 treatment at later time points is due to protection against apoptosis through RET-induced AKT/ERK activity and downstream via NF-κB signaling.
We next sought to understand how GDNF/GFRα1 treatment mitigates changes from input cells over time compared with controls. Although there is clear concordance between phosphorylation changes from input cells to day 1 controls and GDNF/GFRα1 treatment (R = 0.56; P < 2.2e-16) (supplemental Figure 4C), and from input cells to day 3 controls and GDNF/GFRα1 treatment (R = 0.75; P < 2.2e-16) (supplemental Figure 4D), there are key peptide changes seen exclusively in control cells or in GDNF/GFRα1–treated cells at each time point (supplemental Figure 4E). The most highly changed phosphorylation site in day 1 control cultures compared with input cells is DSPpS2849, which remains unchanged throughout all other conditions (supplemental Figure 5A). The DSPpS2849 phospho-site is dependent on GSK3β and PKACA activity, which are important kinases involved in normal and malignant hematopoiesis, and phosphorylation at this site reduces desmoplakin-mediated adhesion to extracellular matrices.24 At day 3, control cells uniquely lack ADDBpS697/S701, phospho-sites associated with induction of cell growth, notably a site that is better maintained throughout by GDNF/GFRα1 supplementation (supplemental Figure 5D).
Conversely, at day 1 culture with GDNF/GFRα1, the p53pS315 phospho-site is significantly increased (Figure 4G), a site known to be phosphorylated by CDK1 and important for anti-apoptotic functions. In addition to improved survival phosphorylation events at day 1, GDNF/GFRα1–treated cultures by day 3 also display major reductions compared with controls in phosphorylation of IF4EpS209/T210 (supplemental Figure 5E) and RBpS807/S811, indicative of cell cycle alterations and anti-apoptotic functions (Figure 4M).
These profiles indicate that overlapping and independent phosphorylation changes between control and GDNF/GFRα1–treated cultures lead to diverse pathway activation. These signaling alterations are likely to be responsible for the differences in functional output of HSPCs.
GDNF/GFRα1 treatment sustains an integrated cell survival and proliferation program in cultured HSPCs
Despite the wide-scale dynamic changes in the kinome, key regulatory phosphorylation cascades surrounding an NF-κB/p53/BCL2 cell survival and proliferation program were consistently affected at early and late time points.
We sought to use mass cytometry to investigate the dynamics of these phosphorylation steps and protein abundance in CD34+ cells after initial isolation, at early (day 3) and late (day 7) expansion time points (Figure 5A-B). RET is hyperphosphorylated after GDNF/GFRα1 treatment at day 3 compared with controls and is reduced over time as GDNF/GFRα1 depletion occurs. In contrast, total RET abundance increased early and continued to increase at day 7.

RET activation by GDNF/GFRα1 sustains an NF-κB/p53/BCL2 anti-apoptotic program in HSPCs during in vitro culture. (A) Bar graphs depict median intensity of signal from histograms below showing the profiles of key protein changes in CD34+ cells at day 0 (blue), day 3 control (Ctrl; orange), day 3 GDNF/GFRα1 (green), day 7 Ctrl (red), and day 7 GDNF/GFRα1 (purple; a.u., arbitrary units). (B) z-normalized heatmap of data in panel A, illustrating differences in CD34+CD38– cells at input, and CD34+ cells at day 3 and day 7 culture with or without GDNF/GFRα1 treatment assayed by mass cytometry, supervised by treatment condition. (C) Fold change RNA expression of key NF-κB target genes in GDNF/GFRα1–treated CD34+CD38– cells compared with Ctrls at days 1, 3, and 7. Gene names are noted under bar labels. A Student t test was used to calculate significant differences. (D) Fold change RNA expression of key genes altered at the protein level in GDNF/GFRα1–treated CD34+CD38– cells compared with Ctrls at days 1, 3, and 7. Gene names are noted under bar labels. A Student t test was used to calculate significant differences. (E) Illustrated pathway identified through kinome, mass cytometry, and RNA changes, defining activating (green) and inhibiting (red) phosphorylations, protein levels or RNA levels, and proposed modes of action. For panels C-D, *P < .05, **P < .005; N = 3 per condition and day tested.
RET activation by GDNF/GFRα1 sustains an NF-κB/p53/BCL2 anti-apoptotic program in HSPCs during in vitro culture. (A) Bar graphs depict median intensity of signal from histograms below showing the profiles of key protein changes in CD34+ cells at day 0 (blue), day 3 control (Ctrl; orange), day 3 GDNF/GFRα1 (green), day 7 Ctrl (red), and day 7 GDNF/GFRα1 (purple; a.u., arbitrary units). (B) z-normalized heatmap of data in panel A, illustrating differences in CD34+CD38– cells at input, and CD34+ cells at day 3 and day 7 culture with or without GDNF/GFRα1 treatment assayed by mass cytometry, supervised by treatment condition. (C) Fold change RNA expression of key NF-κB target genes in GDNF/GFRα1–treated CD34+CD38– cells compared with Ctrls at days 1, 3, and 7. Gene names are noted under bar labels. A Student t test was used to calculate significant differences. (D) Fold change RNA expression of key genes altered at the protein level in GDNF/GFRα1–treated CD34+CD38– cells compared with Ctrls at days 1, 3, and 7. Gene names are noted under bar labels. A Student t test was used to calculate significant differences. (E) Illustrated pathway identified through kinome, mass cytometry, and RNA changes, defining activating (green) and inhibiting (red) phosphorylations, protein levels or RNA levels, and proposed modes of action. For panels C-D, *P < .05, **P < .005; N = 3 per condition and day tested.
Many of the key factors identified throughout our kinome analysis are downstream of RET, mediated by 1 of 2 key signaling cascade partners, AKT and ERK. Interestingly, both AKTpS473 and ERK1/2pT202/Y204 mirror RET phosphorylation and are activated early. ERK phosphorylation was sustained over time, whereas AKT increased further at day 7 (Figure 5A-B).
Downstream of AKT/ERK activity, we observed increased p53pS392, which induces interaction with NF-κB; increased NF-κB transcriptional activity was also observed (Figure 5A-C; supplemental Figure 6A-B). This NF-κB/p53 axis is an important regulator of the cell survival and growth characteristics we observed in the in vitro cultures.
When assessing the downstream genetic targets of these key proteins, we observed significant downregulation of the FOXO3, pro-apoptotic target BIM, and significant upregulation of the anti-apoptotic NF-κB target genes BCL2 and TP53; there were no consistent changes, however, in the NF-κB pro-inflammatory target genes TNF-α and IL1-β (Figure 5C; supplemental Figure 6A-B). To further confirm that the observed changes are caused acutely by phosphorylation cascades downstream of GDNF/GFRα1 treatment, and not secondary to transcriptomic adaptions, we monitored RNA levels of key components of this pathway, altered at the protein level, including FOXO3A, RELA, ELK1, and IKBKB (Figure 5D). Indeed, FOXO3A, ELK1, and IKBKB remain similar to controls until the late time point (day 7), at which FOXO3A and IKBKB are upregulated (ELK1 remained constant throughout), presumably as feedback in response to their inactivity at the protein level. In contrast, RELA is initially downregulated early (day 1) and increases over time. Therefore, activation of RET-induced changes at the protein phosphorylation and total abundance levels are the predominant effectors of the response observed, with input from transcriptional changes contributing a smaller part of the downstream effectors mediating the phenotypic response.
These data provide a 2-pronged mechanism by which RET activation induces the activity of AKT and ERK as key signaling hubs to drive a cell survival and proliferation program in HSPCs in vitro. The NF-κB/p53/BCL2 axis provides a stable platform for HSPCs to survive and expand in culture before transplantation in vivo (Figure 5E).
HSCs have a specific response mechanism to GDNF/GFRα1 in culture
Protein changes responsive to GDNF/GFRα1 treatment, monitored in CD34+ cells during culture, were consistent within the immunophenotypic HSC compartment of cultured cells (CD34+CD38–CD45RA–CD90+) but less responsive in the multipotent progenitor compartment (CD34+CD38–CD45RA–CD90–), indicating a specific response mechanism in HSCs (supplemental Figure 7A-B). In addition, at day 0, HSCs have higher total RET than multipotent progenitors (but not bulk CD34+CD38–), and HSCs show the strongest RETpY905 signal of all compartments (data not shown), indicating that RET signaling is already primed in HSCs preculture.
Compared with control cultures, HSCs exhibit a strong response at day 3 to GDNF/GFRα1 by increases in RETpY905, AKTpS473, and ERK1/2pT202/Y204 (Figure 6A-B). In addition, NFκBpS529 and p53pS392 are upregulated at day 3 by GDNF/GFRα1 treatment, indicating that the cell survival and oxidative stress response network discovered in bulk HSPCs (Figure 5A-B) is similarly stimulated in HSCs. Interestingly, GDNF/GFRα1 treatment also suppresses the abundance of the differentiation pioneer factor, PU.1, at later stages (day 7) while inducing GATA1 expression at early stages (day 3). The changes induced at day 3 by GDNF/GFRα1 are generally spikes in signaling, lost upon the exhaustion of ligand/coreceptor. Only 4 proteins remain more abundant in GDNF/GFRa1–treated culture (STAT5pY694, ERK1/2pT202/Y204, S6pS235/S236, cREL, and Ki67), indicating that the spike in activity early is enough to induce a survival and expansion program in HSCs in culture (Figure 6A-B; supplemental Figure 7A-B).
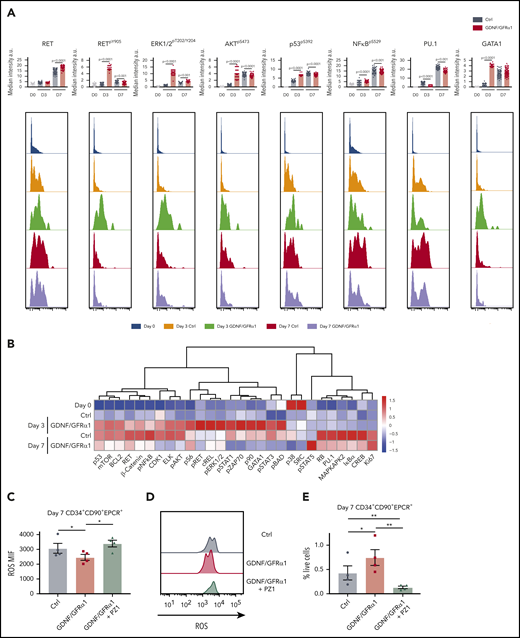
HSCs exhibit specific responses to GDNF/GFRα1 resulting in reduced accumulation of intracellular ROS. (A) Bar graphs depict median intensity of signal from histograms below illustrating profiles of key protein changes in HSCs at day 0 (blue), day 3 control (Ctrl; orange), day 3 GDNF/GFRα1 (green), day 7 Ctrl (red), and day 7 GDNF/GFRα1 (purple, a.u. = arbitrary units). (B) z-normalized heatmap illustrating differences in HSC clusters at input, and day 3 and day 7 culture with or without GDNF/GFRα1 treatment assayed by mass cytometry, supervised by treatment condition. (C) Mean fluorescence intensity of intracellular ROS in HSCs at day 7 ± GDNF/GFRα1/PZ1. (D) Histograms illustrating changes in intracellular ROS at day 7. (E) Percentage of HSCs in cultured cells at day 7 ± GDNF/GFRα1/PZ1. For panels C-E, *P < .05, N = 4.
HSCs exhibit specific responses to GDNF/GFRα1 resulting in reduced accumulation of intracellular ROS. (A) Bar graphs depict median intensity of signal from histograms below illustrating profiles of key protein changes in HSCs at day 0 (blue), day 3 control (Ctrl; orange), day 3 GDNF/GFRα1 (green), day 7 Ctrl (red), and day 7 GDNF/GFRα1 (purple, a.u. = arbitrary units). (B) z-normalized heatmap illustrating differences in HSC clusters at input, and day 3 and day 7 culture with or without GDNF/GFRα1 treatment assayed by mass cytometry, supervised by treatment condition. (C) Mean fluorescence intensity of intracellular ROS in HSCs at day 7 ± GDNF/GFRα1/PZ1. (D) Histograms illustrating changes in intracellular ROS at day 7. (E) Percentage of HSCs in cultured cells at day 7 ± GDNF/GFRα1/PZ1. For panels C-E, *P < .05, N = 4.
In agreement with our earlier findings of anti-apoptotic and anti-inflammatory signatures (Figure 4A), HSCs exhibit a specific spike in p53pS392 at day 3 but no upregulation of NFkBpS529 (Figure 6A-B). In vitro, this action leads to a reduction in intracellular reactive oxygen species (ROS) for both bulk CD34+ cells and specifically HSCs (Figure 6C-D; supplemental Figure 8C-D). When inhibiting RET signaling, with the pan-RET/VEGFR2 inhibitor PZ1 (supplemental Figure 8A), the reduction in intracellular ROS is abolished, and the number of CD34+ cells, and more importantly HSCs, in culture is lost (Figure 6E; supplemental Figure 8E), with CD34+ cells showing a significant increase in apoptosis in response to PZ1 at day 7 (supplemental Figure 8B). Together, these data indicate that the tailored response in HSCs is critically dependent on RET signaling maintaining fundamental stress response pathways during in vitro outgrowth.
Discussion
The use of UCB for HSC transplantation is a rapidly increasing treatment option for both hematologic and nonhematologic malignancies, as well as new gene therapy and regenerative medicine approaches. The current outcomes from cord blood transplantation are limited primarily by low stem cell dose and delayed hematopoietic recovery.4 Early strategies to grow HSCs in vitro induce a large amount of differentiation in culture,19 but recent improvements in expansion of HSCs, such as those conferred by SR1, UM171,25,26 and GDNF/GFRα1 in the current study, in vitro, provide a positive platform for improvement of UCB-derived HSCs in vivo.
Our finding of higher RET activity in HSPCs derived from UCB may be due to cell-intrinsic mechanisms/autocrine signaling loops or from specific niche components. Indeed, there is evidence of enervation of the HSC bone marrow niche, and recent high-dimensional analysis of niche components reveals expression of GFLs from COL2.3+ osteoblasts.14 Therefore, the provision of GDNF/GFRα1 may be a key component, already provided by the bone marrow niche, for HSCs to maintain their potential in vitro. Regardless of the source of activation, the increased phosphorylation of RET in phenotypic HSCs from UCB indicates an active RET signaling pathway in vivo, specifically tailored to HSCs.
We provide a mechanism by which RET can govern an anti-apoptotic and anti-inflammatory program, due to diverging and exclusive contributions to the same goal, to improve survival and expansion of HSCs for regenerative and engineering purposes. A key issue when expanding HSCs in vitro is the need to grow them in normoxic conditions for maximum expansion. The induction of oxidative stress under these conditions can lead to a loss in stem cell activity.27,28 The stimulation of RET signaling can reduce the accumulation of ROS in HSCs and maintain their potency, while providing further signals to expand in vitro. Interestingly, the basic complement of cytokines used to grow HSPCs in culture (SCF/FLT3-L/TPO) is known to activate ERK/AKT signaling.29 Our findings that this action is strongly enhanced by the activation of RET indicates that there is capacity to increase these signaling cascades (strength and time of response) and to improve the diversity of the response (in our case, the IκBα arm) (Figure 5E), ultimately leading to improvement in HSC function over the experimental course. The addition of UM171 to SCF/FLT3-L/TPO when culturing HSPCs has also been shown to retune NF-κB proinflammatory and anti-inflammatory activities, through EPCR, ultimately reducing the ROS burden in HSCs in vitro.30 Although it is unknown what the direct target of UM171 is, it is possible that association with EPCR function may activate AKT/ERK signaling and even stimulate RET activity to some extent. However, the reduction of estimated stem cells produced by SR1/UM171 compared with GDNF/GFRα1 (supplemental Figure 3H) indicates that classical stimulation of RET activity (by GFLs) has a stronger effect than UM171 if this is the case.
In addition to potential improvements in patient outcome, improved outgrowth of UCB-derived HSCs can begin to address the issue of double cord blood transplantation and associated costs, increasing the practicality of using UCB banks in frontline treatment.4 These benefits could potentially provide an immediate improvement in clinical outcomes. In addition, with the rapidly increasing promise of gene therapy, improvements in survival during expansion may provide a critical edge to genetic engineering protocols for future therapies.
Contact the corresponding author for original data.
The online version of this article contains a data supplement.
The publication costs of this article were defrayed in part by page charge payment. Therefore, and solely to indicate this fact, this article is hereby marked “advertisement” in accordance with 18 USC section 1734.
Acknowledgments
The authors acknowledge the Francis Crick Core Flow Cytometry and Biological Research Scientific Technology Platforms. The authors also thank Constandina Pospori for critical feedback on the manuscript.
D.B. acknowledges that this work was supported by the Francis Crick Institute, which receives its core funding from Cancer Research UK (FC0010455), the UK Medical Research Council (FC0010455), and the Wellcome Trust (FC0010455); N.Q.M. research was also partly funded by the Francis Crick (FC001115); and N.Q.M and R.C were also supported by the National Cancer Institute, National Institutes of Health (1R01CA197178-01A1R).
Authorship
Contribution: W.G. designed and conducted experiments, analyzed the data, and wrote the manuscript; R.C., M.P., H.H.E., and M.G.-A. conducted experiments; N.Q.M. supervised the project; and D.B. supervised the project and wrote the manuscript. All authors provided critical feedback on the manuscript.
Conflict-of-interest disclosure: The authors declare no competing financial interests.
Correspondence: D. Bonnet, The Francis Crick Institute, 1 Midland Rd, NW1 1AT, London, United Kingdom; e-mail: dominique.bonnet@crick.ac.uk.
