

Key Points
Higher OS than CS activity for AAV5-FVIII-SQ may be caused by accelerated early FXa formation, resulting in a kinetic bias between assays.
Specific activity (IU/mg) remains comparable between transgene-produced and recombinant FVIII-SQ in the CS assay, but not in the OS assay.

Abstract
Adeno-associated virus (AAV)-based gene therapies can restore endogenous factor VIII (FVIII) expression in hemophilia A (HA). AAV vectors typically use a B-domain–deleted FVIII transgene, such as human FVIII-SQ in valoctocogene roxaparvovec (AAV5-FVIII-SQ). Surprisingly, the activity of transgene-produced FVIII-SQ was between 1.3 and 2.0 times higher in one-stage clot (OS) assays than in chromogenic-substrate (CS) assays, whereas recombinant FVIII-SQ products had lower OS than CS activity. Transgene-produced and recombinant FVIII-SQ showed comparable specific activity (international units per milligram) in the CS assay, demonstrating that the diverging activities arise in the OS assay. Higher OS activity for transgene-produced FVIII-SQ was observed across various assay kits and clinical laboratories, suggesting that intrinsic molecular features are potential root causes. Further experiments in 2 participants showed that transgene-produced FVIII-SQ accelerated early factor Xa and thrombin formation, which may explain the higher OS activity based on a kinetic bias between OS and CS assay readout times. Despite the faster onset of coagulation, global thrombin levels were unaffected. A correlation with joint bleeds suggested that both OS and CS assay remained clinically meaningful to distinguish hemophilic from nonhemophilic FVIII activity levels. During clinical development, the CS activity was chosen as a surrogate end point to conservatively assess hemostatic efficacy and enable comparison with recombinant FVIII-SQ products. Relevant trials are registered on clinicaltrials.gov as #NCT02576795 and #NCT03370913 and, respectively, on EudraCT (European Union Drug Regulating Authorities Clinical Trials Database; https://eudract.ema.europa.eu) as #2014-003880-38 and #2017-003215-19.
Introduction
Measurement of coagulation factor activity has emerged as a key end point for determining treatment success of adeno-associated virus (AAV)-based gene therapies for inherited bleeding disorders, such as hemophilia A (HA). HA is caused by a genetic deficiency in coagulation factor VIII (FVIII), and AAV gene therapies are designed to complement this deficiency by providing a shortened, yet fully functional version of FVIII: for example, B-domain–deleted FVIII-SQ (BDD-FVIII-SQ) in valoctocogene roxaparvovec (AAV5-FVIII-SQ; BMN 270) (supplemental Figure 1, available on the Blood Web site).1 Given the monogenic nature of HA, increased FVIII activity in plasma should ameliorate the bleeding phenotype and be a predictive marker for clinical outcomes. This prospect has implications for patient management and drug development, because using FVIII activity as an end point allows for a more objective efficacy evaluation than using participant-reported annualized bleed rates.
FVIII activity is measured with 2 different assays: one-stage clot (OS) and chromogenic-substrate (CS) assays. However, it became clear shortly after initiation of the first AAV gene therapy trial in HA (trial 270-201, #NCT02576795) that these 2 assays did not yield identical results.1 HA participants treated with a single dose of BMN 270 gene therapy showed a plasma FVIII activity that was a mean of 1.65 times higher in the OS than in the CS assay. In contrast, recombinant BDD-FVIII products typically show lower OS than CS activity.2-6 Higher OS than CS activity was previously reported for certain purified FVIII standards, such as the mega 2 concentrate, possibly caused by FVIII modifications during lyophilization that promote faster activation, resulting in 1.3 times higher OS values.7,8 Higher OS activity was also observed in mild HA, associated with particular FVIII missense mutations.9-11 In one report, OS results were 1.67 to 4 times higher than those from the CS assay.12 Yet, because AAV gene therapy–derived FVIII-SQ is not processed in vitro and contains a wild-type consensus amino acid sequence, these prior instances did not offer an immediate explanation for the discrepant activities.
With the anticipated clinical use of AAV gene therapies in HA, we sought to better understand how the activity of transgene-produced FVIII-SQ can be reliably determined. In a field already notorious for assay discrepancies, it was also critical to compare transgene-derived FVIII activity to the activity of recombinant FVIII products, which have served as the standard of care over the past 3 decades. To these ends, we used several approaches, including a clinical laboratory field study encompassing different OS and CS assay kits, determination of specific FVIII activity (in international units per milligram), production of FVIII-SQ in different cell types, kinetic characterization of the coagulation pathway, and a correlation analysis between joint bleeds and FVIII activity.
Materials and methods
Plasma samples
Plasma from individuals treated with BMN 270 in trials 270-201 (n = 13) and 270-301 (n = 22), sponsored by BioMarin, was procured in accordance with Clinical and Laboratory Standards Institute (CLSI) guideline H21-A5 (vol. 28, no. 5; https://clsi.org/). Plasma from healthy donors and pooled plasma quality controls (QCs) (CRYOcheck PNP [Pooled Normal Plasma], ARP1, ARP2) were from Precision BioLogic, diluted in FVIII buffer (Chromogenix) as needed. Pooled congenital FVIII-deficient plasma (HRF Inc or George King Bio-Medical) was used for ReFacto-spiked QCs. The study protocols were approved by local institutional review boards or institutional ethics committees, and the patients gave informed consent.
OS FVIII activity assay
Samples were mixed 1:1 with immunodepleted FVIII-deficient plasma (Siemens), Activated Partial Thromboplastin Time (APTT) reagent (Actin FSL; Siemens), and CaCl2 (Siemens) on a BCS XP hemostasis analyzer (Siemens), and time to clot formation was measured optically. A 7-point high (1.500-0.050 IU/mL) and a 7-point low (0.150-0.0025 IU/mL) calibration curve were prepared with CRYOcheck Normal Reference Plasma (NRP; Precision BioLogic). The high curve prepared in Tris/bovine serum albumin (BSA) buffer (50 mM Tris, 150 mM NaCl, and 1% BSA) was tested in a 1:2 dilution. The low curve prepared in FVIII-deficient plasma was tested neat. Calibration was performed in duplicate, using linear regression. Clinical samples were tested in duplicate at 3 dilutions (1:2, 1:4, and 1:8 in Tris/BSA, for the high curve, and neat, 1:2, and 1:4 in FVIII-deficient plasma, for the low curve). A minimum of 2 dilutions within ±15% of the mean were needed, except for samples ≤0.050 IU/mL, for which the least dilute result was reported.
CS FVIII activity assay
Samples were mixed with phospholipids, FIXa, excess FX, and CaCl2 on a BCS XP system (Siemens), followed by addition of FXa substrate S-2765 (Z-D-Arg-Gly-Arg-pNA), using the Coatest SP4 FVIII kit (Chromogenix), and the rate of color formation was measured optically at 405 nm (kinetic mode). Eight-point high (1.500-0.150 IU/mL) and 8-point low (0.200-0.0075 IU/mL) calibration curves were prepared with CRYOcheck NRP (Normal Reference Plasma; Precision BioLogic). The high curve, prepared in Coatest FVIII buffer (1% BSA), was diluted 1:12 for the test. The low curve, prepared in congenital FVIII-deficient plasma (Helena Laboratories), was tested 1:5 diluted. Calibration was performed in duplicate, using linear regression. Clinical samples were tested in duplicate at 3 dilutions (1:12, 1:24, and 1:48 in Coatest FVIII buffer, for the high curve, and 1:5, 1:10, and 1:20 in congenital FVIII-deficient plasma for the low curve). A minimum of 2 dilutions within ±15% of the mean were required, except for samples ≤0.060 IU/mL, for which the least dilute result was reported.
BDD FVIII-SQ ELISA
For the enzyme-linked immunosorbent assay (ELISA), plates were coated with antibody (GMA-8024; Green Mountain Antibodies) and blocked, samples were diluted 1:50 in sample diluent and added to the plate. After incubation, biotinylated detection antibody (GMA-8023; Green Mountain Antibodies) was added, followed by streptavidin-horseradish peroxidase, 3,3′, 5,5′-tetramethylbenzidine substrate, and acidic stop solution. Absorbance was measured at 450 nm. A 10-point standard curve with 4 anchor points (range of quantification, 4.7-80.8 ng/mL) was prepared, using Xyntha/ReFacto antihemophilic factor (Pfizer/Wyeth) in FVIII-deficient plasma (George King Bio-Medical Inc), diluted in sample diluent, and regressed by using a 4-parameter logistic fit. Samples were tested in duplicate; samples >80.8 ng/mL were diluted and retested.
TGA
For the thrombin-generation assay (TGA), fluorogenic thrombin substrate, MP reagent (Stago), and 1000 pM recombinant FIXa (Haematologic Technologies) were added to the samples. Cleaved substrate was monitored at 37°C on a Fluoroskan Ascent microplate fluorimeter and luminometer (Thermo Fisher Scientific), correcting for α2M-thrombin and the inner-filter effect by continuous individual calibration. Data were collected by Thrombinoscope software (Stago).
FIXa kinetic studies
Normal plasma comparators consisted of CRYOcheck NRP (Precision) in FVIII-deficient plasma (Siemens). Samples were diluted (50 mM imidazole [pH 7.3], 100 mM NaCl, and 1% w/v BSA), mixed with FVIII-deficient plasma, and incubated for 7 to 8 minutes at 37°C on a heating block (Micro-Hywel), followed by addition of APTT (Actin FSL; Siemens). After 2.5 minutes, a time 0 subsample was collected. After 3 minutes, CaCl2 was added, and subsamples were collected immediately and every ∼8 to 9 seconds into an equal volume of ice-cold FIXa stop solution.13 An aliquot was frozen at −70°C for FXa and FIIa quantification. The remaining subsample was used for FIXa quantification (ROX FIX-A Kit; Rossix). In brief, subsamples were diluted in ice-cold buffer and placed into a microplate with ice-cold calibrators. The plate was heated at 37°C for 3 minutes, followed by addition of reagent 1 and reagent 2. After 4 minutes at 37°C, FXa substrate (S-2765) was added for 1 to 3 minutes, followed by 2% citric acid stop solution. Absorbance was measured at 405 nm on ThermoMax (Molecular Devices).
FXa and FIIa kinetic studies
Kinetic experiments were performed as above. FXa in stopped subsamples was quantified by a prothrombinase-complex method that measures FXa-mediated FIIa (thrombin) formation. In brief, subsamples or human FXa calibrators (Enzyme Research Laboratories) were incubated at 37°C for 3 minutes, followed by addition of human FII, bovine FVa, phospholipid-TGT (all from Rossix), and CaCl2. During a 3-minute activation at 37°C, prothrombinase (FXa+FVa) catalyzed the conversion of FII (prothrombin) into FIIa (thrombin), quantified by using an FIIa substrate S-2238 (H-D-Phe-Pip-Arg-pNA; Chromogenix). Substrate hydrolysis was stopped with 2% citric acid after 6 minutes at 37°C. Absorbance was measured at 405 nm on a ThermoMax microplate reader. Thrombin in the original subsamples was also quantified using direct hydrolysis of S-2238 and stopped with 2% citric acid after 2 hours at 37°C.
Statistical analysis
OS and CS FVIII activity
Linear regressions for postbaseline, visit-matched OS/CS FVIII activity were generated with SAS (version 9.4). Data were excluded if obtained within 72 hours or 3 calendar days of the last FVIII infusion or if below the limit of quantification (BLQ). Statistical outliers (Studentized residual >2 and DFBETAS statistics for slope parameter >2) were removed. For healthy donors, the y intercept was suppressed; without suppression, the y intercept was 9.167, the slope was 0.962, and R2 was 0.752.
Specific FVIII activity
Postbaseline FVIII activity was normalized to visit-matched FVIII-SQ protein. The intra- and interparticipant mean, standard deviation, and range were calculated. Data were excluded if obtained within 72 hours or 3 calendar days of the last FVIII infusion; BLQ activity was imputed as 0 IU/dL. Participants who did not have at least 1 quantifiable specific activity result for both the OS and CS assays were excluded.
Frequency of joint bleeds and FVIII activity measurements
Negative binomial regression was applied to postbaseline, participant-reported, treated joint bleeds, and median FVIII activity in 4-week intervals with SAS. Frequency of joint bleeds and 95% confidence limits for corresponding FVIII levels were predicted. A generalized estimating equation accounted for correlated responses within the same subject. Data were excluded if obtained within 72 hours or 3 calendar days of the last FVIII infusion; BLQ activity was imputed as 0 IU/dL.
Results
Transgene-produced FVIII-SQ has higher OS than CS activity
To compare OS and CS activity for BMN 270 transgene-produced FVIII-SQ in the first in-human gene therapy trial, 270-201 (#NCT02576795), we extended our previous 1-year analysis1 by using cumulative 3-year data for cohort 3 (dose, 6 e13 vector genomes [vg]/kg) and 2-year data for cohort 4 (dose, 4 e13 vg/kg).14 The constant rate of change between OS and CS activity was 1.656 (R2 = 0.963), as evaluated by the slope of the OS/CS regression line (Figure 1A). Similar results were obtained by linear regression of interim FVIII activity data from the pivotal trial 270-301 (#NCT03370913, dose, 6 E13 vg/kg), where the OS/CS slope was 1.534 (R2 = 0.958; Figure 1B). In contrast, a linear regression of FVIII activity in 20 healthy donors showed an OS/CS slope of 1.068 (R2 = 0.99; Figure 1C). Furthermore, pooled normal plasma (supplemental Figure 2) and the 6th World Health Organization international standard (supplemental Table 1) were quantified with comparable FVIII activity in the OS and CS assays. Therefore, the consistently higher OS than CS activity measurements were specific to transgene-produced FVIII-SQ.
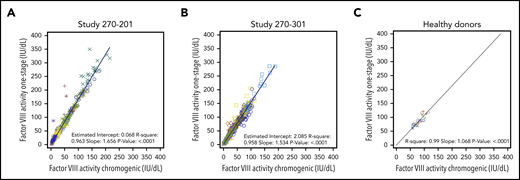
Correlation between FVIII activities measured in OS and CS assays. FVIII activity data from OS and CS assays in BMN 270 clinical trials 270-201 (A), 270-301 (B), and in 20 healthy donors (C) were correlated using linear regression. Each data point represents FVIII activity data from 1 visit; multiple visits for the same participant are represented by the same colored symbol. The slope of the regression curve reflects the constant rate of change between the OS and CS activity measurements.
Correlation between FVIII activities measured in OS and CS assays. FVIII activity data from OS and CS assays in BMN 270 clinical trials 270-201 (A), 270-301 (B), and in 20 healthy donors (C) were correlated using linear regression. Each data point represents FVIII activity data from 1 visit; multiple visits for the same participant are represented by the same colored symbol. The slope of the regression curve reflects the constant rate of change between the OS and CS activity measurements.
No discernible impact of assay reagents or kits on the OS/CS difference
Various reagents were investigated in both assays (supplemental Figure 3-5); none accounted for the higher OS activity of transgene-produced FVIII-SQ. Recombinant BDD-FVIII (Xyntha/ReFacto and Novoeight antihemophilic factors) showed lower quantification in the OS than in the CS assays (supplemental Figure 6), as expected.2,6,15 To further investigate the potential impact of various OS and CS assay kits, while accounting for test-site–specific differences, a retrospective field study was conducted across a total of 13 different study sites in trials 270-201 (supplemental Table 2) and 270-301 (supplemental Table 3). The OS kits at the local laboratories used 7 different APTT reagents containing synthetic, animal-derived, or plant-based phospholipids and 3 different types of surface activators (ellagic acid, silica, or kaolin). Six different CS kits were used, which contained human or bovine FIXa/FX reagents, with 4 different chromogenic FXa substrates. Using linear regression of FVIII activity, we determined the OS/CS slopes for gene therapy samples in each laboratory, which ranged from 1.292 to 2.013 across both trials, with >1000 unique samples analyzed (supplemental Tables 2 and 3). Thus, higher OS than CS activity was measured for transgene-produced FVIII-SQ, irrespective of assay reagents, kits, or test site. The consistent magnitude and directionality of the OS/CS difference across laboratories suggested that the underlying mechanism is intrinsic to transgene-produced FVIII-SQ and not an artifact of any particular assay kit or testing facility.
Specific activity for transgene-produced and recombinant FVIII-SQ are comparable in the CS assay
To determine specific FVIII activity, gene therapy samples with known OS and CS activity were tested in a validated FVIII-SQ protein ELISA. We first confirmed that HA plasma spiked with Xyntha showed the expected specific activity for recombinant FVIII-SQ products6,16 in the OS and CS assays (Figure 2A-B). For individual gene therapy participants, the specific activity for transgene-produced FVIII-SQ when using the OS assay ranged from 18 331 to 24 650 IU/mg in trial 270-201 (Figure 2C) and from 13 243 to 34 575 IU/mg in trial 270-301 (Figure 2E), with an interparticipant average in each trial of 20 481 and 21 839 IU/mg, respectively. These values are more than 2 times above the upper limit of specific activity for recombinant FVIII-SQ products when using the OS assay.16 In contrast, the specific activity for transgene-produced FVIII-SQ, according to the CS assay, ranged from 10 581 to 14 031 IU/mg for individual gene therapy participants in trial 270-201 (Figure 2D) and from 6 981 to 19 375 IU/mg in trial 270-301 (Figure 2F), with an interparticipant average in each trial of 12 224 and 13 217 IU/mg, respectively. These values fall within the range of specific activity for recombinant FVIII-SQ products when using the CS assay.6 Of note, the apparently higher variability of specific FVIII activity across participants in trial 270-301 (in both assays) was likely confounded by the higher number of participants summarized for this study.
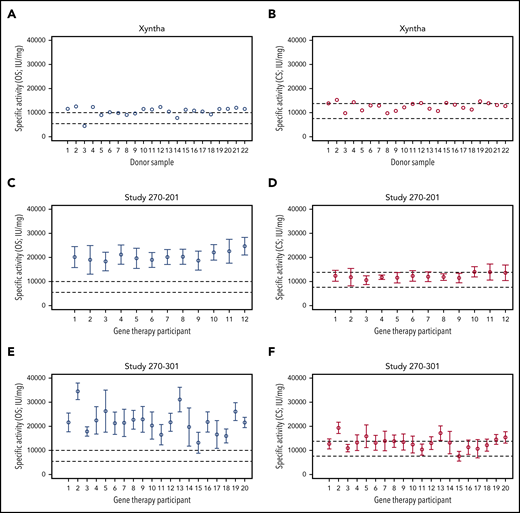
Specific activity of recombinant and transgene-produced FVIII-SQ. (A-B) Recombinant FVIII-SQ (Xyntha) was spiked into plasma from individuals with severe HA, to determine the specific activity using the OS or CS assay. (C-D) Mean specific activity for transgene-produced FVIII-SQ in individual participants from BMN 270 clinical trial 270-201 was determined using the OS or CS assay. (E-F) Mean specific activity for transgene-produced FVIII-SQ in individual participants from BMN 270 clinical trial 270-301 was determined using the OS or CS assay. Dashed lines in panels A, C, and E represent the specification range for specific activity reported for Xyntha (5500-9900 IU/mg).16 Dashed lines in panels B, D, and F represent the specification range for specific activity reported for ReFacto (7 600-13 800 IU/mg).6 Given the lower activity of recombinant FVIII-SQ in the OS than in the CS assay, the specification range depends on which assay is used for product labeling (OS for Xyntha, CS for ReFacto). Error bars in panels C-F represent intraparticipant standard deviations.
Specific activity of recombinant and transgene-produced FVIII-SQ. (A-B) Recombinant FVIII-SQ (Xyntha) was spiked into plasma from individuals with severe HA, to determine the specific activity using the OS or CS assay. (C-D) Mean specific activity for transgene-produced FVIII-SQ in individual participants from BMN 270 clinical trial 270-201 was determined using the OS or CS assay. (E-F) Mean specific activity for transgene-produced FVIII-SQ in individual participants from BMN 270 clinical trial 270-301 was determined using the OS or CS assay. Dashed lines in panels A, C, and E represent the specification range for specific activity reported for Xyntha (5500-9900 IU/mg).16 Dashed lines in panels B, D, and F represent the specification range for specific activity reported for ReFacto (7 600-13 800 IU/mg).6 Given the lower activity of recombinant FVIII-SQ in the OS than in the CS assay, the specification range depends on which assay is used for product labeling (OS for Xyntha, CS for ReFacto). Error bars in panels C-F represent intraparticipant standard deviations.
Influence of sequence polymorphism, production cell type, and codon optimization on the OS/CS assay difference
Because of a natural polymorphism, the Xyntha/ReFacto sequence differs by 1 amino acid from the consensus sequence encoded by BMN 270.17,18 To determine whether this polymorphism (Phe1880Leu) influences the behavior of FVIII-SQ in the assays, we expressed FVIII-SQLeu1880 (ReFacto-like) or FVIII-SQPhe1880 (BMN270-like) in Chinese hamster ovary (CHO) cells. Similar OS/CS or lower OS than CS activity was measured for both sequence variants (Table 1; top rows). Thus, the single amino acid exchange is unlikely to account for the lower OS than CS activity of recombinant FVIII-SQ products. Moreover, the decreased OS activity of BMN 270-like FVIII-SQPhe1880 from CHO cells suggested an impact by production cells.
OS and CS activity of recombinant FVIII-SQ variants
| Production cell type | Recombinant FVIII-SQ variant tested | Clone/production lot/ medium conditions | OS FVIII activity (IU/dL) | CS FVIII activity (IU/dL) | OS/CS ratio |
|---|---|---|---|---|---|
| Sequence polymorphism | |||||
| CHO | Leu1880 (Xyntha-like) | Clone 4-E2 | 96.2 | 92.8 | 1.037 |
| Clone 1-A12 | 132.0 | 129.5 | 1.020 | ||
| Clone 1-A12, 1:10 retest | 11.5 | 14.6 | 0.788 | ||
| CHO | Phe1880 (BMN270-like) | Clone 5-A5 | 44.9 | 54.5 | 0.823 |
| Clone 2-B4 | 29.8 | 39.3 | 0.758 | ||
| Clone 1-F5 | 23.9 | 27.3 | 0.877 | ||
| Production cell type | |||||
| CHO* | Xyntha (Wyeth/Pfizer) | Lot W05255 | 76.0 | 92.7 | 0.820 |
| HepG2 | FVIII-SQ (BioMarin) | Lot 1 | 128.0 | 61.0 | 2.098 |
| Lot 2 | 322.6 | 176.7 | 1.826 | ||
| Lot 3 | 71.5 | 35.2 | 2.031 | ||
| Codon optimization | |||||
| HepG2 | Codon optimized† | Serum-free | 179.1 | 136.0 | 1.317 |
| Serum-containing | 882.1‡ | 456.8 | 1.931 | ||
| HepG2 | Not codon optimized | Serum-free | 5.0 | 3.8 | 1.316 |
| Serum-containing | 28.7 | 14.2 | 2.021 | ||
| HEK 293 | Codon optimized† | Serum-containing | 56.9 | 32.6 | 1.744 |
Based on a literature reference.19
Same codon optimization as in BMN 270.
The back-calculated result is above the upper reportable limit, but raw data for the diluted test sample were obtained within the validated range of quantification.
Xyntha and ReFacto are manufactured using CHO cells,19 whereas gene therapy FVIII-SQ is produced by hepatocytes within the human body. To directly investigate whether the species of the production cells influences the behavior of FVIII-SQ in the assays, we tested FVIII-SQ purified from transduced human liver carcinoma cells (HepG2), which maintained higher OS than CS activity similar to transgene-produced FVIII-SQ in patient plasma, whereas CHO-derived Xyntha showed lower OS measurements (Table 1; middle rows). Thus, species-specific mechanisms in production cells could influence the diverging behavior of recombinant and transgene-produced FVIII-SQ in the OS assay.
BMN 270 was codon optimized to facilitate efficient translation in human cells, which may affect FVIII-SQ folding, with potential consequences for stability, protease sensitivity, and function.20,21 To test whether codon optimization plays a role in the OS/CS difference, FVIII-SQ was expressed in HepG2 cells from either a codon-optimized or non–codon-optimized vector. Higher OS than CS activity was measured for FVIII-SQ from both vectors (Table 1; bottom rows). To investigate potential tissue-specific differences, we transfected human embryonic kidney-293 (HEK293) cells with the codon-optimized vector, which also resulted in higher OS than CS activity for FVIII-SQ. In summary, the higher OS than CS activity of FVIII-SQ expressed in human cells was not a result of codon optimization or liver-specific modifications.
Kinetic studies reveal an accelerated rate of early FXa and thrombin generation
We previously reported that transgene-produced FVIII-SQ and native FVIII show similar FXa kinetics in the CS assay.1 To investigate the reaction kinetics in the OS assay, samples from 2 gene therapy participants were compared with normal plasma in stop kinetics experiments. The comparison was based on the same CS activity to identify any potential kinetic bias between the OS and CS assay. Samples were incubated with APTT reagent; subsamples were collected after addition of CaCl2 and quantified for FIXa, FXa, and FIIa (thrombin). Whereas kinetic profiles for FIXa generation were indistinguishable between gene therapy samples and their normal plasma comparators (Figure 3A-B), the quantities of FXa (Figure 3C-D) and thrombin (Figure 3E-F) generated between 40 and 60 seconds after addition of CaCl2 were elevated in gene therapy samples, suggesting a mechanism for faster clot formation. Hence, FXa levels generated by transgene-produced FVIII-SQ within the first minute in the OS assay were higher than those expected from its assigned CS activity. Because CS activity is assigned based on FXa levels generated after 5 minutes, these observations suggest that transgene-produced FVIII-SQ selectively accelerates early vs late FXa generation, in comparison with native FVIII. The kinetic bias resulting from the different readout times in OS and CS assays may explain why gene therapy samples have higher FVIII activity in the shorter OS assay.
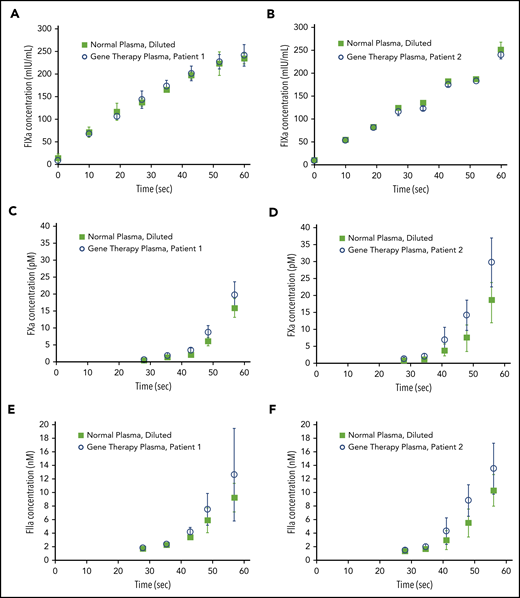
Kinetics of FIXa, FXa, and FIIa formation in the OS assay. Plasma samples containing transgene-produced FVIII-SQ (gene therapy plasma), collected from 2 different participants treated with BMN 270, and plasma samples containing native FVIII (normal plasma, diluted) with the same CS activity were compared in stop kinetics experiments in the OS assay. FIXa generation (A-B), FXa generation (C-D), and FIIa (thrombin) generation (E-F) were monitored for 60 seconds after addition of CaCl2. Error bars represent standard deviations between replicate assessments.
Kinetics of FIXa, FXa, and FIIa formation in the OS assay. Plasma samples containing transgene-produced FVIII-SQ (gene therapy plasma), collected from 2 different participants treated with BMN 270, and plasma samples containing native FVIII (normal plasma, diluted) with the same CS activity were compared in stop kinetics experiments in the OS assay. FIXa generation (A-B), FXa generation (C-D), and FIIa (thrombin) generation (E-F) were monitored for 60 seconds after addition of CaCl2. Error bars represent standard deviations between replicate assessments.
To confirm that the accelerated onset of coagulation did not result in global overactivation, we used a TGA. Samples collected from gene therapy participants after they had reached nonhemophilic FVIII activity levels (CS ≥40 IU/dL) showed similar endogenous thrombin potential (ETP) and peak height, compared with normal plasma, consistent with overall normal coagulation capacity (Figure 4). Median values for thrombin lag time and time-to-peak were decreased but remained within the normal range, thus confirming a minor acceleration of thrombin formation.
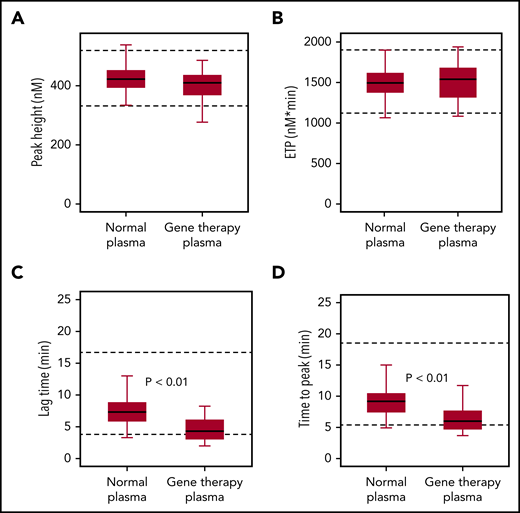
FIXa-triggered thrombin generation assay. Native FVIII in healthy donor samples (normal plasma; n = 40) was compared with transgene-produced FVIII-SQ in trial 270-301 (gene therapy plasma; n = 25), after individual participants (n = 7) had reached nonhemophilic CS activity levels (≥40 IU/dL) between weeks 23 and 26. Box-and-whisker plots were generated for thrombin peak height (A), ETP (B), lag time (C), and time-to-peak (D). The horizontal line in the box represents the median, the box represents the Q1 to Q3 interquartile range (IQR), and the whiskers indicate the minimum and maximum value that fell within Q1 to 1.5 × IQR and Q3 + 1.5 × IQR, respectively. Dashed horizontal lines represent the lower and upper limits of the normal reference range, respectively. P values represent significance levels from Mood’s median test.
FIXa-triggered thrombin generation assay. Native FVIII in healthy donor samples (normal plasma; n = 40) was compared with transgene-produced FVIII-SQ in trial 270-301 (gene therapy plasma; n = 25), after individual participants (n = 7) had reached nonhemophilic CS activity levels (≥40 IU/dL) between weeks 23 and 26. Box-and-whisker plots were generated for thrombin peak height (A), ETP (B), lag time (C), and time-to-peak (D). The horizontal line in the box represents the median, the box represents the Q1 to Q3 interquartile range (IQR), and the whiskers indicate the minimum and maximum value that fell within Q1 to 1.5 × IQR and Q3 + 1.5 × IQR, respectively. Dashed horizontal lines represent the lower and upper limits of the normal reference range, respectively. P values represent significance levels from Mood’s median test.
Correlation between frequency of joint bleeds and FVIII activity measurements
To determine whether OS and CS assay remained relevant for clinical outcomes, a correlation analysis of participant-reported, treated joint bleeds, and median FVIII activity in 4-week intervals was performed, using data from gene therapy trials 270-201 (Figure 5A) and 270-301 (Figure 5B). Most joint bleeds (42 of 43) reported by 35 participants across both trials occurred at a median FVIII activity of less than 15 IU/dL (OS) and less than or equal to 10 IU/dL (CS). Using a negative binomial model, both OS and CS activity strongly correlated with the predicted frequency of joint bleeds in each trial (P ≤ .001; Figure 5). The regression curve for OS activity was right shifted, however, compared with that for CS activity, in particular for OS activity levels <15 IU/dL. This observation implies a trend toward higher predicted bleed risk for the same numerical FVIII activity value, if measured with the OS instead of the CS assay. Additional clinical data are needed to substantiate this trend, given that the 95% confidence intervals (CIs) overlapped. At and above a median FVIII activity of 40 IU/dL, by definition the lowest nonhemophilic level,22 the predicted frequency of joint bleeds was close to 0 in either assay (CS, <0.001 per 4 weeks; OS, <0.002 per 4 weeks). Therefore, both the OS and CS assay remain clinically meaningful for distinguishing hemophilic from nonhemophilic conditions after administration of BMN 270 gene therapy.

Correlation between frequency of joint bleeds and FVIII activity levels. For each participant, the number of treated joint bleeds per 4-week interval was correlated with the median FVIII activity within each interval, as measured using the OS (blue circles) or CS (red circles) assay in BMN 270 clinical trials 270-201 (A) and 270-301 (B). The predicted bleed frequency per 4-week interval was modeled by negative binomial regression for OS activity (blue solid line) and CS activity (red dashed line). Shaded colored areas represent the corresponding 95% CI. No joint bleeds were reported for FVIII activity >50 IU/dL in either assay; these data were included in the modeling but are not shown here.
Correlation between frequency of joint bleeds and FVIII activity levels. For each participant, the number of treated joint bleeds per 4-week interval was correlated with the median FVIII activity within each interval, as measured using the OS (blue circles) or CS (red circles) assay in BMN 270 clinical trials 270-201 (A) and 270-301 (B). The predicted bleed frequency per 4-week interval was modeled by negative binomial regression for OS activity (blue solid line) and CS activity (red dashed line). Shaded colored areas represent the corresponding 95% CI. No joint bleeds were reported for FVIII activity >50 IU/dL in either assay; these data were included in the modeling but are not shown here.
Discussion
We studied the activity of transgene-produced FVIII-SQ after administration of BMN 270 gene therapy and showed that the probable cause of the higher OS than CS activity was an accelerated onset of FXa and thrombin formation (Figure 3). This would predominantly affect the OS assay because of the shorter readout time (Figure 6). TGA assessments provided no evidence of increased thrombotic risk, because neither ETP nor peak height was elevated (Figure 4).23-25 Further, the specific activity of transgene-produced and recombinant FVIII-SQ (ReFacto and Xyntha) remained comparable in the CS assay but not in the OS assay (Figure 2). Thus, any plasma level of transgene-produced FVIII-SQ protein is expected to yield similar CS activity as a continuous infusion of the same mass quantity of recombinant products (supplemental Figure 7).

Illustration of kinetic bias leading to higher OS than CS activity of transgene-produced FVIII-SQ. Transgene-produced FVIII-SQ accelerates early FXa formation compared with native FVIII, resulting in a small increase in FXa concentration (picomolar range, pM). This leads to faster thrombin activation and clot formation in the OS assay, which may explain the higher OS measurements, given that this assay uses a kinetic end point (time to visible clot) within the first 1 to 2 minutes of the coagulation reaction. In contrast, the CS assay uses more dilute test samples and determines FXa concentrations after a longer, fixed incubation period of 5 minutes. At this point, FXa generation has been exponentially amplified (nanomolar range, nM) and presumably remains unaffected by the minute differences that occurred earlier in the reaction. The different timing of assay readout therefore leads to a kinetic bias between OS and CS assay, whereby the shorter assay (OS) reports higher FVIII activity values.
Illustration of kinetic bias leading to higher OS than CS activity of transgene-produced FVIII-SQ. Transgene-produced FVIII-SQ accelerates early FXa formation compared with native FVIII, resulting in a small increase in FXa concentration (picomolar range, pM). This leads to faster thrombin activation and clot formation in the OS assay, which may explain the higher OS measurements, given that this assay uses a kinetic end point (time to visible clot) within the first 1 to 2 minutes of the coagulation reaction. In contrast, the CS assay uses more dilute test samples and determines FXa concentrations after a longer, fixed incubation period of 5 minutes. At this point, FXa generation has been exponentially amplified (nanomolar range, nM) and presumably remains unaffected by the minute differences that occurred earlier in the reaction. The different timing of assay readout therefore leads to a kinetic bias between OS and CS assay, whereby the shorter assay (OS) reports higher FVIII activity values.
The diverging OS activities of transgene-produced and recombinant FVIII-SQ may be explained by differences between human- and nonhuman-production cells (Table 1). This could be related to differences in posttranslational modifications26 or protein folding; these possibilities are under investigation. Of note, other recombinant products, such as Fc-fused (Eloctate) or unmodified (Nuwiq) BDD-FVIII show lower OS than CS activity and yet are manufactured in human HEK293 cells.4,27,28 For a single-chain version of Fc-fused BDD-FVIII, the lower OS than CS activity is caused by delayed release of von Willebrand factor.29 Therefore, additional modifiers (for example, during lyophilization) may influence assay discrepancies for recombinant products.
Despite the discrepant activity measurements for transgene-produced FVIII-SQ, both OS and CS assays remain clinically meaningful for distinguishing hemophilic from nonhemophilic conditions after administration of BMN 270 gene therapy (Figure 5). Correlations between FVIII activity level and joint bleed rate were somewhat limited in our studies, because spontaneous bleeds were generally rare and are self-reported by participants and thus are prone to some level of subjectivity. Nonetheless, the predicted absence of joint bleeds at ≥40 IU/dL median FVIII activity in both assays corresponds with the WHO definition of HA.22 These data are also aligned with reports of patients with severe HA who received tertiary prophylaxis with recombinant products: at 40 IU/dL FVIII activity, the predicted proportion of patients without spontaneous joint bleeds was 100% (95% CI, 94.25-100).30
Protection from spontaneous bleeds by transgene-produced FVIII-SQ appeared to persist, even at lower levels (Figure 5). Both assays reliably predicted a negligible bleed risk at FVIII activity ≥15 IU/dL, consistent with the literature and clinical experience to date.31,32 At levels <15 IU/dL, however, the OS assay was associated with higher predicted frequency of joint bleeds compared with the CS assay. Therefore, clinical phenotypes should be observed carefully during clinical practice to evaluate how transgene-produced FVIII-SQ activity aligns with the theoretical risk of breakthrough bleeding in severe (<1 IU/dL), moderate (1-5 IU/dL), and mild (5-40 IU/dL) HA conditions.22,31-34 It is still conceivable that an accelerated onset of FXa generation mediated by transgene-produced FVIII-SQ in vitro and detected in the OS assay may support coagulation in vivo, in particular at lower levels. Nonetheless, the CS activity was chosen as a surrogate endpoint during BMN 270 clinical development to ensure the most conservative assessment of hemostatic efficacy. In addition, using CS activity enables direct comparability between AAV gene therapy and current standard of care, given the consistent specific FVIII activity in the CS assay across different drug modalities.
Assaydiscrepancies involving higher OS than CS values have also been identified for other AAV-based gene therapies in HA when using BDD-FVIII35 and in hemophilia B when using FIX-Padua (FIXR338L).36 The Padua mutation increases the specific activity of FIX, and thus kinetic issues related to an accelerated onset of the clotting reaction in the OS assay may play a role for FIX-Padua as well. A more general commonality between AAV gene therapies could be the use of codon-optimized vectors. In rare cases, codon optimization influences protein folding and biological activity20,21 ; however, the experiences in our study show that codon optimization was not responsible for higher OS than CS activity of FVIII-SQ from a human liver cell line (Table 1). It will be valuable to investigate codon optimizations for FIX37 and FIX-Padua36 in future research.
Another consideration for liver-directed AAV-FVIII gene therapies is that hepatocytes are an ectopic expression site for FVIII, given that native FVIII is mainly produced in various types of endothelial cells, including liver sinusoidal cells.38,39 Although our studies excluded higher OS than CS activity of FVIII-SQ as a liver-specific phenomenon (Table 1), it remains possible that endothelial cells modify or secrete FVIII differently than hepatocytes. More work is needed to understand molecular differences in intra- and extracellular FVIII processing, including posttranslational modifications, in different human cell types. Of note, such mechanisms would not apply to assay discrepancies for liver-directed AAV-FIX gene therapies, because native FIX is also produced in hepatocytes.40
Historically, adherence to the like-vs-like principle when determining FVIII activity in plasma samples using plasma-derived calibrators has resulted in high agreement between OS and CS assays.41 With the advent of recombinant FVIII products, however, assay discrepancies began to occur, typically with lower OS than CS activity.2-4,27,42 Assay discrepancies are also common for novel, modified recombinant FVIII/FIX products with extended half-life (EHL).43-45 In general, potency assignments of EHL-FVIII products show fairly limited OS/CS assay discrepancy, but different APTT reagents may yield discrepant results.28,46-50 For EHL-FIX products, OS/CS assay discrepancies can be pronounced.13,51-54 This complexity has led to guiding recommendations for potency assignment of recombinant FVIII/FIX products.55
A probable root cause underlying many of these assay discrepancies is a deviation from the like-vs-like principle: that is, defined molecular differences between nonnative FVIII/FIX analytes and native FVIII/FIX calibrators, leading to divergent behavior in the assays. This has been biochemically corroborated for some nonnative FIX products.13,56 These studies suggest that departures from the like-vs-like principle may occur more often in OS than in CS assays because of their shorter readout time. The findings reported herein for gene therapy–derived FVIII-SQ appear to corroborate this vulnerability of OS assays and confirm the broad utility of CS assays for clinical monitoring of nonnative FVIII analytes. In laboratories where only an OS assay is available, a thoroughly evaluated, laboratory-specific OS/CS conversion factor may be established for gene therapy samples to interpolate the corresponding activity in the CS assay.
Original data are available by e-mail request to the corresponding author (christian.vettermann@bmrn.com).
The online version of this article contains a data supplement.
The publication costs of this article were defrayed in part by page charge payment. Therefore, and solely to indicate this fact, this article is hereby marked “advertisement” in accordance with 18 USC section 1734.
Acknowledgments
The authors thank Christopher Tudan and Krystal Sandza for validation of the BDD FVIII-SQ ELISA; Steve McBryant for validation of the TGA; Alex Giaramita, Vishal Agrawal, Melanie Lo, and Lucy Crockett for recombinant expression and characterization of FVIII-SQ; Annie Clark and Kevin Hammond for assistance with specific FVIII activity and TGA analyses; Lon Cardon for critically reviewing the manuscript; Maia Astera for designing the graphical abstract; Kendra Bolt and AlphaBioCom for publishing assistance; the following Principal Investigators in the BMN 270 clinical trials 270-201 and 270-301 for providing local FVIII activity measurements: Michael Laffan (Hammersmith Hospital, Imperial College, Healthcare NHS Trust, London, United Kingdom), Bella Madan (Guy’s and St Thomas’, NHS Foundation Trust, London, United Kingdom), Doris V. Quon (Orthopedic Institute for Children, Los Angeles, CA), Rashid S. Kazmi (University Hospital Southampton, Southampton, United Kingdom), Andrew D. Leavitt (University of California, San Francisco, CA), Will Lester (Queen Elizabeth Hospital Birmingham, Edgbaston, United Kingdom), Steven W. Pipe (University of Michigan, Ann Arbor, MI), and Michael Wang (University of Colorado, Aurora, CO); and all persons with HA and their families for participating in the BMN 270 clinical trials.
Authorship
Contribution: S. Rosen, S.T., M.R., S.J.Z., T.C., and C.V. designed the experiments; S. Rosen performed the OS kinetics experiments; D.M. performed the FVIII-SQ purifications; S. Rosen, M.R., M.H., J.S., and C.V. performed data analyses and prepared the figures; S. Rosen and C.V. wrote the manuscript; and K.J.P., S. Rangarajan, E.S., A.G., G.F.P., B.K., and S.J.Z. critically reviewed and/or edited the manuscript.
Conflict-of-interest disclosure: S. Rosen is chairman of Rossix AB. S.T. and M.R. are employees and hold stock in Laboratory Corporation of America Holdings. S. Rosen and G.F.P. are consultants for BioMarin Pharmaceutical Inc. M.H., J.S., D.M., T.C., B.K., S.J.Z., and C.V. are employees and own stock in BioMarin Pharmaceutical Inc. The remaining authors declare no competing financial interests.
Correspondence: Christian Vettermann, BioMarin Pharmaceutical, Inc, 791 Lincoln Ave, San Rafael, CA 94901; e-mail: christian.vettermann@bmrn.com.

This feature is available to Subscribers Only
Sign In or Create an Account Close Modal