

Key Points
Substrate reduction therapy by iron restriction–mediated downregulation of ALAS2 efficiently reduces porphyrin accumulation in CEP.
Iron chelation decreases porphyrin overload and reverses hemolytic anemia and skin photosensitivity in CEP mice.

Abstract
Congenital erythropoietic porphyria (CEP) is an inborn error of heme synthesis resulting from uroporphyrinogen III synthase (UROS) deficiency and the accumulation of nonphysiological porphyrin isomer I metabolites. Clinical features are heterogeneous among patients with CEP but usually combine skin photosensitivity and chronic hemolytic anemia, the severity of which is related to porphyrin overload. Therapeutic options include symptomatic strategies only and are unsatisfactory. One promising approach to treating CEP is to reduce the erythroid production of porphyrins through substrate reduction therapy by inhibiting 5-aminolevulinate synthase 2 (ALAS2), the first and rate-limiting enzyme in the heme biosynthetic pathway. We efficiently reduced porphyrin accumulation after RNA interference–mediated downregulation of ALAS2 in human erythroid cellular models of CEP disease. Taking advantage of the physiological iron-dependent posttranscriptional regulation of ALAS2, we evaluated whether iron chelation with deferiprone could decrease ALAS2 expression and subsequent porphyrin production in vitro and in vivo in a CEP murine model. Treatment with deferiprone of UROS-deficient erythroid cell lines and peripheral blood CD34+-derived erythroid cultures from a patient with CEP inhibited iron-dependent protein ALAS2 and iron-responsive element–binding protein 2 expression and reduced porphyrin production. Furthermore, porphyrin accumulation progressively decreased in red blood cells and urine, and skin photosensitivity in CEP mice treated with deferiprone (1 or 3 mg/mL in drinking water) for 26 weeks was reversed. Hemolysis and iron overload improved upon iron chelation with full correction of anemia in CEP mice treated at the highest dose of deferiprone. Our findings highlight, in both mouse and human models, the therapeutic potential of iron restriction to modulate the phenotype in CEP.
Introduction
Inherited porphyrias are metabolic disorders affecting the heme biosynthesis pathway and are usually classified into hepatic and erythropoietic forms according to the tissue responsible for the major porphyrin overproduction.1 Congenital erythropoietic porphyria (CEP; OMIM 263700) is caused by the deficient enzymatic activity of the cytosolic enzyme uroporphyrinogen III synthase (UROS; EC 4.2.1.75), leading to massive overproduction of uroporphyrin I and coproporphyrin I isomers by the erythron in the bone marrow.2,3 These highly photocatalytic compounds accumulate in erythrocytes, liver, spleen, and skin, inducing chronic hemolysis and skin photosensitivity after sunlight exposure. The clinical severity of CEP varies, from minor skin photosensitivity to severe transfusion-dependent hemolytic anemia.4
To date, 51 different disease-causing mutations have been reported through the UROS gene.5 We recently made significant progress toward a better understanding of the molecular basis of UROS mutation pathogenicity, opening new perspectives for the pharmacologic treatment of CEP.6-8 Classical treatments are unsatisfactory and limited to symptomatic options only; the severe forms remain untreatable, with current interventions being limited to allogenic hematopoietic stem cell transplantation.9,10 Gene therapy by transplantation of genetically modified hematopoietic stem cells is an alternative strategy, and clinical trials need to be performed.11-13 Substrate reduction therapy aims at restoring metabolic homeostasis and reducing the synthesis of toxic substrates, usually by limiting the first committed step in a metabolic pathway.14 In humans, the regulation of heme biosynthesis mainly occurs at the first and rate-limiting step catalyzed by the ALAS enzyme (5-aminolevulinate synthase; EC 2.3.1.37).15 Two isoforms of ALAS exist: ALAS1, which is encoded by a ubiquitous gene and regulated by free heme levels in hepatocytes; and ALAS2, which is regulated during erythropoiesis by iron availability due to the presence of an iron-responsive element (IRE) located in the 5′-untranslated region.16,17 If iron availability is poor, IRE-binding proteins (in particular IRP2) bind the IRE, block translation, and diminish the availability of ALAS2. Several studies in recent years have posited the role of ALAS2 expression as a modulator of disease severity in erythropoietic porphyria.15,18-20 Gain-of function mutations in the ALAS2 gene are responsible for X-linked protoporphyria and have been found to be associated with increased severity in patients with CEP.15,18 In contrast, Egan et al21 first reported major improvement of CEP symptoms in a patient with iron deprivation due to gastrointestinal bleeding. Furthermore, off-label treatment with the iron chelator deferasirox led to a similar remarkable improvement of the disease. The authors also showed that iron deprivation decreased ALAS2 expression and porphyrin production in the erythroid progeny of bone marrow CD34+ cells from the patient with CEP. We recently obtained a similar clinical improvement in a patient with CEP prospectively treated by iterative phlebotomies to induce long-term iron depletion.22 We also provided evidence that iron content modulates porphyrin production in CEP erythroid cells derived from peripheral blood CD34+ cells in vitro.
The current study further investigated these pioneering studies by evaluating whether ALAS2 or porphobilinogen deaminase (PBGD) downregulation as a substrate reduction therapy could decrease porphyrin production in several cellular models and a murine model of CEP. The short hairpin RNA (shRNA)-mediated downregulation of ALAS2 and PBGD led to a drop in porphyrin accumulation in new human erythroid cellular models of UROS deficiency (TF1UROSi cells), highlighting their role as a key regulator of porphyrin production. Owing to the peculiar regulation of ALAS2 by iron availability, we then investigated the effect of iron depletion on ALAS2 expression and porphyrin accumulation in vitro. ALAS2 expression and porphyrin accumulation decreased after treatment with an iron chelator (deferiprone [DEF]) in TF1UROSi and primary CD34+ peripheral blood mononuclear cell–derived erythroid cells from a patient with CEP. Finally, we observed a significant drop in porphyrin accumulation, leading to the reversal of skin photosensitivity and hemolytic anemia in CEP mice treated with DEF for 26 consecutive weeks. We show here that ALAS2 inhibition is an efficient therapeutic strategy to lessen porphyrin production and improve the clinical outcome in CEP. Although the effectiveness and safety of long-term chronic iron chelation in patients with CEP remain to be determined, our results open the way for the development of specific ALAS2 inhibitors as a future treatment of erythropoietic porphyria.
Materials and methods
Targeted inactivation of the UROS gene in TF1 cells using CRISPR/Cas9
We developed erythroid cellular CEP models by targeting the UROS gene with CRISPR/Cas9 D10A nickase in human erythroleukemic TF1 cells. The CHOPCHOPv2 algorithm68 (chopchop.cbu.uib.no) was used to identify guide RNAs (gRNAs) with the highest score to target UROS exon 4 or exon 10 (supplemental Figure 1, available on the Blood Web site). UROS-gRNAs were cloned into the pX462 backbone vector (plasmid 48141; Addgene, https://www.addgene.org) using standard cloning methods, and the plasmid constructions were validated by Sanger sequencing. TF1 cells were transfected by nucleofection (Nucleofector; Lonza AG) with the pX462-UROS-sgRNA plasmid (1 μg) and selected with puromycin for 72 hours before subcloning by a limited dilution assay. We selected UROS-inactivated (named hereafter UROSE4i and UROSE10i) cellular clones by fluorescent microscopy based on their red fluorescence under UV excitation due to the spontaneous accumulation of porphyrins. The UROS locus (exons 4 and 10) from TF1-UROSE4i and TF1-UROSE10i cellular clones was polymerase chain reaction (PCR)-amplified (primer sequence supplied in supplemental Table 1) and subjected to Sanger sequencing. Allelic analyses were performed of individual cellular clones with the software program ICE v2 CRISPR Analysis Tool to determine the individual allelic sequences within the multi-peaked breakdown product after CRISPR/Cas9 activity.
Erythroid differentiation of CD34+ peripheral blood mononuclear cells derived from a patient with CEP
CD34+ hematopoietic progenitors/stem cells were isolated from umbilical cord blood of normal full-term deliveries (control) and steady-state peripheral blood mononuclear cells from a patient with CEP (CEP) obtained after she provided written informed consent. The patient is a 26-year-old white woman harboring compound heterozygosity for unreported UROS mutations: paternally transmitted intronic c.562-4A>T variant on one allele and missense c.589A>G class 3 variant (p.S197G), maternally transmitted on the second one. Since childhood, she has presented with elevated urinary excretion of type 1 isomer porphyrins (>1600 nmol/mmol creatinine; normal, <30 nmol/mmol creatinine) and a deficient UROS enzymatic activity in red blood cells (RBCs) (2.4 IU; normal, >6 IU). Her CEP disease phenotype is mild, and clinical manifestations include skin photosensitivity and hypertrichosis with no hemolytic anemia.
To induce cell proliferation and erythroid differentiation, CD34+ cells were cultured in serum-free medium (StemSpan SFEM II medium; Stemcell Technologies) by adapting a previously described 3-step protocol.23 Briefly, in the first step (0-7 days), CD34+ cells were amplified in the presence of interleukin-3 (10 ng/mL), interleukin-6 (10 ng/mL), thrombopoietin (50 ng/mL), Flt-3 ligand (50 ng/mL), and stem cell factor (50 ng/mL). In the second step (8-11 days), cells were cultured in SFEM II medium containing insulin-like growth factor 1 (100 ng/mL), stem cell factor (100 ng/mL), and erythropoietin (5 U/mL), followed by a final step (up to 17 days) devoid of stem cell factor.
Silencing ALAS2 and PBGD expression by RNA interference in TF1 cells
We constructed SIN-lentiviral vectors coexpressing both enhanced green fluorescent protein (EGFP) and 4 independent shRNAs targeting the human ALAS2 gene (Gene OMIM #301300) and the PBGD gene (Gene OMIM #609806) from the polymerase III H1 promoter, as previously described (targeted sequence supplied in supplemental Table 1).24,25 Production and infectious titering of VSV-G pseudotyped SIN-lentiviral vectors were performed as previously described.25
Erythroid differentiation of TF1 cells and treatment with DEF
Erythroleukemic TF1 cells (Sigma-Aldrich) were maintained in RPMI 1640 culture medium supplemented with granulocyte-macrophage colony-stimulating factor (2 ng/mL). We induced erythroid differentiation of TF1 cells in the presence of erythropoietin (5 IU/mL) and human Holo-transferrin (500 µg/mL; Sigma-Aldrich) for 48 to 72 hours. DEF (3-hydroxy-1,2-dimethyl-4(1H)-pyridone; Sigma-Aldrich) was added to the erythroid culture medium at various doses (10, 20, 50, 100, 200, or 500 μM) for 48 hours.
Reverse transcription–PCR analysis
Real-time reverse transcription–PCR assay was used to quantify human ALAS1, ALAS2, and PBGD messenger RNA (mRNA) in human cells. The relative expression was normalized to endogenous HuP0 (primer sequences are supplied in supplemental Table 1).
Western blot analysis
For western blot analysis, equal amounts of protein were separated by sodium dodecyl sulfate/polyacrylamide gel electrophoresis, transferred onto polyvinylidene fluoride membranes, and probed with rabbit polyclonal anti-ALAS2 (Sigma-Aldrich; SAB2100095), anti-IRP1 (Sigma-Aldrich; HPA019371), anti-IRP2 (Millipore; 3146274), and rabbit monoclonal anti–glyceraldehyde-3-phosphate dehydrogenase (GAPDH; Cell Signaling, 14C10). We revealed the signal with horseradish peroxidase–linked secondary antibody and visualized it using the enhanced chemiluminescence kit (Amersham), according to the manufacturer’s instructions.
CEP mouse model and iron chelation in vivo
We maintained CEP knock-in mice (UrosP248Q/P248Q) in the animal facility of the University of Bordeaux.26 All experimental procedures involving animals were approved by the Institutional Animal Care and Use Committee of Bordeaux University and complied with the French and European regulations on Animal Welfare and Public Health Service. Mice (age 6-10 weeks) were fed a standard diet (D113; SAFE) containing 270 mg Fe/kg, and given the iron chelator DEF in their drinking water (1 or 3 mg/mL) ad libitum for 26 consecutive weeks.
Flow cytometry.
Porphyrin-accumulating cells were analyzed at 550 nm emission wavelength with a 405 nm excitation laser on a FACS flow cytometer (BD FACSCanto II). We used anti-CD235 (glycophorin A)-FITC (BioLegend clone HI264), anti–CD71-APC (BioLegend clone CY-164), and anti–CD36-APC (BioLegend clone 5-271) antibodies to assess erythroid differentiation (day 17) of wild-type (WT) and CEP CD34+-derived cells by flow cytometry analysis (BD Accuri C6).
Biochemical and hematologic measurements.
Urinary porphyrins were separated by reverse-phase high-performance liquid chromatography associated with fluorimetric detection, and UROS enzymatic activity was determined by using an enzyme-coupled assay as previously described.24,26 Intracellular and culture medium porphyrin contents were determined after extraction with methanol/perchloric acid 1 M (30/70 vol/vol) and quantified by spectrofluorometry (Hitachi F-4500 fluorescence spectrophotometer) using commercially available calibrators (ClinCal Urine Calibrator Recipe).6 The orbital sinus vein was punctured under anesthesia to collect blood samples in heparin and EDTA-coated microcapillary collection tubes. Total hemoglobin, hematocrit, mean corpuscular volume, mean corpuscular hemoglobin, mean corpuscular hemoglobin concentration, RBC count, and platelet counts were measured with a scil Vet abc animal blood counter (scil animal care company GmbH) using mouse settings. We measured biochemical plasmatic parameters on a multiparametric Olympus AU400 analyzer.
Skin photosensitivity assay.
Reversal of skin photosensitivity was assayed as previously described.6,12
Histologic analysis.
The mice were euthanized after 26 weeks of treatment with DEF, and the liver, spleen, and kidneys were examined. After formaldehyde fixation and paraffin embedding, staining with hematein-eosin-safran and Perls (iron staining) was performed. Histologic section slides were analyzed with a Nikon Eclipse Ni microscope (×20; scale bar, 100 μM). Pictures were captured by using a digital camera (Nikon DS Ri2) and analyzed with NIS Elements AR software.
Statistical analyses.
Nonparametric Mann-Whitney U tests were used to fit the small sample sizes. Statistical significance was set as described in the figure legends.
Results
PBGD and ALAS2 inhibition reduces porphyrin accumulation in CRISPR/Cas9–engineered UROS-deficient erythroid cells
We developed novel UROS-deficient cellular models using CRISPR/Cas9–mediated genomic engineering of UROS exons 4 and 10 in TF1 human erythroid cell lines (named TF1-UROSE4i and TF1-UROSE10i, respectively) (supplemental Figure 1). To inhibit PBGD and ALAS2 expression, we designed a lentiviral vector coexpressing both EGFP and shRNA specifically targeting either the ALAS2 (shALAS2 #1 to 4) or PBGD (shPBGD #1 to 4) genes. To analyze the effects of ALAS2 and PBGD inhibition on porphyrin production, we transduced TF1-UROSWT, TF1-UROSE4i, and TF1-UROSE10i cells with shRNA-lentiviral vectors at a multiplicity of infection of 5. Efficient gene transfer (>90% EGFP+ cells) was obtained, and a significant reduction of porphyrin-specific fluorescence was observed in transduced cells (supplemental Figure 2). Five days after transduction, we induced erythroid differentiation for 3 days, measured mRNA and protein levels of ALAS2 and PBGD, and performed intracellular porphyrin quantification. An efficient and specific silencing of ALAS2 (35 ± 7% to 90 ± 3% decrease vs NT) and PBGD (0 ± 20% to 95 ± 2% decrease vs NT) mRNA was observed by using reverse transcription–PCR analysis without modification of ALAS1 expression, confirming the specific targeting of the erythroid ALAS gene in transduced TF1-UROSWT, TF1-UROSE4i, and TF1-UROSE10i (Figure 1A). Western blot analysis of ALAS2 and PBGD expression confirmed the inhibition at the protein level in transduced TF1-UROSWT, TF1-UROSE4i, and TF1-UROSE10i (Figure 1B). We then investigated the consequences of ALAS2 and PBGD inhibition on porphyrin accumulation. Porphyrin overload was significantly reduced (maximum 90 ± 3% decrease vs nontransduced) in transduced TF1-UROSE4i and TF1-UROSE10i (Figure 1C). These results show that the modulation of ALAS2 and PBGD enzyme expression can efficiently reduce porphyrin accumulation in UROS-deficient cells. Interestingly, porphyrin accumulation correlated with ALAS2 expression, whereas the relationship with PBGD expression varied in a hyperbolic manner. These findings suggest that the PBGD enzyme is not a limiting factor to maintain heme synthesis in erythroid cells (Figure 1D).

shRNA-mediated PBGD and ALAS2 silencing reduces porphyrin accumulation in UROS-deficient erythroid TF1 cells. WT and CRISPR/Cas9–engineered UROS-deficient (UROSE4i and UROSE10i) TF1 cells were transduced with 4 different lentiviral vectors coexpressing EGFP and shRNA-targeted to DsRed (control), ALAS2 (#1-4), or PBGD (#1-4) genes. Cells were transduced at a multiplicity of infection of 5, enabling a high transduction efficiency (>90%) as determined by flow cytometry analysis of EGFP expression (supplemental Figure 2). (A) Real-time semi-quantitative reverse transcription–PCR analysis of ALAS1, ALAS2, and PBGD mRNA expression. The relative gene expression was normalized with the ribosomal protein P0 gene and expressed as a ratio vs untransduced control cells (NT) for each condition. (B) Western blot analysis of ALAS2, PBGD, and GAPDH proteins in TF1-UROSE4i and TF1-UROSE10i cells. The signal density was determined by using ImageJ software (National Institutes of Health) to perform semi-quantitative analysis of protein expression. Semi-quantitative results are expressed as a ratio vs GAPDH expression. (C) Analysis of porphyrin accumulation in TF1-UROSWT and TF1-UROSE4i or TF1-UROSE10i cells. Total porphyrins were extracted from cell lysates and quantified by spectrofluorometry using commercially available calibrators. (D) Relationship between porphyrin accumulation and ALAS2 or PBGD expression. The regression curves fitted to the data were determined by using Prism software (GraphPad Software). All the results are mean ± SD of 4 different experiments. *P < .05 vs NT. ND, not detectable; NT, nontransduced.
shRNA-mediated PBGD and ALAS2 silencing reduces porphyrin accumulation in UROS-deficient erythroid TF1 cells. WT and CRISPR/Cas9–engineered UROS-deficient (UROSE4i and UROSE10i) TF1 cells were transduced with 4 different lentiviral vectors coexpressing EGFP and shRNA-targeted to DsRed (control), ALAS2 (#1-4), or PBGD (#1-4) genes. Cells were transduced at a multiplicity of infection of 5, enabling a high transduction efficiency (>90%) as determined by flow cytometry analysis of EGFP expression (supplemental Figure 2). (A) Real-time semi-quantitative reverse transcription–PCR analysis of ALAS1, ALAS2, and PBGD mRNA expression. The relative gene expression was normalized with the ribosomal protein P0 gene and expressed as a ratio vs untransduced control cells (NT) for each condition. (B) Western blot analysis of ALAS2, PBGD, and GAPDH proteins in TF1-UROSE4i and TF1-UROSE10i cells. The signal density was determined by using ImageJ software (National Institutes of Health) to perform semi-quantitative analysis of protein expression. Semi-quantitative results are expressed as a ratio vs GAPDH expression. (C) Analysis of porphyrin accumulation in TF1-UROSWT and TF1-UROSE4i or TF1-UROSE10i cells. Total porphyrins were extracted from cell lysates and quantified by spectrofluorometry using commercially available calibrators. (D) Relationship between porphyrin accumulation and ALAS2 or PBGD expression. The regression curves fitted to the data were determined by using Prism software (GraphPad Software). All the results are mean ± SD of 4 different experiments. *P < .05 vs NT. ND, not detectable; NT, nontransduced.
Iron depletion reduces ALAS2 expression and porphyrin accumulation in UROS-deficient erythroid cells
Given the posttranscriptional regulation of ALAS2 expression by iron availability, we then evaluated the effect of iron restriction on ALAS2 expression and porphyrin accumulation in different cellular models of CEP. DEF (Ferriprox; Apotex, Inc.) is a clinically available oral iron chelator used to reduce iron overload in major transfusion-dependent thalassemia.27 First, we analyzed porphyrin accumulation in TF1-UROSWT, TF1-UROSE4i, and TF1-UROSE10i cells after incubation with increasing doses (10 to 500 μM) of DEF. We observed a dose-dependent drop in porphyrin production (up to 90 ± 7% vs NT) in UROS-deficient TF1 cells after incubation with DEF (Figure 2A). Due to a significant cellular toxicity observed at 500 μM in the culture medium, we analyzed expression of ALAS2 and two other iron-related proteins (IRP1 and IRP2) in TF1 cells treated with a nontoxic dose of DEF (200 μM). As expected, we observed no transcriptional inhibition of ALAS1 and ALAS2 expression after treatment with DEF, whereas ALAS2 protein significantly decreased (Figure 2B-C). The ALAS2 transcript contains a 5′IRE that interacts with iron regulatory proteins (IRP1-IRP2) under conditions of iron deficiency; IRPs binding to the 5′IRE inhibit ALAS2 mRNA translation. The significant increase in IRP2 but not in IRP1 protein expression after treatment with DEF may be explained by the dual regulatory mechanisms of IRP1 and IRP2 activity. The IRE-binding activity of IRP1 is controlled by iron-sulfur cluster assembly, whereas that of IRP2 is controlled by oxidation followed by ubiquitination and proteasome degradation, which is dependent on iron and heme levels.15,28

Iron restriction with DEF inhibits ALAS2 expression and reduces porphyrin accumulation in UROS-deficient TF1 and erythroid cells from a patient with CEP. Panels A-C represent experiments performed on TF1-UROSWT, TF1-UROSE4i, and TF1-UROSE10i induced to erythroid differentiation. (A) Porphyrin accumulation after treatment at various doses of DEF (10, 20, 50, 100, 200, or 500 μM) for 48 hours. (B) Real-time quantitative analysis of ALAS1 and ALAS2 mRNA after treatment with DEF 200 μM for 48 hours. The relative gene expression was normalized with the ribosomal protein P0 gene and expressed as ratio vs untreated control for each condition. This dose allows the efficient reduction of porphyrin accumulation without cellular toxicity on TF1 cells. (C) Western blot analysis of ALAS2, IRP1, IRP2, and GAPDH proteins after treatment with DEF 200 μM for 48 hours. Iron exerts a posttranscriptional regulation of ALAS2 and IRP2 expression: in the presence of iron, ALAS2 mRNA is translated while IRP2 protein is degraded by ubiquitination. Iron restriction represses ALAS2 and induces IRP2 expression in WT and UROS-deficient TF1 cells. Iron modulates the activity of IRP1 without changing the expression level of the protein. Panels D-G represent experiments performed on the erythroid progeny of CD34+ cells. Control (cord blood) and UROS-deficient (steady-state peripheral blood from a patient with CEP) CD34+ cells were amplified and subjected to erythroid differentiation in a 3-step protocol over 17 days. (D) The erythroid maturation was analyzed on day 17 by flow cytometry analysis of glycophorin A (FITC), CD36 (APC), and CD71 (APC) expression. Most control and CEP cells had matured fully from stage I to stage III/IV (defined by the sequential gain of CD36 and then GlyA expression and the subsequent loss of CD36 expression) by day 17. (E) Porphyrin accumulation in CD34+-derived erythroid cells (normal and CEP) after treatment with DEF (200 μM) for 48 hours (days 15-17). (F) Real-time semi-quantitative analysis of ALAS2 mRNA in the erythroid progeny of normal and CEP CD34+ cells after treatment with DEF (200 μM) for 48 hours (days 15-17). The relative gene expression was normalized with the ribosomal protein P0 gene and expressed as ratio vs untreated control for each condition. (G) Western blot analysis of ALAS2 and GAPDH proteins in the erythroid progeny of normal cells and CEP CD34+ cells after treatment with DEF (200 μM) for 48 hours (days 15-17). The combination of both UROS deficiency and iron restriction (low ferrochelatase activity) probably affects global heme production and stimulates ALAS2 transcription in UROS-deficient cells. Signal density on western blots was determined by using ImageJ software to perform semi-quantitative analysis of protein expression. Semi-quantitative results are expressed as a ratio vs GAPDH expression. *P < .05 with vs without DEF.
Iron restriction with DEF inhibits ALAS2 expression and reduces porphyrin accumulation in UROS-deficient TF1 and erythroid cells from a patient with CEP. Panels A-C represent experiments performed on TF1-UROSWT, TF1-UROSE4i, and TF1-UROSE10i induced to erythroid differentiation. (A) Porphyrin accumulation after treatment at various doses of DEF (10, 20, 50, 100, 200, or 500 μM) for 48 hours. (B) Real-time quantitative analysis of ALAS1 and ALAS2 mRNA after treatment with DEF 200 μM for 48 hours. The relative gene expression was normalized with the ribosomal protein P0 gene and expressed as ratio vs untreated control for each condition. This dose allows the efficient reduction of porphyrin accumulation without cellular toxicity on TF1 cells. (C) Western blot analysis of ALAS2, IRP1, IRP2, and GAPDH proteins after treatment with DEF 200 μM for 48 hours. Iron exerts a posttranscriptional regulation of ALAS2 and IRP2 expression: in the presence of iron, ALAS2 mRNA is translated while IRP2 protein is degraded by ubiquitination. Iron restriction represses ALAS2 and induces IRP2 expression in WT and UROS-deficient TF1 cells. Iron modulates the activity of IRP1 without changing the expression level of the protein. Panels D-G represent experiments performed on the erythroid progeny of CD34+ cells. Control (cord blood) and UROS-deficient (steady-state peripheral blood from a patient with CEP) CD34+ cells were amplified and subjected to erythroid differentiation in a 3-step protocol over 17 days. (D) The erythroid maturation was analyzed on day 17 by flow cytometry analysis of glycophorin A (FITC), CD36 (APC), and CD71 (APC) expression. Most control and CEP cells had matured fully from stage I to stage III/IV (defined by the sequential gain of CD36 and then GlyA expression and the subsequent loss of CD36 expression) by day 17. (E) Porphyrin accumulation in CD34+-derived erythroid cells (normal and CEP) after treatment with DEF (200 μM) for 48 hours (days 15-17). (F) Real-time semi-quantitative analysis of ALAS2 mRNA in the erythroid progeny of normal and CEP CD34+ cells after treatment with DEF (200 μM) for 48 hours (days 15-17). The relative gene expression was normalized with the ribosomal protein P0 gene and expressed as ratio vs untreated control for each condition. (G) Western blot analysis of ALAS2 and GAPDH proteins in the erythroid progeny of normal cells and CEP CD34+ cells after treatment with DEF (200 μM) for 48 hours (days 15-17). The combination of both UROS deficiency and iron restriction (low ferrochelatase activity) probably affects global heme production and stimulates ALAS2 transcription in UROS-deficient cells. Signal density on western blots was determined by using ImageJ software to perform semi-quantitative analysis of protein expression. Semi-quantitative results are expressed as a ratio vs GAPDH expression. *P < .05 with vs without DEF.
We then evaluated the effect of iron chelation on the erythroid progeny of CD34+ cells from a patient with CEP (peripheral blood) and a normal donor (cord blood) after culturing under conditions optimized for erythroid differentiation.23 Both CEP and normal erythroid cells matured fully, as determined by their sequential expression of CD36, CD71, and glycophorin A. At day 17 of erythroid culture, most cells reached level III/IV of erythroid differentiation (96% CD71+/GlyA+ and 84% CD36+/GlyA+ for normal cells and 83% CD71+/GlyA+ and 71% CD36+/GlyA+ for CEP) (Figure 2D). To determine the effect of iron restriction on porphyrin accumulation, normal and CEP erythroid cells were cultured in the presence of DEF 200 μM (from day 15 to day 17). As expected, porphyrin accumulation significantly increased in CEP compared with normal cells and decreased after treatment with DEF (Figure 2E). Interestingly, as observed in the UROS-deficient TF1 cells (supplemental Figure 1), ALAS2 expression was stimulated in CEP primary erythroid cells compared with normal cells (Figure 2F-G). Furthermore, iron restriction decreased the ALAS2 mRNA translation responsible for the metabolic correction observed in normal and CEP primary erythroid cells. These results confirmed that iron restriction modulates ALAS2 expression through an iron-dependent posttranscriptional mechanism, leading to a significant decrease in porphyrin production in primary UROS-deficient erythroid cells.
Iron chelation significantly decreases porphyrin accumulation and reverses skin photosensitivity in CEP mice
We next tested an in vivo iron chelation therapy in CEP mice. Two doses of DEF were administered to WT and CEP mice in their drinking water (1 mg/mL or 3 mg/mL) for 26 weeks (Figure 3A). Porphyrin accumulation leads to spontaneous red fluorescence of erythrocytes (ie, fluorocytes), which was monitored by flow cytometry analysis. Porphyrin accumulation decreased progressively in peripheral RBCs upon treatment with DEF, as determined by the fluorocyte count over time. Porphyrin content in bone marrow cells and peripheral RBCs decreased by 41% and 54%, respectively, in CEP mice treated with DEF 1 mg/mL, and by 66% and 62% after treatment with DEF 3 mg/mL compared with untreated CEP mice (Figure 3B). Urinary excretion of uroporphyrin I and coproporphyrin I isomers is a hallmark of CEP. Urinary porphyrins decreased by 51% and 75% in CEP mice treated with DEF 1 mg/mL and 3 mg/mL compared with untreated CEP mice (Figure 3C). No modification of porphyrin content was observed in RBCs and urine of WT mice treated with DEF. The combination of both UROS deficiency and iron chelation may limit heme production and exacerbate hepatic porphyrin accumulation due to the negative feedback regulation of ALAS1 by an uncommitted heme pool, inducing liver injury. We found that hepatic porphyrin levels decreased without inducing hepatic cytolysis in CEP mice treated by DEF (Figure 3D, Table 1). Skin photosensitivity was evaluated in CEP and WT mice after UVA light exposure (8 J/cm2) as previously described.6,12 The severity of skin lesions correlated with porphyrin accumulation in peripheral blood RBCs and decreased significantly in CEP mice treated with DEF (Figure 3E-F). Moreover, most CEP mice treated with the highest dose of DEF (3 mg/mL) were completely free of macroscopic skin lesions. Histologic analyses of liver and spleen revealed that CEP mice exhibited brown porphyrin pigment deposits, which were less numerous after treatment with DEF (Figure 3G). These results show that iron chelation therapy efficiently decreases porphyrin accumulation and excretion in vivo in a murine model of CEP.
![In vivo iron chelation reduces porphyrin overload and prevents skin photosensitivity in CEP mice. (A) Percentage of RBCs accumulating porphyrins (fluorocyte count) in the peripheral blood of WT and CEP mice treated with DEF 1 or 3 mg/mL in drinking water for 26 consecutive weeks (n = mice number in each group). (B) Porphyrin content in RBCs and bone marrow (BM) cells. Results are expressed as mean ± SD of individual mice (□) in each group. (C) Urinary porphyrin content (uroporphyrin [Uro] isomer I + III, heptacarboxyl porphyrin [Hepta], hexacarboxyl porphyrin [Hexa], pentacarboxyl porphyrin [Penta], and coproporphyrin isomer I [Copro I] or III [Copro III]). Results are expressed as mean ± SD of individual mice with respective contribution of each porphyrin (□). (D) Hepatic porphyrin content. Results are expressed as mean ± SD of individual mice (□). (E) Percentage of fluorocytes in WT and CEP mice treated with DEF 1 or 3 mg/mL on euthanasia (26 weeks). Circles represent individual mice and skin photosensitivity (severe, mild, moderate, and absent). (F) To evaluate skin photosensitivity, mice were depilated and exposed to UVA irradiation (8 J/cm2). We evaluated the severity of skin photosensitivity 5 days after irradiation, and representative macroscopic pictures of dorsal skin are shown. (G) Representative liver and spleen histologic sections from WT, CEP, and CEP mice treated with DEF 3 mg/mL at euthanasia (26 weeks). Sections were stained with hematoxylin/eosin for structural analysis. We observed many porphyrin deposits (brown pigments, black arrow) and clusters of erythroblasts (white arrow) in control CEP mice compared with WT or CEP treated with DEF 3 mg/mL. Histologic sections were analyzed with a Nikon Eclipse Ni microscope (×20). Scale bar, 100 μM. Pictures were captured by using a digital camera (Nikon DS Ri2) and analyzed with NIS Elements AR software. *P < .05 vs untreated CEP mice; §P < .05 vs CEP mice treated with DEF (1 mg/mL).](https://ash.silverchair-cdn.com/ash/content_public/journal/blood/136/21/10.1182_blood.2020006037/2/m_bloodbld2020006037f3.png?Expires=1767718017&Signature=f7AvLPvgKTbZHP9rDjSMWDg2BFN-egXp3XJVOWvwf13mTMCV0booWB1oFMxmk~9PyfUV5l4Vg6lvS1XnOX24Sry67-D3rMAE4qXZz8TGMrAb5EcJyH1iMrvgr9OxIJ513DhD0GW9Npsd4UAjOgAJpTxGjVQKOYVu1o2oCjsFVexIL-4eJ3tz5AEDB6qPBw7lDlSKDLlghCG5ZPZNuQu8fJ0A3bfYIdKgw~XfPej4N~a0KR2kBZXX14XKHMhpJ9DnXzeHkSNPVT5kmedrExjmDz43wjiqu-xhvt72u903cRboBisIBSQwaxIEc6Y46XcsuhgPMAG3bsgB0EXkDTzU6g__&Key-Pair-Id=APKAIE5G5CRDK6RD3PGA)
In vivo iron chelation reduces porphyrin overload and prevents skin photosensitivity in CEP mice. (A) Percentage of RBCs accumulating porphyrins (fluorocyte count) in the peripheral blood of WT and CEP mice treated with DEF 1 or 3 mg/mL in drinking water for 26 consecutive weeks (n = mice number in each group). (B) Porphyrin content in RBCs and bone marrow (BM) cells. Results are expressed as mean ± SD of individual mice (□) in each group. (C) Urinary porphyrin content (uroporphyrin [Uro] isomer I + III, heptacarboxyl porphyrin [Hepta], hexacarboxyl porphyrin [Hexa], pentacarboxyl porphyrin [Penta], and coproporphyrin isomer I [Copro I] or III [Copro III]). Results are expressed as mean ± SD of individual mice with respective contribution of each porphyrin (□). (D) Hepatic porphyrin content. Results are expressed as mean ± SD of individual mice (□). (E) Percentage of fluorocytes in WT and CEP mice treated with DEF 1 or 3 mg/mL on euthanasia (26 weeks). Circles represent individual mice and skin photosensitivity (severe, mild, moderate, and absent). (F) To evaluate skin photosensitivity, mice were depilated and exposed to UVA irradiation (8 J/cm2). We evaluated the severity of skin photosensitivity 5 days after irradiation, and representative macroscopic pictures of dorsal skin are shown. (G) Representative liver and spleen histologic sections from WT, CEP, and CEP mice treated with DEF 3 mg/mL at euthanasia (26 weeks). Sections were stained with hematoxylin/eosin for structural analysis. We observed many porphyrin deposits (brown pigments, black arrow) and clusters of erythroblasts (white arrow) in control CEP mice compared with WT or CEP treated with DEF 3 mg/mL. Histologic sections were analyzed with a Nikon Eclipse Ni microscope (×20). Scale bar, 100 μM. Pictures were captured by using a digital camera (Nikon DS Ri2) and analyzed with NIS Elements AR software. *P < .05 vs untreated CEP mice; §P < .05 vs CEP mice treated with DEF (1 mg/mL).
In vivo iron chelation reduces porphyrin overload and prevents skin photosensitivity in CEP mice. (A) Percentage of RBCs accumulating porphyrins (fluorocyte count) in the peripheral blood of WT and CEP mice treated with DEF 1 or 3 mg/mL in drinking water for 26 consecutive weeks (n = mice number in each group). (B) Porphyrin content in RBCs and bone marrow (BM) cells. Results are expressed as mean ± SD of individual mice (□) in each group. (C) Urinary porphyrin content (uroporphyrin [Uro] isomer I + III, heptacarboxyl porphyrin [Hepta], hexacarboxyl porphyrin [Hexa], pentacarboxyl porphyrin [Penta], and coproporphyrin isomer I [Copro I] or III [Copro III]). Results are expressed as mean ± SD of individual mice with respective contribution of each porphyrin (□). (D) Hepatic porphyrin content. Results are expressed as mean ± SD of individual mice (□). (E) Percentage of fluorocytes in WT and CEP mice treated with DEF 1 or 3 mg/mL on euthanasia (26 weeks). Circles represent individual mice and skin photosensitivity (severe, mild, moderate, and absent). (F) To evaluate skin photosensitivity, mice were depilated and exposed to UVA irradiation (8 J/cm2). We evaluated the severity of skin photosensitivity 5 days after irradiation, and representative macroscopic pictures of dorsal skin are shown. (G) Representative liver and spleen histologic sections from WT, CEP, and CEP mice treated with DEF 3 mg/mL at euthanasia (26 weeks). Sections were stained with hematoxylin/eosin for structural analysis. We observed many porphyrin deposits (brown pigments, black arrow) and clusters of erythroblasts (white arrow) in control CEP mice compared with WT or CEP treated with DEF 3 mg/mL. Histologic sections were analyzed with a Nikon Eclipse Ni microscope (×20). Scale bar, 100 μM. Pictures were captured by using a digital camera (Nikon DS Ri2) and analyzed with NIS Elements AR software. *P < .05 vs untreated CEP mice; §P < .05 vs CEP mice treated with DEF (1 mg/mL).
Biochemical and hematologic parameters in WT and CEP mice treated with DEF 1 or 3 mg/mL
| Variable | WT | CEP | WT DEF 1 mg/mL | CEP DEF 1 mg/mL | WT DEF 3 mg/mL | CEP DEF 3 mg/mL |
|---|---|---|---|---|---|---|
| Creatinine, µmol/L | 35.5 ± 8.4 | 34.7 ± 3.4 | 41.2 ± 1.8 | 41.3 ± 4.5 | 42.8 ± 5.1 | 39.9 ± 3.9 |
| NS vs WT | NS vs CEP | NS vs WT | NS vs CEP | |||
| Urea, mmol/L | 10.3 ± 2.6 | 22.8 ± 6.9 | 11.2 ± 1.3 | 23.4 ± 9.1 | 12.1 ± 2 | 16.7 ± 4.5 |
| P < .01 vs WT | NS vs WT | P < .001 vs CEP | NS vs WT | NS vs CEP | ||
| ALT, IU/L | 60.6 ± 30.8 | 83.8 ± 12.5 | 65.7 ± 31.1 | 90.9 ± 24.8 | 61.4 ± 18.3 | 68.1 ± 7.6 |
| NS vs WT | NS vs CEP | NS vs WT | NS vs CEP | |||
| AST, IU/L | 133 ± 107 | 468 ± 111 | 214 ± 157 | 507 ± 138 | 165 ± 90 | 226 ± 31 |
| P < .0001 vs WT | NS vs WT | P < .0001 vs WT | NS vs WT | P < .01 vs WT | ||
| NS vs CEP | P < .01 vs CEP | |||||
| P < .001 vs CEP DEF 1 mg/mL | ||||||
| Bilirubin, µmol/L | 1.3 ± 0.5 | 6.8 ± 1.6 | 0.7 ± 0.7 | 5.7 ± 3.3P < .001 vs WT | 1.3 ± 0.4 | 6.5 ± 1.4 |
| P < .0001 vs WT | NS vs WT | NS vs CEP | NS vs WT | P < .0001 vs WT | ||
| NS vs CEP | ||||||
| LDH, IU/L | 640 ± 351 | 7403 ± 1807 | 1155 ± 633 | 5964 ± 2437 | 753 ± 525 | 3159 ± 1794 |
| P < .0001 vs WT | NS vs WT | P < .0001 vs WT | NS vs WT | P < .05 vs WT | ||
| NS vs CEP | P < .001 vs CEP | |||||
| P < .05 vs CEP DEF1 | ||||||
| RBC, 1012/L | 10.8 ± 0.9 | 6.1 ± 1.3 | 10.3 ± 1.2 | 7.0 ± 1.7 | 10.7 ± 1.3 | 10.5 ± 1.5 |
| P < .0001 vs WT | NS vs WT | P < .0001 vs WT | NS vs WT | NS vs WT | ||
| NS vs CEP | P < .001 vs CEP | |||||
| P < .01 vs CEP DEF 1 mg/mL | ||||||
| Hemoglobin, g/dL | 17.0 ± 1.5 | 8.9 ± 1.2 | 16.0 ± 1.6 | 9.6 ± 2.2 | 17.3 ± 2.2 | 13.7 ± 1.8 |
| P < .0001 vs WT | NS vs WT | P < .0001 vs WT | NS vs WT | P < .01 vs WT | ||
| NS vs CEP | P < .001 vs CEP | |||||
| P < .01 vs CEP DEF 1 mg/mL | ||||||
| Hematocrit, % | 58.9 ± 4.3 | 33.5 ± 5.3 | 57.5 ± 7.3 | 36.1 ± 9.1 | 57.9 ± 7.9 | 50.8 ± 7.2 |
| P < .0001 vs WT | NS vs WT | P < .0001 vs WT | NS vs WT | NS vs WT | ||
| NS vs CEP | P < .001 vs CEP | |||||
| P < .01 vs CEP DEF 1 mg/mL | ||||||
| MCV, fL | 54.9 ± 2.0 | 55.4 ± 4.0 | 55.8 ± 0.8 | 51.4 ± 2.4 | 54.2 ± 0.8 | 48.6 ± 2.6 |
| NS vs CEP | NS vs WT | P < .05 vs CEP | NS vs WT | P < .0001 vs CEP | ||
| MCH, pg | 15.8 ± 0.8 | 15.1 ± 1.2 | 15.6 ± 0.4 | 13.8 ± 0.8 | 16.4 ± 0.4 | 13.2 ± 0.7 |
| NS vs CEP | NS vs WT | P < .001 vs WT | NS vs WT | P < .0001 vs WT | ||
| P < .05 vs CEP | P < .001 vs CEP | |||||
| MCHC, g/dL | 28.8 ± 0.9 | 27.2 ± 0.8 | 28 ± 0.9 | 26.3 ± 1.1 | 29.8 ± 0.5 | 27 ± 0.7 |
| P < .05 vs WT | NS vs WT | P < .0001 vs WT | NS vs WT | P < .01 vs WT | ||
| Platelets, 109/L | 1161 ± 127 | 1990 ± 188 | 1147 ± 231 | 1732 ± 329 | 1051 ± 321 | 1604 ± 254 |
| P < .0001 vs WT | NS vs WT | P < .01 vs WT | NS vs WT | P < .05 vs WT | ||
| Liver/body weight, % | 5.3 ± 0.7 | 6.9 ± 0.8 | 5.5 ± 0.2 | 6.7 ± 0.5 | 5.0 ± 0.5 | 6.2 ± 0.7 |
| P < .001 vs WT | NS vs WT | P < .01 vs WT | NS vs WT | NS vs WT | ||
| Spleen/body weight, % | 0.46 ± 0.13 | 4.51 ± 0.59 | 0.41 ± 0.03 | 3.98 ± 0.62 | 0.48 ± 0.14 | 3.52 ± 0.39 |
| P < .0001 vs WT | NS vs WT | P < .0001 vs WT | NS vs WT | P < .0001 vs WT | ||
| P < .001 vs CEP |
ALT, alanine aminotransferase; AST, aspartate aminotransferase; LDH, lactate dehydrogenase; MCH, mean corpuscular hemoglobin; MCHC, mean corpuscular hemoglobin concentration; MCV, mean corpuscular volume; NS, not significant.
Iron chelation rescues hemolytic anemia and improves iron overload in CEP mice
We also investigated the impact of long-term iron chelation therapy on erythropoiesis, chronic hemolytic anemia, and iron overload in CEP mice. CEP mice present features of chronic hemolysis (increased lactate dehydrogenase [LDH], aspartate transaminase [AST], and bilirubin) and decreased hemoglobin, hematocrit, RBC count, and splenomegaly (Table 1). Anemia improved significantly in CEP mice treated with DEF, as shown by the increase in hemoglobin (gain of up to 5 g/dL in mice exposed to DEF 3 mg/mL), hematocrit, and RBC counts. As described previously, enlarged red pulp and secondary clusters of erythroid cells due to highly active erythropoiesis were observed in CEP mice.26 Erythroid clusters were much less numerous in both the liver and spleen of CEP mice treated with DEF, suggesting that erythroid activity had returned to basal levels (Figure 3G). These results may be due to reduced porphyrin content in RBCs leading to a significant limitation of hemolysis, as suggested by the decreased LDH and AST enzymes in CEP mice upon treatment with DEF. Although anemia improved upon iron chelation, RBCs tended to microcytosis and hypochromia in CEP mice but not in WT mice treated with DEF. This result may be due to the heme synthesis defect in the erythroid lineage as a result of combined UROS and iron functional deficiency. CEP mice exhibited an iron disorder different from that of the iron-loading anemia associated with ineffective erythropoiesis.29,30 There was an iron overload in liver, spleen macrophages, and renal proximal tubules as well as an elevation of iron, transferrin, and ferritin in plasma. Conversely, transferrin saturation was normal both in CEP mice and WT mice (Figure 4). Although tissue iron deposition and ferritin levels decreased in CEP mice treated with DEF (3 mg/mL), there was no significant reduction in functional iron bioavailability upon iron chelation. The long-term administration of DEF over 26 weeks induced no major hepatic or renal toxicity as indicated by biochemical parameters (creatinine, urea, alanine aminotransferase, AST, and total bilirubin) at euthanasia in treated WT and CEP mice vs control mice.
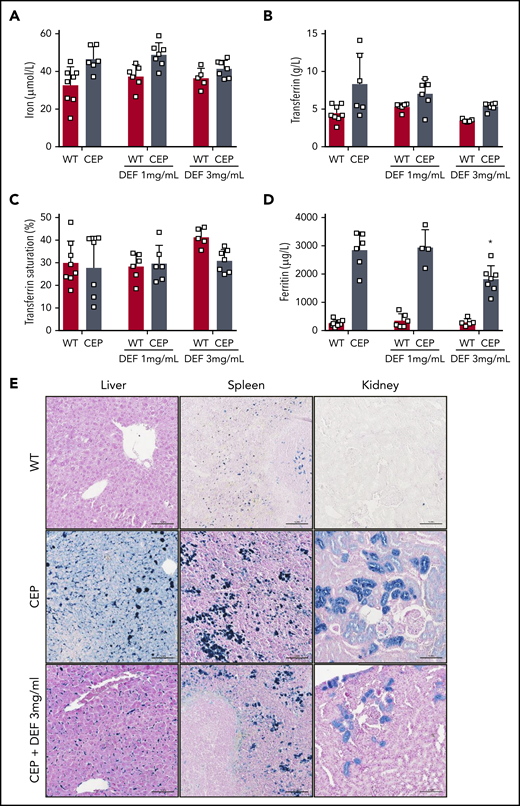
Iron overload improved upon treatment with iron chelator in CEP mice. Plasma iron (A), transferrin (B), transferrin saturation (%) (C), and ferritin (D) were determined in WT and CEP mice treated with DEF 1 or 3 mg/mL on euthanasia (26 weeks) using a multiparametric Olympus AU400 analyzer. (□) Individual mice. (E) Representative Perls staining of liver, spleen and kidney histologic sections from WT, CEP, and CEP mice treated with DEF 3 mg/mL at euthanasia (26 weeks). Many iron deposits (blue staining) were visible in liver macrophages, spleen tissue, and proximal convoluted tubules of the kidney cortex in control CEP mice compared with WT or CEP mice treated with DEF 3 mg/mL. Histologic sections were analyzed with a Nikon Eclipse Ni microscope (×20). Scale bar, 100 μM. Pictures were captured by using a digital camera (Nikon DS Ri2) and analyzed with NIS Elements AR software.
Iron overload improved upon treatment with iron chelator in CEP mice. Plasma iron (A), transferrin (B), transferrin saturation (%) (C), and ferritin (D) were determined in WT and CEP mice treated with DEF 1 or 3 mg/mL on euthanasia (26 weeks) using a multiparametric Olympus AU400 analyzer. (□) Individual mice. (E) Representative Perls staining of liver, spleen and kidney histologic sections from WT, CEP, and CEP mice treated with DEF 3 mg/mL at euthanasia (26 weeks). Many iron deposits (blue staining) were visible in liver macrophages, spleen tissue, and proximal convoluted tubules of the kidney cortex in control CEP mice compared with WT or CEP mice treated with DEF 3 mg/mL. Histologic sections were analyzed with a Nikon Eclipse Ni microscope (×20). Scale bar, 100 μM. Pictures were captured by using a digital camera (Nikon DS Ri2) and analyzed with NIS Elements AR software.
Discussion
CEP is an inborn metabolic disease resulting from deficient uroporphyrinogen III synthase activity and leading to the toxic accumulation of porphyrins, which are intermediate metabolites of the heme biosynthesis pathway. Because the degree of porphyrin excess correlates with the severity of CEP, we evaluated a substrate reduction therapy by inhibiting the regulatory enzymes of the heme biosynthetic pathway. ALAS2 is the first and rate-limiting enzyme of the metabolic pathway, and PBGD catalyzes the stage before UROS.
We found that ALAS2 and PBGD inhibition by RNA interference efficiently reduces porphyrin accumulation in UROS-deficient erythroid cell lines. We show here that the PBGD enzyme is not a limiting factor of heme synthesis in erythroid cells and that a drastic inhibition is required to decrease porphyrin accumulation in CEP cellular models. Although effective, PBGD inhibition may not be appropriate in the perspective of clinical translation because deficient PBGD enzymatic activity accounts for acute hepatic porphyria attacks.1 The ALAS2 isozyme is a gatekeeper of heme biosynthesis in the erythron, and its role as a modifier gene in erythroid disorders has been documented.15 Enhancing ALAS2 activity increases porphyrin synthesis and leads to porphyria, whereas excessive inhibition may induce ineffective erythropoiesis and mimics X-linked sideroblastic anemia. Because X-linked sideroblastic anemia is clinically heterogeneous, and numerous molecular mechanisms are responsible for the ALAS2 defect, the minimal inhibition threshold leading to adverse effects is not clear. In our experiments, about a 50% reduction of ALAS2 expression significantly reduced porphyrin accumulation in UROS-deficient erythroid cells. Because ALAS2 expression is iron dependent, we evaluated whether iron chelation therapy could limit the first step of heme synthesis and decrease porphyrin production. Several iron chelators are used to excrete iron complexes through urine or feces; among them, DEF was the first orally active compound successfully used in humans.27,31
We describe a dose-dependent decrease in porphyrin accumulation after ALAS2 inhibition in erythroid cellular models of CEP treated with DEF. To investigate this therapeutic approach in vivo, DEF was administered to normal and CEP mice for 6 consecutive months. A significant decrease was observed in porphyrin overload in CEP mice that rescued skin photosensitivity and led to a dramatic improvement in hemolytic anemia upon iron chelation therapy. This result is most likely due to enhanced efficiency of erythropoiesis and erythrocyte survival due to the decrease in porphyrin in bone marrow and circulating RBCs. Because we obtained a similar metabolic correction to that observed after administration of proteasome inhibitors, the hematologic parameters improved significantly, probably owing to a longer treatment period (26 weeks vs 9 weeks for proteasome inhibition).6 However, because we observed a tendency to microcytosis in CEP mice after long-term treatment with iron chelators, it would be important to carefully monitor the occurrence of iron-deficiency anemia in clinical practice.
These findings raise the question of the potential translation of these results to other erythropoietic porphyrias.19,20 In X-linked protoporphyria, iron substitution increases hemoglobin concentration and decreases free protoporphyrin IX (PPIX) and Zn-PPIX, probably because iron is a cosubstrate of ferrochelatase, whereas the PPIX excess can be converted to heme. Concerning erythropoietic protoporphyria (EPP), the effect of iron substitution is much less obvious, but growing evidence shows that PPIX increases upon iron substitution.20,31 However, a recent study indicated that mild iron deficiency did not lead to decreased PPIX accumulation in a mouse model of EPP.32 Further studies are required to determine whether iron chelation therapy can sufficiently reduce ALAS2 activity to prevent PPIX accumulation in EPP.
In CEP mice, a severe, chronic hemolytic anemia stimulates erythropoiesis, which increases erythroferrone secretion from bone marrow and downregulates hepcidin expression, favoring intestinal iron absorption.29 CEP could be assimilated as an iron-loading anemia in mice, but normal transferrin saturation limits iron storage in this model compared with hemochromatosis with normal erythropoiesis or with iron-loading anemia due to ineffective erythropoiesis. We obtained a significant decrease in iron stores and overload in the liver, spleen, and kidney upon iron chelation therapy. However, iron bioavailability improved only modestly after treatment with iron chelators. To our knowledge, iron metabolism has not been explored in CEP disease, but most nontransfusion-dependent patients exhibit a moderate to mild hematologic phenotype without chronic hemolytic anemia or iron overload.4 Because hemolytic anemia is a feature of severe disease, it is likely that iron overload is restricted to this category of CEP patients but is underestimated and poorly reported. For example, Landge et al33 described nontransfusion-dependent iron overload accompanying anemia in a CEP patient presenting with nephrotic syndrome. Because iron overload in nontransfused CEP patients is supposedly due to hemolysis, we performed hemoglobinuria determination in our library of patients with Günther disease (supplemental Table 2). The results were similar to what was observed in other hemolytic disorders: we detected significant hemoglobinuria only in severely affected patients who also exhibit high hemolysis (drastic decrease in plasmatic haptoglobin levels and increase in LDH levels) and severe anemia. These additional data support the idea that iron metabolism disturbance is certainly not a general feature in patients with CEP but is probably limited to severe phenotypes as observed in the murine model of CEP.
Originally, iron chelation was used to treat secondary hemosiderosis related to regular transfusions in inherited RBC disorders. More recently, the indications for chelation have broadened considerably to include a variety of other diseases, some with iron overload and others in which it seems that iron may play an important role in the pathophysiology of that condition.27 Several iron chelators are available, but their long-term use would be questionable due to potential toxicity in the absence of official approval in erythropoietic porphyria, especially for patients without iron overload. Iterative and controlled bloodletting may be an alternative way to achieve iron deprivation. A drop in porphyrin accumulation associated with a significant improvement in both skin photosensitivity and hemolysis was observed in the setting of iron deficiency due to gastrointestinal bleeding but also after treatment with the iron chelator deferasirox in a patient with CEP.21 Furthermore, we recently reported a major clinical benefit of iterative phlebotomies over a 2-year period in a patient with CEP and moderate hemolysis.22 Although therapeutic phlebotomies would be contraindicated in a patient with CEP and severe anemia, we propose using low-dose iron chelation as a first-line treatment to overcome hemolytic anemia.
Taken together, these results illustrate the therapeutic potential of modulating ALAS2 enzymatic activity for erythropoietic porphyria, as this strategy has already been applied to treat intermittent acute hepatic porphyria with a modified small interfering RNA targeting hepatic ALAS1.34 The antituberculosis agent isoniazid (INH) is a potent inhibitor of the ALAS2 enzyme and may induce sideroblastic anemia in some patients.35 It was recently shown that INH reduces PPIX accumulation in cellular and murine models of protoporphyria.36 However, pilot clinical studies failed to confirm the therapeutic effect in patients with XLP and EPP after administration of INH at the standard treatment dose (5 mg/kg per day, up to 300 mg/d) for Mycobacteriumtuberculosis. Mice received a much higher weight-based dose (100 mg/kg) in these studies, but regulatory guidelines limited the dose of INH due to toxicity, especially in pyridoxal phosphate–deficient patients. Specific inhibitory drugs targeting ALAS2 in the erythron and exhibiting high specificity and affinity are required for safer use, with minimal adverse effects in erythropoietic porphyria in the near future.
Requests for original data may be submitted to the corresponding author (Emmanuel Richard; e-mail: emmanuel.richard@u-bordeaux.fr).
The online version of this article contains a data supplement.
The publication costs of this article were defrayed in part by page charge payment. Therefore, and solely to indicate this fact, this article is hereby marked “advertisement” in accordance with 18 USC section 1734.
Acknowledgments
Ray Cooke, a medical writer, provided editorial assistance during preparation of the manuscript.
This study was supported by grants from Laboratory of Excellence (Labex) GR-Ex (reference ANR-11-LABX-0051, E.R. and Z.K.). The Labex GR-Ex is funded by the program “Investissements d’Avenir” of the French National Research Agency (reference ANR-11-IDEX-0005-02). This study was also supported, in part, by research funding from Institut National de la Santé et de la Recherche Médicale (INSERM) and the University of Bordeaux.
Authorship
Contribution: J.-M.B., C.G., and E.R. conceived, planned the experiments, and supervised the work; J.-M.B., E.R., C.G., I.L.-G., R.D., and M.L. conducted the experiments; P.C. provided expert assistance with mice experiments; Z.K. and E.R. conjointly applied for funding; F.M.-G., A.B., F.M.-P., H.P., and L.G. provided critical feedback and helped shape the research, analysis, and manuscript; and E.R. wrote the paper. All authors amended the manuscript, and all authors analyzed the data.
Conflict-of-interest disclosure: The authors declare no competing financial interests.
Correspondence: Emmanuel Richard, Université de Bordeaux, INSERM U1035, 146 rue Léo Saignat, 33076 Bordeaux Cedex, France; e-mail: emmanuel.richard@u-bordeaux.fr.
