

Key Points
Hodgkin tumor cells extensively interact with rosetting CD4+ T cells by immunological synapse formation involving HLA class II and CD58.

Abstract
A unique feature of Hodgkin lymphoma (HL) is the presence of CD4+ T cells that surround, protect, and promote survival of tumor cells. The adhesion molecules involved in this so-called T-cell rosetting are important components of the immunological synapse (IS). However, it is unknown whether this synapse is fully assembled and leads to T-cell activation by enabling interaction between the T-cell receptor (TCR) and human leukocyte antigen class II (HLA-II). We established a novel rosetting model by coculturing HLA-II–matched peripheral blood mononuclear cells with HL cell lines and showed IS formation with activation of rosetting T cells. HLA-II downregulation by class II transactivator knockout did not affect the extent of rosetting, but almost completely abrogated T-cell activation. Intriguingly, the level of CD58 expression correlated with the extent of rosette formation, and CD58 knockout or CD2 blockade reduced both rosette formation and T-cell activation. The extension of our findings to primary HL tissue by immunohistochemistry and proximity ligation assays showed interaction of CD2 with CD58 and of TCR-associated CD4 with HLA-II. In conclusion, T-cell rosetting in HL is established by formation of the IS, and activation of rosetting T cells critically depends on the interaction of both TCR-HLA-II and CD2-CD58.
Introduction
A unique Hodgkin lymphoma (HL) characteristic is the tight adherence of rosetting CD4+ T cells to Hodgkin tumor cells.1,2 Rosetting T cells are extremely important for tumor cell survival.3,4 Previous studies have described the involvement of several adhesion molecules in HL rosette formation.5-7 These molecules are important components of the immunological synapse (IS), which enables antigen-dependent communication between T cells and antigen-presenting cells (APCs). Adhesion molecule pairs, such as CD2-CD58 and CD11a-CD54, induce a transient adhesion of T cells to APCs, after which the T-cell receptor (TCR) scans the cell surface for antigens presented in the context of human leukocyte antigen (HLA) molecules. Upon antigen recognition, F-actin polymerization enables stabilization of the mature IS with a central region that contains the TCR-HLA molecules and interacting adhesion molecules in the periphery.8-10 IS formation and the specific role of HLA-II-TCR interaction has never been studied in HL. To address this, we developed a novel short-term in vitro coculture model system with peripheral blood mononuclear cells (PBMCs) that are matched to the HLA-II type of HL cell lines.
Materials and methods
Conditions for the short-term in vitro model system were optimized by using HLA-II unmatched PBMCs (supplemental Methods, available on the Blood Web site). This approach with unmatched PBMCs is consistent with most previous studies, but has the disadvantage that T-cell responses are largely attributable to alloreactivity.6,11 We used HLA-II–matched PBMCs to more closely resemble the in vivo situation (supplemental Tables 1 and 2). HL cell lines were cocultured with PBMCs at a ratio of 1:20. After incubation, cytospins were made (at 30 minutes or 2 hours) or supernatant was collected (at 18 hours). Rosettes were defined as tumor cells with 3 or more adherent lymphocytes and were quantified. The interleukin-2 (IL-2) concentration in supernatants was used as a measure of T-cell activation. Localization of IS molecules was studied by immunofluorescence. Results were statistically significant at P < .05. Additional details are provided in the supplemental Methods.
Results and discussion
HL cell lines express IS components
HL cell lines were characterized for cell-surface expression of IS components HLA-I, HLA-II, CD58, and CD54 (supplemental Figure 1). Expression of CD54 was observed in all HL cell lines, whereas HLA-II was absent only in DEV and HLA-I in both DEV and L428. There was no expression of CD58 in KMH2, SUPHD1, and DEV; low expression in L540 and HDLM2 (referred to as CD58−); intermediate expression in L591; and high expression in L1236 and L428 (referred to as CD58+). Lack of HLA-II or CD58 has been described in cell lines and in advanced-stage or relapsed disease, possibly because the tumor cells progress to become independent of the interaction with rosetting T cells.12-14
Essential roles for CD58 and HLA-II in T-cell rosetting and activation
CD58+ HL cell lines had a significantly higher percentage of tumor cells with rosettes compared with CD58− cell lines (Figure 1A). The rosetting cells were mainly CD4+ T cells (supplemental Figure 2). In addition, T cells in coculture with CD58+ HL cell lines showed a clear induction of IL-2, whereas T cells cocultured with CD58− HL cell lines did not (Figure 1B). Thus, expression of CD58 plays a role in both T-cell adhesion and activation.

Involvement of HLA-II, CD58, and CD54 in adhesion and activation of rosetting T cells using PMBCs from at least 3 individual HLA-II–matched donors. (A) The percentage of tumor cells with rosettes was quantified after a 30-minute coculture of HL cell lines and matched PBMCs. CD58+ cell lines were L591, L1236, and L428, and the CD58− cell lines were KMH2, SUPHD1, HDLM2, and L540. (B) TCR-mediated T-cell activation was determined by measuring IL-2 (picograms per milliliter) in the culture supernatant after 18 hours of coculture with different HL cell lines. (C) The percentage of tumor cells with rosettes was quantified after a 30-minute coculture of L428 WT, nontargeting (NT) control, and 2 independently generated CD58-KO, CD54-KO, or CIITA-KO cell lines with matched PBMCs. CIITA was targeted to generate HLA-II low cells. In panels A-C, each dot or bar represents 1 independent HLA-II–matched donor used for cocultures. (D) IL-2 production of matched PBMCs in response to a coculture with WT, NT, CD58-KO, CD54-KO, or CIITA KO L428 cell lines. Data are expressed as the mean of 3 different HLA-II–matched PBMC donors ± standard deviation. (E) CD2, TCR, CD11a, and F-actin staining (red signal) of L428 cells cocultured with matched PBMCs. Nuclei were counterstained with 4′,6-diamidino-2-phenylindole (DAPI; blue signal). (F) CD2 staining of WT, CD58-KO, CD54-KO, and CIITA-KO L428 cell lines cocultured with matched PBMCs. Staining was visualized using a Leica DM4000B microscope equipped with a Leica DFC345FX Camera and LAS V4.8 software. Relocalization of CD2 can be observed as discrete red signals at the interface between T cells and tumor cells instead of the homogenous circumferential staining of entire T cells. Relocalization of F-actin in tumor cells presented as spider-web–like structures stretching out toward the T cells. Representative images are shown; original magnification ×400. Statistical significance was calculated with a 1-tailed Mann-Whitney U test if different cell lines were compared (A-B) or a 1-tailed paired Student t test if a KO was compared with the WT (C-D). *P < .05; **P < .01; ***P < .001; ****P < .0001.
Involvement of HLA-II, CD58, and CD54 in adhesion and activation of rosetting T cells using PMBCs from at least 3 individual HLA-II–matched donors. (A) The percentage of tumor cells with rosettes was quantified after a 30-minute coculture of HL cell lines and matched PBMCs. CD58+ cell lines were L591, L1236, and L428, and the CD58− cell lines were KMH2, SUPHD1, HDLM2, and L540. (B) TCR-mediated T-cell activation was determined by measuring IL-2 (picograms per milliliter) in the culture supernatant after 18 hours of coculture with different HL cell lines. (C) The percentage of tumor cells with rosettes was quantified after a 30-minute coculture of L428 WT, nontargeting (NT) control, and 2 independently generated CD58-KO, CD54-KO, or CIITA-KO cell lines with matched PBMCs. CIITA was targeted to generate HLA-II low cells. In panels A-C, each dot or bar represents 1 independent HLA-II–matched donor used for cocultures. (D) IL-2 production of matched PBMCs in response to a coculture with WT, NT, CD58-KO, CD54-KO, or CIITA KO L428 cell lines. Data are expressed as the mean of 3 different HLA-II–matched PBMC donors ± standard deviation. (E) CD2, TCR, CD11a, and F-actin staining (red signal) of L428 cells cocultured with matched PBMCs. Nuclei were counterstained with 4′,6-diamidino-2-phenylindole (DAPI; blue signal). (F) CD2 staining of WT, CD58-KO, CD54-KO, and CIITA-KO L428 cell lines cocultured with matched PBMCs. Staining was visualized using a Leica DM4000B microscope equipped with a Leica DFC345FX Camera and LAS V4.8 software. Relocalization of CD2 can be observed as discrete red signals at the interface between T cells and tumor cells instead of the homogenous circumferential staining of entire T cells. Relocalization of F-actin in tumor cells presented as spider-web–like structures stretching out toward the T cells. Representative images are shown; original magnification ×400. Statistical significance was calculated with a 1-tailed Mann-Whitney U test if different cell lines were compared (A-B) or a 1-tailed paired Student t test if a KO was compared with the WT (C-D). *P < .05; **P < .01; ***P < .001; ****P < .0001.
To further study the roles of CD58, HLA-II, and CD54, we generated knockouts (KOs), by using the CRISPR-Cas9 approach in the HLA-I–deficient L428 cell line (supplemental Figure 3). In comparison with wild-type (WT), the percentage of tumor cells with rosettes decreased significantly after CD58 KO (20% to 25%), whereas HLA-II downregulation (generated by class II transactivator knockout [CIITA-KO]) or CD54-KO did not affect rosette formation (Figure 1C). However, activation of rosetting T cells was dependent on both HLA-II and CD58, as interaction with CIITA-KO or CD58-KO cells significantly reduced IL-2 production compared with WT cells (Figure 1D). The KOs did not affect the T-cell composition of the rosettes (supplemental Figure 4A). In accordance with the CD58-KO results, addition of a CD2-blocking antibody to cocultures with WT cells reduced both the percentage of tumor cells with rosettes and IL-2 production (supplemental Figure 4B-C).
Next, IS assembly was studied, focusing on relocalization of IS components and F-actin polymerization. CD58+ HL cell lines induced a distinct relocalization of CD2 on most of the rosetting T cells to the physical interface with the tumor cells, which was not observed in response to CD58− HL cell lines or CD58-KO cells (Figure 1E-F; supplemental Figure 4D). There was hardly any relocalization of CD11a and TCR, whereas F-actin polymerization was prominent. This observation is in line with those in previous studies of normal IS assembly, reporting fast and massive relocalization of CD2 towards the APC, whereas the extent of TCR relocalization is less pronounced.10,15 Because CD2 is not involved in the earliest steps of T-cell activation,10,16-19 we suggest that activation of rosetting T cells in our model occurs in 2 steps: engagement of the TCR with antigen-HLA-II complexes which initiates activation, followed by signal amplification through CD2-CD58. Because we used HLA-II–matched PBMCs, the observed T-cell activation should be the result of specific TCR-mediated recognition of the HLA-antigenic peptide complex.
Physical interaction between HLA-II-CD4 and CD58-CD2
We next used proximity ligation assays (PLAs) to confirm physical interactions between CD2-CD58 and TCR-associated CD4-HLA-II. Clear interaction signals at the IS were observed between CD2 on T cells and CD58 on WT, CD54-KO, and CIITA-KO L428 cells, but not on CD58-KO L428 and CD58− KMH2 cells (Figure 2A-B). Protein-protein interactions were also seen between CD4 and HLA-II at the IS with WT, CD58-KO, or CD54-KO L428 cells and, as expected, not with the CIITA-KO L428 and HLA-II− DEV cells (Figure 2A,C). Extension of our study to primary HL tissue showed results compatible with the in vitro model, that is, a strong rim of CD2 staining in T cells at the tumor cell interface, whereas this was not observed for the TCR (Figure 2D). The PLA assays in HL tissue showed clear interaction signals between CD2 and CD58 and between CD4 and HLA-II at the interface between T cells and tumor cells (Figure 2E).
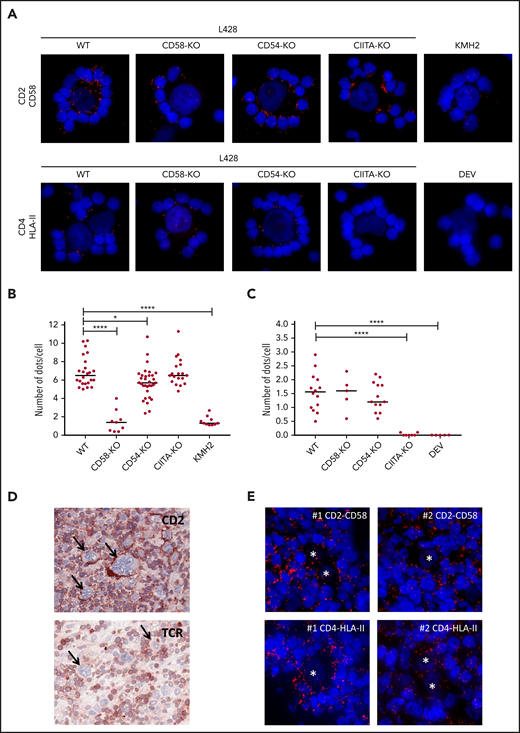
Proximity ligation assay shows the proximity of CD2-CD58 and CD4-HLA-II in vitro and in HL tissue. (A) Results of PLAs of L428 WT, CD58-KO, CD54-KO, CIITA-KO, the CD58− KMH2 or the HLA-II− DEV cell line cocultured with matched PBMCs for CD2-CD58 and CD4-HLA-II (red signal). Nuclei were counterstained with 4′,6-diamidino-2-phenylindole (DAPI; blue signal). Quantification of the number of red dots at the tumor cell–T-cell interface of CD2-CD58 (B) and CD4-HLA-II (C) for multiple rosettes using 1 HLA-II–matched donor. Each point in the graph indicates the average number of red dots per attached cell in a single rosette. (D) Immunohistochemical staining for CD2 and TCR in snap-frozen primary HL tissue. Arrows indicate tumor cells. (E) PLA staining (red signal) for CD2-CD58 and CD4-HLA-II on 2 different tissue samples from patients with primary HL. Nuclei were counterstained with DAPI (blue signal). Asterisks indicate tumor cells. In panels A and E, PLA signals were visualized with a Leica DM4000B microscope equipped with a Leica DFC345FX Camera and LAS V4.8 software. All images are representative; original magnification ×400. Red dots indicate the proximity (within 40 nm) of the 2 proteins studied. Statistical significance was calculated with a 1-tailed Mann-Whitney U test, with all conditions compared with the WT. *P < .05; ****P < .0001.
Proximity ligation assay shows the proximity of CD2-CD58 and CD4-HLA-II in vitro and in HL tissue. (A) Results of PLAs of L428 WT, CD58-KO, CD54-KO, CIITA-KO, the CD58− KMH2 or the HLA-II− DEV cell line cocultured with matched PBMCs for CD2-CD58 and CD4-HLA-II (red signal). Nuclei were counterstained with 4′,6-diamidino-2-phenylindole (DAPI; blue signal). Quantification of the number of red dots at the tumor cell–T-cell interface of CD2-CD58 (B) and CD4-HLA-II (C) for multiple rosettes using 1 HLA-II–matched donor. Each point in the graph indicates the average number of red dots per attached cell in a single rosette. (D) Immunohistochemical staining for CD2 and TCR in snap-frozen primary HL tissue. Arrows indicate tumor cells. (E) PLA staining (red signal) for CD2-CD58 and CD4-HLA-II on 2 different tissue samples from patients with primary HL. Nuclei were counterstained with DAPI (blue signal). Asterisks indicate tumor cells. In panels A and E, PLA signals were visualized with a Leica DM4000B microscope equipped with a Leica DFC345FX Camera and LAS V4.8 software. All images are representative; original magnification ×400. Red dots indicate the proximity (within 40 nm) of the 2 proteins studied. Statistical significance was calculated with a 1-tailed Mann-Whitney U test, with all conditions compared with the WT. *P < .05; ****P < .0001.
Taken together, these results show that rosetting CD4+ T cells in HL are activated after formation of a functional IS, with essential roles for interaction between TCR-HLA-II and CD2-CD58. A large proportion of the rosetting cells are CD4+ T cells. The previously shown polyclonal nature of these T cells suggests that many different antigenic peptides are being recognized, which is consistent with the high mutational burden in HL.20-22 Although the rosetting T cells are activated, they do not expand, because of immune regulatory mechanisms exerted by the tumor cells, such as expression of immune checkpoint molecules and production of immunosuppressive cytokines.3,4,23 Instead, they become anergic, provide growth stimuli for the tumor cells and form a physical barrier between the tumor cells and other, more hostile immune cells, such as cytotoxic T cells and NK cells.24,25 This knowledge of the cross talk of HL cells with their immediate neighbors provides a better understanding of early lymphoma development and may help improve immunotherapy in HL.
Original data are available by e-mail request to the corresponding author.
The online version of this article contains a data supplement.
The publication costs of this article were defrayed in part by page charge payment. Therefore, and solely to indicate this fact, this article is hereby marked “advertisement” in accordance with 18 USC section 1734.
Acknowledgments
J.V. was funded by the Graduate School of Medical Sciences, University of Groningen, University Medical Center Groningen, Groningen, The Netherlands. The modified lentiCRISPR v2 vector was the kind gift of Ryan O’Connell (University of Utah, Salt Lake City, UT).
Authorship
Contribution: J.V., A.D., L.V., and A.v.d.B. designed the study and wrote the manuscript; B.H. and M.H.-K. performed the HLA typing and selected the donors; J.V., N.M., and L.V. performed the in vitro experiments; and J.V. and L.V. performed the data analysis.
Conflict-of-interest disclosure: The authors declare no competing financial interests.
Correspondence: Arjan Diepstra, University Medical Center Groningen, Hanzeplein 1, code EA10, PO Box 30.001, 9700 RB Groningen, The Netherlands; e-mail: a.diepstra@umcg.nl.

This feature is available to Subscribers Only
Sign In or Create an Account Close Modal