

Key Points
Rapid uptake of mAb-opsonized cells by macrophages causes persistent reduction of phagocytosis (hypophagia) due to surface Fc receptor loss.
Because macrophages are key immune effectors for many therapeutic mAbs, hypophagia could contribute to therapeutic resistance to these mAbs.

Abstract
Macrophage antibody (Ab)-dependent cellular phagocytosis (ADCP) is a major cytotoxic mechanism for both therapeutic unconjugated monoclonal Abs (mAbs) such as rituximab and Ab-induced hemolytic anemia and immune thrombocytopenia. Here, we studied the mechanisms controlling the rate and capacity of macrophages to carry out ADCP in settings of high target/effector cell ratios, such as those seen in patients with circulating tumor burden in leukemic phase disease. Using quantitative live-cell imaging of primary human and mouse macrophages, we found that, upon initial challenge with mAb-opsonized lymphocytes, macrophages underwent a brief burst (<1 hour) of rapid phagocytosis, which was then invariably followed by a sharp reduction in phagocytic activity that could persist for days. This previously unknown refractory period of ADCP, or hypophagia, was observed in all macrophage, mAb, and target cell conditions tested in vitro and was also seen in vivo in Kupffer cells from mice induced to undergo successive rounds of αCD20 mAb-dependent clearance of circulating B cells. Importantly, hypophagia had no effect on Ab-independent phagocytosis and did not alter macrophage viability. In mechanistic studies, we found that the rapid loss of activating Fc receptors from the surface and their subsequent proteolytic degradation were the primary mechanisms responsible for the loss of ADCP activity in hypophagia. These data suggest hypophagia is a critical limiting step in macrophage-mediated clearance of cells via ADCP, and understanding such limitations to innate immune system cytotoxic capacity will aid in the development of mAb regimens that could optimize ADCP and improve patient outcome.
Introduction
Antibody (Ab)-dependent cellular phagocytosis (ADCP) by tissue macrophages is the principal cytotoxic mechanism for multiple therapeutic unconjugated monoclonal Abs (mAbs) used to treat malignancies and autoimmune diseases, including those targeting CD20, CD38, and CD52.1-7 ADCP also plays a central role in the pathophysiology of many life-threatening diseases, such as autoimmune hemolytic anemia and immune thrombocytopenia.8,9 As such, there has been an increased focus on delineating the mechanisms underlying the activation of macrophage ADCP and improving mAb therapies that rely on innate immune effectors to kill pathologic host cells. Furthermore, an increased understanding of the integral role that macrophage phagocytosis plays in the clearance of malignant cells has spurred investigation of ways to maximize macrophage cell clearance capabilities through cell engineering, such as chimeric antigen receptors.10
In recent years, we have gained a number of important insights into the in vivo mechanism of action for lymphocyte-targeting mAbs such as αCD20 and αCD52. Using intravital imaging in mice, Montalvao et al4 found that the liver was the primary site of B-cell clearance upon αCD20 treatment, where resident macrophages, or Kupffer cells (KCs), were shown to be the principal mediators of ADCP. This finding was supported by a contemporaneous report from Gul et al3 demonstrating that Fcγ receptor I (FcγRI) and FcγRIV were critical for KC-mediated engulfment of opsonized B16F10 mouse tumor cells upon in vivo administration of a B16F10-specific mAb (TA99). A similar requirement for FcγR expression by liver phagocytes was reported by Grandjean et al5 using human therapeutic αCD20 mAbs rituximab (RTX) and obinutuzumab to drive ADCP clearance of B cells in mice expressing human CD20 (hCD20). More recently, Lehmann et al11 and Gordan et al12 used bone marrow (BM) chimera approaches to show that the ontogeny of innate immune effectors that mediate in vivo cytotoxicity of mAbs, whether embryonically derived tissue-resident macrophages or hematopoietically derived myeloid cells, was highly dependent on tissue type. Importantly, this group also showed that mAb-mediated clearance of circulating leukocytes in the liver relied on redundant effector functions of both tissue-resident and hematopoietic cells recruited to the liver.12 None of these studies, however, examined the ADCP capacity of macrophages or addressed whether macrophage exhaustion could affect mAb-mediated cell clearance.
Although targeted therapy with mAbs has proven highly effective, mAb monotherapy is not curative in B-cell malignancies; the reasons for this are poorly understood. In patients with a high burden of circulating malignant lymphocytes, such as in chronic lymphocytic leukemia (CLL), treatment with IV αCD20 mAbs (RTX or ofatumumab) causes a rapid (hours) but limited (∼50%) decrease in circulating CLL cell counts.13,14 This is followed by a prolonged period (days) during which there is no further decrease in the circulating CLL cell count even with additional administration of drug.13,14 We previously showed this cessation of circulating CLL cell clearance did not correlate with loss of circulating mAb or exhaustion of serum complement.13 Instead, these data suggest that the limited therapeutic response could be caused by exhaustion of innate immune effector functions like ADCP, especially under conditions where a high target/effector cell ratio is seen.8,15 Although lymphocyte exhaustion is now appreciated as a major factor limiting T-cell–mediated antitumor responses,16,17 innate immune exhaustion and its impact on malignant cell clearance have not been studied in nearly as much detail.
Because many therapeutic mAbs mediate cell clearance via ADCP, studying phagocytic exhaustion and understanding its mechanisms could be essential for improving therapeutic outcomes. However, only a few studies have endeavored to address this question. A 1999 report by Erwig et al18 using rat BM-derived macrophages (BMDMs) as phagocytes showed that a 30-minute coculture with apoptotic neutrophils caused a decrease of ∼50% in apoptotic cell phagocytosis (efferocytosis) upon subsequent rechallenge with fresh target cells. Although the mechanisms underlying the finite capacity of macrophages for efferocytosis have not been reported, it seems these mechanisms are able to distinguish efferocytosis from ADCP, because ADCP was not affected by efferocytic exhaustion.18 Ab-mediated phagocytic capacity was first investigated by Cannon and Swanson,19 who showed that even when maximally stretched on an immunoglobulin G (IgG)–coated plate (ie, frustrated phagocytosis), macrophages retained the ability to bind Ab-opsonized targets but did not seem to engulf these targets. Recently, we showed that in vitro ADCP by human monocyte–derived macrophages (hMDMs) seemed to be saturable, because the majority of macrophage ADCP occurs within the first hour upon coculturing with mAb-opsonized CLL cells, with very little cell clearance seen over the remaining 23 hours of the assay.20 However, this study did not directly assess the phagocytic capacity of macrophages after this initial engulfment phase. In this study, we used in vitro and in vivo approaches to study macrophage ADCP capacity and show that macrophage phagocytic capacity is indeed finite and that such phagocytic exhaustion, or hypophagia, is a conserved negative regulatory mechanism that limits the number of targets engulfed by macrophages in vitro and in vivo.
Methods
Mice
Animal experiments were approved by the University of Rochester Animal Care and Use Committee, and mice were housed under specific pathogen–free conditions. Mouse strains C57BL/6J, Ai9, and hCD2-iCre were obtained from Jackson Laboratory (Bar Harbor, ME). Thymocytes, splenic B cells, and BM were isolated from male and female mice between 4 to 20 weeks of age. For in vivo ADCP experiments, heterozygous hCD2-iCre mice (B6.Cg-Tg[CD2-icre]4Kio/J; stock number 008520) and homozygous Ai9 (RCL-tdTomato) mice (B6.Cg-Gt[ROSA]26Sortm9(CAG-tdTomato)Hze/J; stock number 007909) were purchased from Jackson Laboratory and bred in house under specific pathogen–free conditions. All mice were maintained on a C57BL/6 background, and a mixture of both female and male mice between 8 and 16 weeks of age were used in these experiments. All animal procedures were reviewed and approved by the University of Rochester Committee on Animal Resources.
Chemicals and cell culture reagents
Commercial reagents were obtained from the following suppliers: heat-inactivated fetal bovine serum (FBS; Atlanta Biologicals); cell culture media and additives (Cellgro); murine macrophage colony-stimulating factor (M-CSF), interferon-γ (IFN-γ), and C5a (Biolegend); MG132 (Tocris); bafilomycin A1 (Millipore); dexamethasone, eFluor670, and CellTracker Deep Red (Thermo Fisher Scientific); CypHer5 (GE Life Sciences); 5-TAMRA-SE, and pHrodo Red STP (Invitrogen); and recombinant human M-CSF (Peprotech).
Functional Abs for ADCP assays
mAbs used in ADCP assays were toxin free, cell culture or in vivo grade, and were obtained from the following sources: anti-mouse CD90.2 (30-H12) and control IgG (RTK4530 and MOPC-21; BioLegend), anti-mouse CD20 (5D2; Genentech, South San Francisco, CA), control IgG (G155-178; BD Biosciences), anti-human CD52 (alemtuzumab; Sanofi Genzyme, Cambridge, MA), and anti-human CD20 (rituximab; Genentech).
Abs for flow cytometry and western blotting
Fluorescently conjugated Abs for flow cytometry were obtained from the following sources: anti-mouse CD64 (X54-5/7.1), anti-mouse CD16.2 (9E9), anti-hCD64 (10.1), anti-hCD32 (FUN-2), and anti-hCD16 (3G8; BioLegend); anti-mouse CD32b (AT130-2; Invitrogen); anti-hCD32b (PA547122, unconjugated) and donkey anti-goat IgG secondary (Thermo Fisher Scientific); anti-mouse CD45 (30-F11) and anti-mouse CD11b (M1/70; BD Biosciences); anti-mouse Tim4 (RMT4-54; Invitrogen); anti-mouse Ly6C (HK1.4) and anti-mouse CD64 (X54-5/7.1; BioLegend); anti-mouse CD32b (AT130-2) and anti-mouse CD3e (17A2; Invitrogen); anti-mouse CD16 (AT154-2) and anti-mouse F4/80 (CI:A3-1; Bio-Rad); and anti-mouse/human B220 (RA3-6B2), anti-mouse CD19 (1D3), and 7AAD (Tonbo Biosciences). Abs for western blotting were obtained from the following sources: anti–phospho-Y525/Y526 Syk (C87C1), anti-Syk (D3Z1E), anti-mouse CD32b (D8F9C), anti–glyceraldehyde-3-phosphate dehydrogenase (5174), and anti-K48 ubiquitin (D9D5, horseradish peroxidase conjugated; Cell Signaling Technology); anti-mouse CD64 (AF2074) and anti-hCD32b (PA547122; Thermo Fisher Scientific); and anti-hCD64 (276426; R&D Systems).
Primary cell isolation and culture
Mouse BMDMs were derived from BM isolated from the femurs of 5- to 20-week-old C57BL/6J mice and cultured in RFHP10 media (RPMI 1640 supplemented with 10% heat-inactivated FBS, 10 mM N-2-hydroxyethylpiperazine-N′-2-ethanesulfonic acid, and 1% penicillin–streptomycin–L-glutamine) supplemented with 20 ng/mL of M-CSF for 6 to 9 days as previously described.21 Murine peritoneal macrophages (pMacs) were isolated from 6- to 12-week-old C57BL/6J mice by peritoneal lavage and cultured as previously described.21 Murine thymocytes and splenic B cells were isolated from C57BL/6J mice as previously described.22 hMDMs were derived from CD14+ peripheral blood mononuclear cells of healthy donors as previously described.2,20 CLL cells were isolated from peripheral blood specimens of treatment-naïve patients and purified to at least 90% CD5+CD19+ CLL cells and cultured as previously described.2,20 All human specimen collection and usage were conducted with written informed consent after approval of the Institutional Research Subjects Review Board according to the ethical guidelines of the Declaration of Helsinki.
Phagocytosis imaging assays
BMDMs (day 6-9) were collected by trypsinization and seeded in 1 mL of RFHP10 at 5 × 10⁴ cells per well of a 24-well treated tissue culture plate (Falcon) and cultured for 18 to 24 hours. For ADCP assays lasting >24 hours, 20 ng/mL of M-CSF was added to RFHP10 at the time of reseeding to maintain BMDM viability throughout the experiment. Before ADCP assay, BMDMs were stained with cell-permeable tracer dye (ie, 2.5 μM of 5-TAMRA-SE or 1 μM of CellTracker Deep Red) for 20 minutes at 37°C in cation-free Hanks balanced salt solution. After washing with RFHP10, BMDMs were allowed to recover for 2 to 4 hours in RFHP10; 5 × 10⁵ target cells were added to wells and the plate was centrifuged at 50× g for 1 minute to sediment target cells. In some experiments, target cells were labeled with the pH-sensitive dye pHrodo Red STP (1 μM) in cation-free Hanks balanced salt solution for 20 minutes before addition to BMDMs. The plate was then mounted on a stage-top environmental chamber of a Nikon Ti-Eclipse inverted microscope to maintain 37°C/5% carbon dioxide throughout the experiment. Phase contrast and fluorescent images were captured using a 20× objective at 2-minute intervals for 10 to 20 minutes before addition of mAb. After addition of mAb, BMDMs were imaged for 2 to 8 hours using the same microscope settings. A similar approach was used to image ADCP by pMacs and hMDMs, with the following modifications. pMacs were harvested by peritoneal lavage and cultured on tissue culture plates 10 cm in diameter in RFHP10 for 2 hours. After washing to remove nonadherent cells, pMacs were collected by trypsinization and immediately used for ADCP assay as described above. In some experiments, macrophages were treated with 25 μM of MG132 or 100 nM of bafilomycin A1 for 1 hour before ADCP assay. Phagocytosis of apoptotic cells (efferocytosis) was carried out similarly to ADCP assays, except that BMDMs were cocultured with thymocytes induced to undergo apoptosis by 3- to 4-hour treatment with 10 µM of dexamethasone as previously described.21 For phagocytosis rechallenge assays, at indicated times after initial coculture, wells were washed 3 times with RFHP to remove unengulfed cells, and fresh cells and Ab were added at indicated times in 500 μL of RFHP and imaged as described above. hMDMs were isolated and prepared for phagocytosis imaging studies as previously described, using CLL cells as targets.2,20
Phagocytic index calculations
Voids present within dye-labeled macrophages resulting from phagocytosis of target cells were counted using the SpotDetect function in the NIS-Elements (circles ∼4 μm in diameter of low/no dye signal). The number of macrophages per field of view was calculated using a binary layer detection method based on the fluorescence of the macrophage dye. Thresholding values were chosen for each experiment by the user based on the cell staining intensity, and macrophages had to have a diameter ≥10 microns to be counted to ensure only viable, healthy macrophages were enumerated. To calculate the phagocytosis index, we first subtracted the average number of voids from the initial 3 frames of the experiment before Ab addition (In) from raw void count in each subsequent frame collected (Vn). The initial background-subtracted void count for each frame was then normalized to 100 macrophages. Lastly, where applicable, the corresponding void count for each image frame of the no-Ab control was subtracted from the normalized void value for the corresponding frames for each condition. In rechallenge assays, the index was rezeroed at time of rechallenge by subtracting the number of voids from the initial rechallenge frame from all proceeding image loops. The dye-intensity index was calculated as described above, but the mean signal for the relevant fluorescent channel contained within the macrophage binary layer was used in place of the void counts. The relative indices were calculated by comparing the maximum δ from time of rechallenge between each condition and the control condition (normally unfed macrophages) and renormalizing these values across biological replicates. Furthermore, where human samples were included, the maximum δ values were divided by the background values in each replicate to account for the increased variability. Phagocytic index was calculated as follows: where Vn is the number of voids for frame n, 1n is the average number of initial voids for n frames before target cell addition, Mn is the number of macrophages for frame n, and NormNon is the number of normalized voids for frame n in the no-Ab control. Any frame that results in an index <0 will set to 0.
In vivo ADCP assay
hCD2-iCre/tdTomatofl/fl mice were treated IV with 25 μg of anti-CD20 (clone 5D2, isotype IgG2a; Genentech) to stimulate phagocytosis of endogenous B cells by KCs, as previously reported.5 Mice were rechallenged 6 hours later by IV delivery of 1 × 10⁷ eFluor670-labeled splenic B cells opsonized with 10 μg/mL of anti-CD20 for 10 minutes at 25°C.
Flow cytometry
For in vitro analyses, macrophages were plated at a density of ∼2 × 10⁵ cells per well in the absence of M-CSF unless cells were to be used for >24-hour recovery assays, in which case cells were replated in the presence of 20 ng/mL of M-CSF. In vitro macrophages were analyzed on an LSR II cytometer (Beckton-Dickinson). For ex vivo flow cytometric analysis of KCs, mice were euthanized with an intraperitoneal injection of Euthasol and perfused with 1× phosphate-buffered saline (PBS) either transcardially or via the hepatic portal vein. Livers were then subjected to 1 round of gentleMACS dissociation (Miltenyi) and enzymatically digested in Dulbecco’s modified Eagle medium with Glutamax-I (Gibco) containing 1 mg/mL of collagenase VIII (Sigma Aldrich) and 20 U/mL of DNase I (Roche) for 30 minutes at 37°C. After a second round of gentleMACS dissociation, liver homogenates were filtered through 100 μm cell strainer, washed with Dulbecco’s PBS containing 10% FBS to dilute enzyme, and centrifuged at 300 g for 5 minutes. Liver homogenate was then subjected to 25%/50% Percoll gradient separation (GE Healthcare) to remove debris and enrich for nonparenchymal cells, including KCs. After Percoll separation, cells were washed with fluorescence-activated cell sorting buffer (1× Dulbecco’s PBS containing 0.05% bovine serum albumin and 0.05% sodium azide), incubated in Fc block (clone 2.4G2; Tonbo Biosciences) for 15 minutes, and stained with the indicated antibodies for 25 minutes at 4°C in the dark. Analysis of ex vivo–derived cells was carried out using a Fortessa cytometer (Becton Dickinson). Background fluorescence of macrophages was determined using unstained cells rather than fluorescently conjugated isotype controls based on previous reports.23-25 Flow cytometric data were analyzed using FlowJo v10.
Western blotting and immunoprecipitation
Macrophages were plated in 24-well tissue culture plates overnight at a density of ∼2 × 10⁵ cells in RFHP medium. For analysis of Syk phosphorylation, macrophages were first coincubated with thymocytes with or without anti-CD90.2 for 2 hours before rechallenge. Rechallenge was conducted for 5 to 15 minutes using thymocytes and anti-CD90.2, immediately followed by 3 washes with cold cation-free Dulbecco’s PBS. Cells were lysed by addition of 250 μL of lysis buffer (20 mM of tris(hydroxymethyl)aminomethane-hydrochloride; pH, 7.5; 1% Triton-X100; 150 mM of sodium chloride; 1 mM of EDTA) supplemented with PhosSTOP (Sigma Aldrich) and protease inhibitor cocktail (EMD Millipore) for 10 minutes on ice, and lysates were cleared at 12 000 g at 4°C for 5 minutes. Cleared lysates were analyzed by western blotting as previously described.22 For immunoprecipitation of FcγRI, BMDMs were treated with 25 μM of MG132 or 100 nM of bafilomycin A1 for 3 hours before ADCP coculture. At the indicated times, BMDMs were lysed on the plate in 500 μL of lysis buffer on ice for 10 minutes and cleared by centrifugation. Cleared lysates were immunoprecipitated with 5 μg of anti-FcγRI Ab and 100 μL of protein G magnetic beads (Bio-Rad) according to the manufacturer’s instructions, and immunoprecipitations were analyzed by western blotting with the indicated Abs.
RNA extraction and gene expression analyses
Mouse BMDMs were coincubated with thymocytes and anti-CD90.2 for 0.5 to 4 hours. After washing away free Ab and thymocytes, total RNA was isolated from the adherent cells using the NucleoSpin RNA kit (Macherey-Nagel) according to directions provided by the manufacturer. Complementary DNA was synthesized from 250 to 400 ng of RNA using the iScript cDNA Synthesis Kit (Bio-Rad). Quantitative reverse transcription polymerase chain reaction was performed using iTaq Universal Probes Supermix (Bio-Rad) in a CFX Connect Real-Time System (Bio-Rad) under the following polymerase chain reaction conditions: 50°C for 2 minutes, 95°C for 20 seconds, and 39 cycles at 95°C for 3 seconds and 60°C for 30 seconds. The following gene-specific mouse TaqMan Gene Expression Assays (Applied Biosystems) were used: Fcgr1 (Mm00438874_m1), Fcgr2b (Mm00438875_m1), Fcgr3 (Mm00438882_m1), Fcgr4 (Mm00519988_m1), and Fcer1g (Mm02343757_m1). Expression levels were normalized to ActB (Mm00607939_s1) as previously described.22
Statistical analyses
The statistical significance of differences in mean values was calculated using either an unpaired 2-tailed Student t test, or 1-way analysis of variance, where indicated. A value of P < .05 was considered statistically significant. Samples were excluded where indicated using Grubb’s testing with an α value of 0.1.
Results
Phagocytosis quantification is frequently conducted using flow cytometric or microscopic analysis of fixed cells and tissues at specific end points. However, we reasoned that to understand macrophage phagocytic capacity, it was important to develop a quantification method that captured the dynamics of phagocytosis in real time. We therefore developed a live-cell imaging approach wherein engulfment events were measured in 2-minute increments over a period of 24 hours (described in "Methods").26 Primary macrophages derived from either mouse BM or CD14+ monocytes from healthy human donors (hMDMs) were labeled with cell-permeable fluorescent amine dyes and subsequently cocultured with primary, species-matched lymphocytes (ie, thymocytes or splenic B cells from mice or human-donor CLL B cells), followed by the addition of 10 μg/mL of opsonizing mAbs (eg, αCD90.2, αCD20, αCD52). Time-lapse images were acquired, and phagocytosis was measured by the appearance of dye voids within macrophages caused by discrete areas devoid of dye as a result of displacement by internalized targets (Figure 1A; supplemental Figure 1A, available on the Blood Web site). These results were comparable to those with other conventional methods of measuring target internalization, including pH-based target detection and flow cytometry (supplemental Figure 1B-C).26 Using this approach, we observed a relatively brief period of rapid ADCP within minutes of adding mAb to the cocultures that peaked around 30 to 60 minutes, with as many as 30 target cells internalized per macrophage (Figure 1B-D). To determine if this decline in void accumulation reflected reduced phagocytic activity, macrophages were cocultured with target cells and treated with opsonizing mAb, nonspecific IgG, or no mAb for 2 to 4 hours (first challenge), washed to remove free targets and Ab, and challenged again with fresh targets and mAb (second challenge; Figure 1E). As shown in Figure 1E-H and supplemental Videos 1-8, macrophages first challenged with targets and opsonizing mAb showed a near-complete loss of phagocytic activity upon rechallenge. Under the conditions shown in Figure 1E, analysis of the time-lapse imaging revealed that 87% (± 5.7%; n = 10) of BMDMs engulfed at least 1 target 2 hours after initial challenge, whereas only 14% (± 5.0%; n = 10) of BMDMs engulfed targets 2 hours after rechallenge (supplemental Videos 1-8; data not shown). Importantly, we observed similar loss of phagocytic activity upon rechallenge with all macrophage types tested (hMDMs, BMDMs, mouse peritoneal macrophages), all target types tested (B cells and thymocytes), and 3 anti-mouse mAbs (αCD90.2, αCD90.1, αCD20) and 2 different therapeutic anti-human mAbs (αCD20 [RTX], αCD52 [ALM]; Figure 1I; data not shown). Importantly, this loss of phagocytic activity was dependent on prior engulfment of mAb-opsonized targets, because macrophages previously cultured with targets alone, targets plus nonspecific IgG, and Ab alone showed no inhibition of ADCP (supplemental Figure 1D). Moreover, the addition of 20 μg/mL of nonspecific IgG during these ADCP assays did not affect the phagocytosis of mAb-opsonized targets (supplemental Figure 2), suggesting that the presence of free IgG (as would be seen in vivo) has minimal effect on ADCP kinetics. These findings are consistent with data from our laboratory and others showing that high levels of endogenous IgG or IVIG have minimal effect on macrophage ADCP induced by therapeutic mAbs.20,27-29 We have adopted the term hypophagia to describe this state of reduced phagocytic activity, and additional analyses showed that the onset of hypophagia occurred within 30 minutes of ADCP (Figure 1J-K) and persisted for at least 24 hours in vitro (Figure 1L). It is noteworthy that the ADCP kinetics we observed with human and mouse macrophages in vitro were in accordance with clinical data showing that infusion with αCD20 or other lymphocyte-depleting mAbs can rapidly drive significant reductions in circulating target cell numbers, but this clearance is not sustained.13,14,30 Finally, the loss of phagocytic activity was not associated with changes in the viability or morphology of macrophages, nor was it associated with changes in the ability to interact with and bind mAb-opsonized target cells (supplemental Figure 1E; supplemental Videos 1, 3, 5, and 7). These observations demonstrate that macrophages have a finite ADCP capacity that is reached ∼30 minutes after initial engulfment and persists for many hours.
![Defining macrophage ADCP cytotoxic capacity in vitro and in vivo. (A) Representative live-cell epifluorescent images of TAMRA-SE–labeled BMDMs (red) showing engulfed targets as voids (left), detection of voids (middle, green), and detection of macrophages by masking (right, blue). Scale bar, 25 µm. (B) BMDMs were cocultured with thymocytes (orange) or splenic B cells (blue) at E:T of 1:10 and imaged for 10 minutes before addition of indicated mAbs (10 µg/mL final). Data shown are mean ± standard error of the mean (SEM; n = 3). (C) hMDM phagocytosis of CLL cells was carried out as in panel B using 10 μg/mL of the indicated mAbs (alemtuzumab [ALM], RTX). Data shown are mean ± SEM (n = 3). (D) Representative phase (upper) and epifluorescent (lower) images of CT Deep Red-labeled hMDM (violet) engorged 2 hours with αCD52-opsonized CLL cells (scale bar, 25 µm), and TAMRA-SE–labeled BMDM (red) engorged 2 hours with αCD90.2-opsonized thymocytes (scale bars, 25 µm). (E) BMDMs were cocultured with thymocytes for 2 hours in the absence (orange) or presence (crimson) of 10 µg/mL of αCD90.2. Free thymocytes and Ab were then washed away, and BMDMs were rechallenged with fresh thymocytes and 10 µg/mL of αCD90.2 for another 2 hours. Data shown are mean ± SEM (n = 6). (F) BMDM rechallenge assay performed as in panel E using splenic B cells opsonized with αCD20. Data shown are mean ± SEM (n = 3). (G) hMDMs were cocultured with CLL cells for 4 hours in the absence (light blue) or presence (dark blue) of 10 µg/mL of RTX. Free targets and Ab were then washed away, and hMDMs were rechallenged with fresh CLL cells and 10 µg/µL of RTX for another 4 hours. Data shown are mean ± SEM (n = 5). (H) hMDM rechallenge assay performed as in panel G using CLL cells opsonized with ALM. Data shown are mean ± SEM (n = 5). (I) BMDMs, hMDMs, and C57BL/6J pMacs were induced to undergo hypophagia and rechallenged with the indicated mAbs as in panels E and F, and the phagocytic index (relative void max) for each condition is shown for 3 to 5 independent experiments per condition. Data shown are mean ± SEM (n = 3; P values derived from unpaired 2-tailed Student t test). (J) BMDMs were cocultured with thymocytes and αCD90.2 for the times indicated on the x-axis. BMDMs were washed and rechallenged with fresh αCD90.2-opsonized thymocytes for 2 hours, and the phagocytic index was calculated for 3 to 4 per condition. Data shown are mean ± SEM (P values derived from unpaired 1-way analysis of variance [ANOVA] with multiple comparisons correction). (K) BMDMs cocultured with αCD20-opsonized B cells as in panel J. Data shown are mean ± SEM (n = 4; P values derived from unpaired 1-way ANOVA with multiple comparisons correction). (L) BMDMs cocultured with αCD90.2-opsonized thymocytes for 2 hours, washed, and cultured in fresh media to recover. At the indicated times, BMDMs were rechallenged with fresh αCD90.2-opsonized thymocytes for 2 hours, and the phagocytic index was calculated. Data shown are mean ± SEM (n = 3; P values derived from unpaired 2-tailed Student t test). (M) Flow cytometric analysis of KCs isolated from hCD2-iCre-tdTomato mice treated with or without 25 µg of αCD20 IV (clone 5D2). Top plots show representative data from analysis of KC engulfment of endogenous B cells (tdTomato+) at 6 hours. Lower panel shows time course of KC engulfment of B cells. Data shown are mean ± SEM (n = 2-3 mice per group). (N) Schematic of in vivo ADCP rechallenge experiment using hCD2-iCre-tdTomato mice. (O) hCD2-iCre-tdTomato mice were treated IV with 25 µg of αCD20 or not. Six hours later, both groups were then treated IV with 1 × 10⁷ splenic B cells from donor C57BL/6J mice labeled with eFluor670 and opsonized with 10 µg/mL of αCD20-opsonized before injection. Data shown are representative flow plots used to measure engulfment of tdTomato+ and/or eFlour670+ target cells by KCs 1 hour after injection of donor cells, with KCs gated on CD45+, Tim4hi, SSChi. (P) KC engulfment of donor B cells (n = 8-11 mice per treatment group). Data shown are mean ± SEM for 3 independent experiments. P values indicated on graphs derived from unpaired 2-tailed t test. *P < .05, **P < .01, ***P < .001, ****P < .0001.](https://ash.silverchair-cdn.com/ash/content_public/journal/blood/136/18/10.1182_blood.2020005571/3/m_bloodbld2020005571f1-1.png?Expires=1769091122&Signature=WEQgHpXDCvansBC-HWFBGuhwRRS630vZNybETEDhkfQ9reU6h4W1oEz1pWPNnBrCZ8TDZ~Zof0M8NA3cZoP3wQeomIm7tKtz0aCc80Kh0ct50-VALzE~kY9bo3Ce5WXlQdGZ2tP34RzWSYJLFTUvqUd2nGuodN5zx1aTuZaMJiOvvKD~PvDNbHPzcy8-2d2Lr2x0EWbXREu2gTFzDKVlKUTKxbMEDlgT8gWEqI8UezX9zjSMN~gptQfxkySfreneBRdLDfLXtA7DEwtMLpR8MC8EBlSRyxnRsCBHtX8aHsjCU5U2cb7RLThSHTH8~cTNJpn0JyyEsxcLVw37rUwWKA__&Key-Pair-Id=APKAIE5G5CRDK6RD3PGA)
![Defining macrophage ADCP cytotoxic capacity in vitro and in vivo. (A) Representative live-cell epifluorescent images of TAMRA-SE–labeled BMDMs (red) showing engulfed targets as voids (left), detection of voids (middle, green), and detection of macrophages by masking (right, blue). Scale bar, 25 µm. (B) BMDMs were cocultured with thymocytes (orange) or splenic B cells (blue) at E:T of 1:10 and imaged for 10 minutes before addition of indicated mAbs (10 µg/mL final). Data shown are mean ± standard error of the mean (SEM; n = 3). (C) hMDM phagocytosis of CLL cells was carried out as in panel B using 10 μg/mL of the indicated mAbs (alemtuzumab [ALM], RTX). Data shown are mean ± SEM (n = 3). (D) Representative phase (upper) and epifluorescent (lower) images of CT Deep Red-labeled hMDM (violet) engorged 2 hours with αCD52-opsonized CLL cells (scale bar, 25 µm), and TAMRA-SE–labeled BMDM (red) engorged 2 hours with αCD90.2-opsonized thymocytes (scale bars, 25 µm). (E) BMDMs were cocultured with thymocytes for 2 hours in the absence (orange) or presence (crimson) of 10 µg/mL of αCD90.2. Free thymocytes and Ab were then washed away, and BMDMs were rechallenged with fresh thymocytes and 10 µg/mL of αCD90.2 for another 2 hours. Data shown are mean ± SEM (n = 6). (F) BMDM rechallenge assay performed as in panel E using splenic B cells opsonized with αCD20. Data shown are mean ± SEM (n = 3). (G) hMDMs were cocultured with CLL cells for 4 hours in the absence (light blue) or presence (dark blue) of 10 µg/mL of RTX. Free targets and Ab were then washed away, and hMDMs were rechallenged with fresh CLL cells and 10 µg/µL of RTX for another 4 hours. Data shown are mean ± SEM (n = 5). (H) hMDM rechallenge assay performed as in panel G using CLL cells opsonized with ALM. Data shown are mean ± SEM (n = 5). (I) BMDMs, hMDMs, and C57BL/6J pMacs were induced to undergo hypophagia and rechallenged with the indicated mAbs as in panels E and F, and the phagocytic index (relative void max) for each condition is shown for 3 to 5 independent experiments per condition. Data shown are mean ± SEM (n = 3; P values derived from unpaired 2-tailed Student t test). (J) BMDMs were cocultured with thymocytes and αCD90.2 for the times indicated on the x-axis. BMDMs were washed and rechallenged with fresh αCD90.2-opsonized thymocytes for 2 hours, and the phagocytic index was calculated for 3 to 4 per condition. Data shown are mean ± SEM (P values derived from unpaired 1-way analysis of variance [ANOVA] with multiple comparisons correction). (K) BMDMs cocultured with αCD20-opsonized B cells as in panel J. Data shown are mean ± SEM (n = 4; P values derived from unpaired 1-way ANOVA with multiple comparisons correction). (L) BMDMs cocultured with αCD90.2-opsonized thymocytes for 2 hours, washed, and cultured in fresh media to recover. At the indicated times, BMDMs were rechallenged with fresh αCD90.2-opsonized thymocytes for 2 hours, and the phagocytic index was calculated. Data shown are mean ± SEM (n = 3; P values derived from unpaired 2-tailed Student t test). (M) Flow cytometric analysis of KCs isolated from hCD2-iCre-tdTomato mice treated with or without 25 µg of αCD20 IV (clone 5D2). Top plots show representative data from analysis of KC engulfment of endogenous B cells (tdTomato+) at 6 hours. Lower panel shows time course of KC engulfment of B cells. Data shown are mean ± SEM (n = 2-3 mice per group). (N) Schematic of in vivo ADCP rechallenge experiment using hCD2-iCre-tdTomato mice. (O) hCD2-iCre-tdTomato mice were treated IV with 25 µg of αCD20 or not. Six hours later, both groups were then treated IV with 1 × 10⁷ splenic B cells from donor C57BL/6J mice labeled with eFluor670 and opsonized with 10 µg/mL of αCD20-opsonized before injection. Data shown are representative flow plots used to measure engulfment of tdTomato+ and/or eFlour670+ target cells by KCs 1 hour after injection of donor cells, with KCs gated on CD45+, Tim4hi, SSChi. (P) KC engulfment of donor B cells (n = 8-11 mice per treatment group). Data shown are mean ± SEM for 3 independent experiments. P values indicated on graphs derived from unpaired 2-tailed t test. *P < .05, **P < .01, ***P < .001, ****P < .0001.](https://ash.silverchair-cdn.com/ash/content_public/journal/blood/136/18/10.1182_blood.2020005571/3/m_bloodbld2020005571f1-2.png?Expires=1769091122&Signature=enOHIvaNHl89CaX-~uPagNOk3kNhDH6aFuTPoLpqWppVBgYZ8INR29R9fOnzP0MF~pzzX8V3eY3NuRvEN8l34vU5qYsgAs1WcX-RRgjbFjkCnbO6ESwQxMyKcCJGdnpfpO2qsqWxZSgqhBQbn2tO47QHl7msUtGAoayEFwnC3rfLrh6R4vBEOIVqBRzCuzcRe3~54InSdEQHVVLWKcybZLGse1Qbn~--rDYtkHfQiyqEhjVgbW0R0RJmLXF2i45B-3W~VwiENy-S51GaNgWzd-eiIYJVjZ5zX1BckEHb~lRC7xtTyCbUrrAXRX6eC7nxPz53mHDo7GmyVaLoHtBx0g__&Key-Pair-Id=APKAIE5G5CRDK6RD3PGA)
Defining macrophage ADCP cytotoxic capacity in vitro and in vivo. (A) Representative live-cell epifluorescent images of TAMRA-SE–labeled BMDMs (red) showing engulfed targets as voids (left), detection of voids (middle, green), and detection of macrophages by masking (right, blue). Scale bar, 25 µm. (B) BMDMs were cocultured with thymocytes (orange) or splenic B cells (blue) at E:T of 1:10 and imaged for 10 minutes before addition of indicated mAbs (10 µg/mL final). Data shown are mean ± standard error of the mean (SEM; n = 3). (C) hMDM phagocytosis of CLL cells was carried out as in panel B using 10 μg/mL of the indicated mAbs (alemtuzumab [ALM], RTX). Data shown are mean ± SEM (n = 3). (D) Representative phase (upper) and epifluorescent (lower) images of CT Deep Red-labeled hMDM (violet) engorged 2 hours with αCD52-opsonized CLL cells (scale bar, 25 µm), and TAMRA-SE–labeled BMDM (red) engorged 2 hours with αCD90.2-opsonized thymocytes (scale bars, 25 µm). (E) BMDMs were cocultured with thymocytes for 2 hours in the absence (orange) or presence (crimson) of 10 µg/mL of αCD90.2. Free thymocytes and Ab were then washed away, and BMDMs were rechallenged with fresh thymocytes and 10 µg/mL of αCD90.2 for another 2 hours. Data shown are mean ± SEM (n = 6). (F) BMDM rechallenge assay performed as in panel E using splenic B cells opsonized with αCD20. Data shown are mean ± SEM (n = 3). (G) hMDMs were cocultured with CLL cells for 4 hours in the absence (light blue) or presence (dark blue) of 10 µg/mL of RTX. Free targets and Ab were then washed away, and hMDMs were rechallenged with fresh CLL cells and 10 µg/µL of RTX for another 4 hours. Data shown are mean ± SEM (n = 5). (H) hMDM rechallenge assay performed as in panel G using CLL cells opsonized with ALM. Data shown are mean ± SEM (n = 5). (I) BMDMs, hMDMs, and C57BL/6J pMacs were induced to undergo hypophagia and rechallenged with the indicated mAbs as in panels E and F, and the phagocytic index (relative void max) for each condition is shown for 3 to 5 independent experiments per condition. Data shown are mean ± SEM (n = 3; P values derived from unpaired 2-tailed Student t test). (J) BMDMs were cocultured with thymocytes and αCD90.2 for the times indicated on the x-axis. BMDMs were washed and rechallenged with fresh αCD90.2-opsonized thymocytes for 2 hours, and the phagocytic index was calculated for 3 to 4 per condition. Data shown are mean ± SEM (P values derived from unpaired 1-way analysis of variance [ANOVA] with multiple comparisons correction). (K) BMDMs cocultured with αCD20-opsonized B cells as in panel J. Data shown are mean ± SEM (n = 4; P values derived from unpaired 1-way ANOVA with multiple comparisons correction). (L) BMDMs cocultured with αCD90.2-opsonized thymocytes for 2 hours, washed, and cultured in fresh media to recover. At the indicated times, BMDMs were rechallenged with fresh αCD90.2-opsonized thymocytes for 2 hours, and the phagocytic index was calculated. Data shown are mean ± SEM (n = 3; P values derived from unpaired 2-tailed Student t test). (M) Flow cytometric analysis of KCs isolated from hCD2-iCre-tdTomato mice treated with or without 25 µg of αCD20 IV (clone 5D2). Top plots show representative data from analysis of KC engulfment of endogenous B cells (tdTomato+) at 6 hours. Lower panel shows time course of KC engulfment of B cells. Data shown are mean ± SEM (n = 2-3 mice per group). (N) Schematic of in vivo ADCP rechallenge experiment using hCD2-iCre-tdTomato mice. (O) hCD2-iCre-tdTomato mice were treated IV with 25 µg of αCD20 or not. Six hours later, both groups were then treated IV with 1 × 10⁷ splenic B cells from donor C57BL/6J mice labeled with eFluor670 and opsonized with 10 µg/mL of αCD20-opsonized before injection. Data shown are representative flow plots used to measure engulfment of tdTomato+ and/or eFlour670+ target cells by KCs 1 hour after injection of donor cells, with KCs gated on CD45+, Tim4hi, SSChi. (P) KC engulfment of donor B cells (n = 8-11 mice per treatment group). Data shown are mean ± SEM for 3 independent experiments. P values indicated on graphs derived from unpaired 2-tailed t test. *P < .05, **P < .01, ***P < .001, ****P < .0001.
Defining macrophage ADCP cytotoxic capacity in vitro and in vivo. (A) Representative live-cell epifluorescent images of TAMRA-SE–labeled BMDMs (red) showing engulfed targets as voids (left), detection of voids (middle, green), and detection of macrophages by masking (right, blue). Scale bar, 25 µm. (B) BMDMs were cocultured with thymocytes (orange) or splenic B cells (blue) at E:T of 1:10 and imaged for 10 minutes before addition of indicated mAbs (10 µg/mL final). Data shown are mean ± standard error of the mean (SEM; n = 3). (C) hMDM phagocytosis of CLL cells was carried out as in panel B using 10 μg/mL of the indicated mAbs (alemtuzumab [ALM], RTX). Data shown are mean ± SEM (n = 3). (D) Representative phase (upper) and epifluorescent (lower) images of CT Deep Red-labeled hMDM (violet) engorged 2 hours with αCD52-opsonized CLL cells (scale bar, 25 µm), and TAMRA-SE–labeled BMDM (red) engorged 2 hours with αCD90.2-opsonized thymocytes (scale bars, 25 µm). (E) BMDMs were cocultured with thymocytes for 2 hours in the absence (orange) or presence (crimson) of 10 µg/mL of αCD90.2. Free thymocytes and Ab were then washed away, and BMDMs were rechallenged with fresh thymocytes and 10 µg/mL of αCD90.2 for another 2 hours. Data shown are mean ± SEM (n = 6). (F) BMDM rechallenge assay performed as in panel E using splenic B cells opsonized with αCD20. Data shown are mean ± SEM (n = 3). (G) hMDMs were cocultured with CLL cells for 4 hours in the absence (light blue) or presence (dark blue) of 10 µg/mL of RTX. Free targets and Ab were then washed away, and hMDMs were rechallenged with fresh CLL cells and 10 µg/µL of RTX for another 4 hours. Data shown are mean ± SEM (n = 5). (H) hMDM rechallenge assay performed as in panel G using CLL cells opsonized with ALM. Data shown are mean ± SEM (n = 5). (I) BMDMs, hMDMs, and C57BL/6J pMacs were induced to undergo hypophagia and rechallenged with the indicated mAbs as in panels E and F, and the phagocytic index (relative void max) for each condition is shown for 3 to 5 independent experiments per condition. Data shown are mean ± SEM (n = 3; P values derived from unpaired 2-tailed Student t test). (J) BMDMs were cocultured with thymocytes and αCD90.2 for the times indicated on the x-axis. BMDMs were washed and rechallenged with fresh αCD90.2-opsonized thymocytes for 2 hours, and the phagocytic index was calculated for 3 to 4 per condition. Data shown are mean ± SEM (P values derived from unpaired 1-way analysis of variance [ANOVA] with multiple comparisons correction). (K) BMDMs cocultured with αCD20-opsonized B cells as in panel J. Data shown are mean ± SEM (n = 4; P values derived from unpaired 1-way ANOVA with multiple comparisons correction). (L) BMDMs cocultured with αCD90.2-opsonized thymocytes for 2 hours, washed, and cultured in fresh media to recover. At the indicated times, BMDMs were rechallenged with fresh αCD90.2-opsonized thymocytes for 2 hours, and the phagocytic index was calculated. Data shown are mean ± SEM (n = 3; P values derived from unpaired 2-tailed Student t test). (M) Flow cytometric analysis of KCs isolated from hCD2-iCre-tdTomato mice treated with or without 25 µg of αCD20 IV (clone 5D2). Top plots show representative data from analysis of KC engulfment of endogenous B cells (tdTomato+) at 6 hours. Lower panel shows time course of KC engulfment of B cells. Data shown are mean ± SEM (n = 2-3 mice per group). (N) Schematic of in vivo ADCP rechallenge experiment using hCD2-iCre-tdTomato mice. (O) hCD2-iCre-tdTomato mice were treated IV with 25 µg of αCD20 or not. Six hours later, both groups were then treated IV with 1 × 10⁷ splenic B cells from donor C57BL/6J mice labeled with eFluor670 and opsonized with 10 µg/mL of αCD20-opsonized before injection. Data shown are representative flow plots used to measure engulfment of tdTomato+ and/or eFlour670+ target cells by KCs 1 hour after injection of donor cells, with KCs gated on CD45+, Tim4hi, SSChi. (P) KC engulfment of donor B cells (n = 8-11 mice per treatment group). Data shown are mean ± SEM for 3 independent experiments. P values indicated on graphs derived from unpaired 2-tailed t test. *P < .05, **P < .01, ***P < .001, ****P < .0001.
Therapeutic mAbs targeting the B-cell–restricted surface antigen CD20 are highly effective at clearing B cells and have revolutionized the treatment of B-cell malignancies and autoimmune diseases.31-33 However, these mAbs are not always curative, in part because of therapeutic resistance. Recently, ADCP by KCs was established as the principle cytotoxic mechanism underlying the clearance of B cells by therapeutic αCD20 mAbs, including RTX, ofatumumab, and obinutuzumab.3-5 To understand the physiologic importance of macrophage hypophagia in ADCP-mediated cell clearance, we established a mouse model that allowed us to track the engulfment of B cells by KCs in vivo after IV administration of a preclinical anti-mouse αCD20 mAb (clone 5D2). The Ai91 mouse strain carrying a flox-stop-flox-tdTomato cassette in the Rosa26 locus was crossed to the hCD2-iCre strain to generate mice expressing tdTomato fluorescent protein selectively in T and B lymphocytes (supplemental Figure 3A).34 In agreement with previous studies,3-5 αCD20 treatment caused a rapid and robust loss of circulating B cells (>80% reduction) within 1 hour that was sustained over a 48-hour period (supplemental Figure 3B). Similarly, we observed a significant depletion of B cells in the spleen and liver by 6 and 16 hours, respectively (supplemental Figure 3B). We then measured B-cell engulfment by KCs in hCD2-iCre/tdTomato mice treated with 25 μg of αCD20 for up to 16 hours. KCs (defined as CD45+/Tim4hi/SSChi) isolated from mice were analyzed by flow cytometry to measure KCs that had (tdTomato+) or did not have (tdTomato−) engulfed B cells. As shown in Figure 1M, 8.8% of KCs were tdTomato+ in untreated mice, whereas mice receiving αCD20 showed a rapid increase in tdTomato+ KCs that peaked at 37% at 6 hours. To test whether KCs undergo hypophagia in vivo in this model, hCD2-iCre/tdTomato mice were first treated with αCD20 for 6 hours and subsequently given fluorescently labeled WT splenic B cells that had been opsonized with αCD20 ex vivo before IV injection (Figure 1N). We found that, compared with untreated mice, KCs from mice first treated with αCD20 showed significantly impaired engulfment of mAb-opsonized donor B cells (Figure 1O-P). Therefore, these in vitro and in vivo results demonstrate for the first time that macrophage Ab-mediated phagocytic capacity is finite and that this limitation can affect the efficacy of cell clearance–inducing mAbs.
In addition to ADCP, macrophages play a vital role in Ab-independent forms of phagocytosis, including the phagocytic clearance of apoptotic cells (efferocytosis).35 Because Erwig et al18 previously showed that sequential challenges of macrophages with apoptotic targets led to decreased efferocytic potential, we were interested in whether ADCP-induced hypophagia would also lead to a defect in efferocytosis. To test this, BMDMs were cocultured with thymocytes in the presence or absence of αCD90.2 for 2 hours to induce ADCP and, after washing, were subsequently rechallenged with αCD90.2-opsonized thymocytes or apoptotic thymocytes generated by 4-hour treatment with dexamethasone (supplemental Figure 3C). Although macrophages showed a near-complete inability to engulf mAb-opsonized thymocytes on rechallenge, no defect in their ability to engulf apoptotic cells was detected, either by void accumulation or target dye uptake (Figure 2A-B; data not shown). These results show that ADCP-induced hypophagia is specific to Ab-mediated engulfment.
![ADCP-induced hypophagia does not reflect a global change in macrophage phagocytic capacity. (A) BMDMs were cocultured with thymocytes ± anti-CD90.2 for 2 hours. After washing to remove free thymocytes and mAb, BMDMs were rechallenged for 2 hours with apoptotic thymocytes, and the phagocytic index was calculated using void detection as in Figure 1E. Data shown are mean ± SEM (n = 5 experiments). (B) BMDM phagocytosis of mAb-opsonized and apoptotic thymocytes, as described in panel A. Data shown are mean ± SEM (n = 5; P values derived from unpaired 1-way analysis of variance [ANOVA] with multiple comparisons correction). (C) BMDMs were initially cocultured ± αCD90.2-opsonized thymocytes followed by washing and rechallenged with αCD90.2-opsonized thymocytes and total BMDM lysates analyzed for levels of phosphorylated Syk (pSyk, Y525/Y526) and total Syk by western blotting. Top panel shows representative western blot image. Lower graph shows densitometry quantification of the pSyk/Syk ratio comparing unfed and hypophagic BMDMs. Data shown are mean ± SEM (n = 4; P values derived from unpaired 2-tailed Student t test). (D) BMDMs were initially challenged with indicated mAb/target cells for 2 hours and, after washing, subsequently rechallenged with the indicated mAb/target cells for 2 hours, and relative phagocytosis was calculated. Data shown are mean ± SEM (n = 4; P values derived from unpaired 1-way ANOVA with multiple comparisons correction). (E) Relative messenger RNA (mRNA) levels for FcγRs and common γ chain (Fcer1g) were measured by quantitative reverse transcription polymerase chain reaction from BMDMs incubated with αCD90.2-opsonized targets for the indicated times. Data shown are mean ± SEM (n = 6). Unpaired 1-way ANOVA with multiple comparisons correction revealed no significant differences in Fcγ expression. *P < .05, **P < .01, ***P < .001. ns, not significant.](https://ash.silverchair-cdn.com/ash/content_public/journal/blood/136/18/10.1182_blood.2020005571/3/m_bloodbld2020005571f2.png?Expires=1769091122&Signature=fcc6NwgVb-rnhsaKvKNriSaj9uOfmYn6Z5O30GwvfyovJylUw8hzZlopFkieyCkGkTlrjQkTuXKVXpSJ0NsK7oKfOyXBuJ3p-l~fcZ68PN8veChRT93KWUGotRyDTYHBK5n5Ukb0rXWgxRAI7g9FGacmkvR~aYs8d5TMnGeGcsU2zsD-6FVciOynVLGMcegelZscfUrfUcodTG19TyFscfJvjP87jaHUvDn2iUalTayTU-zm14aIK6tMEQDTRmojQRmrHxsqzeDlYnvEpjvchoYzWpK6czT-zNj3h1wjB2tspBxmuZprSpMz0Z6aRnKC~iq0gL0GCzaUsC4SMgnptA__&Key-Pair-Id=APKAIE5G5CRDK6RD3PGA)
ADCP-induced hypophagia does not reflect a global change in macrophage phagocytic capacity. (A) BMDMs were cocultured with thymocytes ± anti-CD90.2 for 2 hours. After washing to remove free thymocytes and mAb, BMDMs were rechallenged for 2 hours with apoptotic thymocytes, and the phagocytic index was calculated using void detection as in Figure 1E. Data shown are mean ± SEM (n = 5 experiments). (B) BMDM phagocytosis of mAb-opsonized and apoptotic thymocytes, as described in panel A. Data shown are mean ± SEM (n = 5; P values derived from unpaired 1-way analysis of variance [ANOVA] with multiple comparisons correction). (C) BMDMs were initially cocultured ± αCD90.2-opsonized thymocytes followed by washing and rechallenged with αCD90.2-opsonized thymocytes and total BMDM lysates analyzed for levels of phosphorylated Syk (pSyk, Y525/Y526) and total Syk by western blotting. Top panel shows representative western blot image. Lower graph shows densitometry quantification of the pSyk/Syk ratio comparing unfed and hypophagic BMDMs. Data shown are mean ± SEM (n = 4; P values derived from unpaired 2-tailed Student t test). (D) BMDMs were initially challenged with indicated mAb/target cells for 2 hours and, after washing, subsequently rechallenged with the indicated mAb/target cells for 2 hours, and relative phagocytosis was calculated. Data shown are mean ± SEM (n = 4; P values derived from unpaired 1-way ANOVA with multiple comparisons correction). (E) Relative messenger RNA (mRNA) levels for FcγRs and common γ chain (Fcer1g) were measured by quantitative reverse transcription polymerase chain reaction from BMDMs incubated with αCD90.2-opsonized targets for the indicated times. Data shown are mean ± SEM (n = 6). Unpaired 1-way ANOVA with multiple comparisons correction revealed no significant differences in Fcγ expression. *P < .05, **P < .01, ***P < .001. ns, not significant.
ADCP-induced hypophagia does not reflect a global change in macrophage phagocytic capacity. (A) BMDMs were cocultured with thymocytes ± anti-CD90.2 for 2 hours. After washing to remove free thymocytes and mAb, BMDMs were rechallenged for 2 hours with apoptotic thymocytes, and the phagocytic index was calculated using void detection as in Figure 1E. Data shown are mean ± SEM (n = 5 experiments). (B) BMDM phagocytosis of mAb-opsonized and apoptotic thymocytes, as described in panel A. Data shown are mean ± SEM (n = 5; P values derived from unpaired 1-way analysis of variance [ANOVA] with multiple comparisons correction). (C) BMDMs were initially cocultured ± αCD90.2-opsonized thymocytes followed by washing and rechallenged with αCD90.2-opsonized thymocytes and total BMDM lysates analyzed for levels of phosphorylated Syk (pSyk, Y525/Y526) and total Syk by western blotting. Top panel shows representative western blot image. Lower graph shows densitometry quantification of the pSyk/Syk ratio comparing unfed and hypophagic BMDMs. Data shown are mean ± SEM (n = 4; P values derived from unpaired 2-tailed Student t test). (D) BMDMs were initially challenged with indicated mAb/target cells for 2 hours and, after washing, subsequently rechallenged with the indicated mAb/target cells for 2 hours, and relative phagocytosis was calculated. Data shown are mean ± SEM (n = 4; P values derived from unpaired 1-way ANOVA with multiple comparisons correction). (E) Relative messenger RNA (mRNA) levels for FcγRs and common γ chain (Fcer1g) were measured by quantitative reverse transcription polymerase chain reaction from BMDMs incubated with αCD90.2-opsonized targets for the indicated times. Data shown are mean ± SEM (n = 6). Unpaired 1-way ANOVA with multiple comparisons correction revealed no significant differences in Fcγ expression. *P < .05, **P < .01, ***P < .001. ns, not significant.
We next investigated potential signaling defects underlying ADCP hypophagia. Phosphorylation and activation of the tyrosine kinase Syk are essential for signaling phagocytosis downstream of FcγR engagement.36 Accordingly, we found that hypophagic macrophages showed significantly reduced Syk phosphorylation upon rechallenge with fresh mAb-opsonized targets (Figure 2C). Moreover, the defect in FcγR-mediated engulfment was not restricted to specific mAb-antigen combinations, because we found that macrophages first challenged with αCD90.2-opsonized thymocytes showed a significant decrease in phagocytosis upon rechallenge with αCD20-opsonized B cells (Figure 2D left). Similarly, BMDMs first challenged with αCD20-opsonized B cells showed a significant reduction in their capacity to engulf αCD90.2-opsonized thymocytes on second challenge (Figure 2D right). Interestingly, the magnitude of αCD20-induced hypophagia was less than that seen with αCD90.2, possibly because of the 2-3-fold higher levels of ADCP induced by αCD90.2 compared with αCD20 (compare phagocytic indices of Figure 1E-F). Together, these results show that hypophagia induced by ADCP is associated with defective FcγR signaling.
We then considered that defective FcγR signaling in hypophagic macrophages could be caused by soluble factors, such as cytokines, growth factors, or chemokines, generated during ADCP. However, supernatants collected from macrophage ADCP cocultures at different times, when applied to unfed macrophages, did not impair ADCP (supplemental Figure 4A). This led us to consider whether changes in FcγR gene expression during ADCP could explain the loss of phagocytic activity. We therefore measured messenger RNA levels of all 4 FcγRs (Fcgr1, Fcgr2, Fcgr3, Fcgr4) and the common Fcγ chain (Fcer1g) in BMDMs at different times during ADCP coculture but found no significant changes in expression of these receptors (Figure 2E). Considering these findings, combined with the observation that hypophagia onset occurs within 30 minutes of ADCP, we conclude that changes in gene expression, although possibly playing roles in other aspects of macrophage function after ADCP, were unlikely to be key factors in the onset of hypophagia.
Although FcγRs messenger RNA levels were unchanged during ADCP and hypophagia (Figure 2E), we considered the possibility that posttranslational changes could modulate FcγR surface expression during hypophagia. To measure FcγR surface levels after ADCP, BMDMs were stained with Abs specific for each of the 4 mouse FcγRs (FcγRI, FcγRIIb, FcγRIII, and FcγRIV). Strikingly, all 4 FcγRs were significantly decreased at the cell surface by 30 minutes after initiation of ADCP, and this decrease persisted for at least 4 hours (Figure 3A); furthermore, the decreased receptor levels were not observed when anti-CD90.2 alone was added in the absence of thymocytes, showing that the reduction was not a result of mAb-induced FcγR internalization or interference of the mAb with FcγR detection Abs (Figure 3A empty bars). These results agree with earlier studies performed by Mellman et al,37 who showed that internalization of IgG-coated erythrocytes led to significant loss of FcγR at the cell surface. However, these studies were performed before the subtypes of FcγR were fully characterized and focused on the trypsin-resistant subtypes, which do not include FcγRI, and therefore, further investigation was needed to determine whether specific FcγR types were downregulated. Similar results were seen in hMDMs, where significant decreases in FcγRI, FcγRIIb, FcγRIIa/b, and FcγRIIIa were observed after induction of ADCP (Figure 3B; supplemental Figure 4B). To control for possible global changes in the levels of surface proteins, we measured the expression of another surface receptor involved in Ab-dependent phagocytosis, the complement receptor CD11b/CR3, and found no changes in surface levels of this marker after ADCP in BMDMs or hMDMs (Figure 3C-D). When surface levels of the activating FcγRI and the inhibitory FcγRIIb were measured over a 48-hour period after ADCP, we found that FcγRI and FcγRIIb levels were significantly reduced up to 24 hours but returned to unfed levels by 48 hours (Figure 3E; supplemental Figure 5). Interestingly, when we compared the relative change in FcγRI and FcγRIIb during this time course, we found that surface levels of the inhibitory FcγRIIb were modestly but significantly higher than FcγRI at the 0- and 24-hour points of hypophagia (Figure 3F). Finally, to determine whether similar changes in FcγR surface levels accompanied ADCP in vivo, we carried out flow cytometric analysis of KCs isolated from hCD2-iCre/tdTomato mice injected with αCD20. As shown in Figure 3F, FcγRI and FcγRIIb were readily detectable on KCs from untreated mice. However, KCs from mice treated with αCD20 showed a marked decreased in FcγRI and FcγRIIb, with the decrease being more prominent in KCs that had engulfed B cells (tdTomato+; Figure 3F-G). Taken together, these data, along with the in vitro and in vivo functional studies (Figure 1J-P), strongly suggest that hypophagia is caused by the rapid and persistent loss of FcRs from the surface of the macrophages engulfing targets by ADCP.
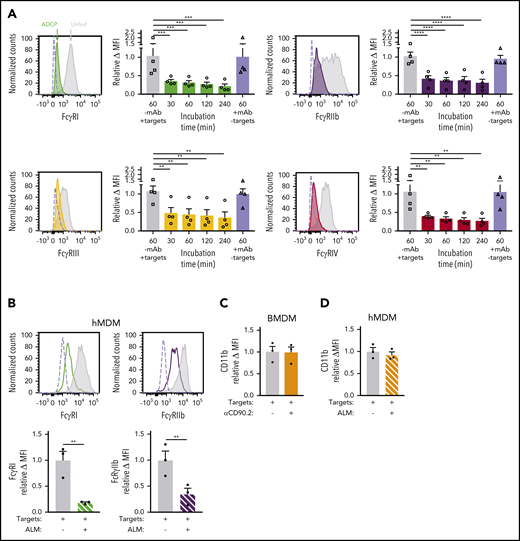
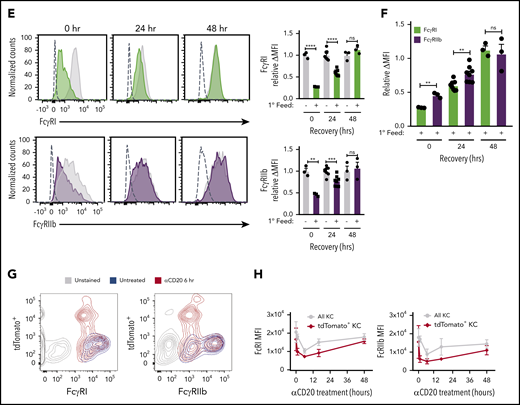
ADCP-induced hypophagia is associated with rapid loss and differential reexpression of surface FcγRs. (A) Surface levels of indicated FcγRs were measured by flow cytometry at various times after coculture with thymocytes ± αCD90.2 to induce hypophagia. Representative histograms (left panels) show surface levels of the FcγRs on unfed (gray) and hypophagic (color) BMDMs after 2-hour coculture with thymocytes ± αCD90.2. Unstained control shown as dashed line. Graphs to the right of each histogram show relative mean fluorescence intensity (MFI) of each FcγR at different times after feeding BMDMs with αCD90.2-opsonized thymocytes. Data shown are mean ± standard error of the mean (SEM; n = 4; P values derived from unpaired 1-way analysis of variance with multiple comparisons correction). Gray and blue bars indicate BMDM surface levels on BMDMs cocultured with thymocytes without mAb or mAb without thymocytes, respectively. (B) Flow cytometric analysis of FcγRI and FcγRIIb surface levels on hMDMs cocultured with CLL cells in the absence (gray) or presence (color) of ALM mAb for 2 hours. Unstained control shown as dashed line. Graphs below show quantification of relative MFI for each receptor. Data shown are mean ± SEM (n = 3; P values derived from unpaired 2-tailed Student t test). (C) Flow cytometric analysis of CD11b surface levels on BMDMs after 2-hour coculture with thymocytes and αCD90.2 (n = 3; P values derived from unpaired 2-tailed Student t test). (D) Flow cytometric analysis of CD11b surface levels on hMDMs after 2-hour coculture with CLL cells and ALM mAb (n = 3; P values derived from unpaired 2-tailed Student t test). (E) BMDMs were cocultured with thymocytes ± anti-CD90.2 for 2 hours to induce hypophagia; targets and free Ab were then washed away and BMDMs cultured in fresh medium for 0 to 48 hours. Surface levels of FcγRI and FcγRIIb were measured by flow cytometry at the indicated times. Unstained control shown as dashed line. Representative histograms (left) and MFI quantification of FcγRI and FcγRIIb levels relative to unfed BMDM (right) are shown. Data shown are mean ± SEM (n = 3-6; P values derived from unpaired 2-tailed Student t test). (F) Relative surface levels of FcγRI and FcγRIIb from panel E for anti-CD90.2 conditions from 0-, 24-, and 48-hour time points were compared. Data shown are mean ± SEM (n = 3-6; P values derived from unpaired 2-tailed Student t test). (G) Representative flow cytometric analysis of FcγRI and FcγRIIb surface levels on KCs isolated from hCD2-iCre-tdTomato mice treated for 6 hours with 25 µg of αCD20 IV (red) or not (blue). Unstained KCs from untreated mice are shown in gray. (H) Quantification of FcγRI and FcγRIIb levels on KCs from f (n = 3 mice per group). **P < .01, ***P < .001, ****P < .0001. ns, not significant.
ADCP-induced hypophagia is associated with rapid loss and differential reexpression of surface FcγRs. (A) Surface levels of indicated FcγRs were measured by flow cytometry at various times after coculture with thymocytes ± αCD90.2 to induce hypophagia. Representative histograms (left panels) show surface levels of the FcγRs on unfed (gray) and hypophagic (color) BMDMs after 2-hour coculture with thymocytes ± αCD90.2. Unstained control shown as dashed line. Graphs to the right of each histogram show relative mean fluorescence intensity (MFI) of each FcγR at different times after feeding BMDMs with αCD90.2-opsonized thymocytes. Data shown are mean ± standard error of the mean (SEM; n = 4; P values derived from unpaired 1-way analysis of variance with multiple comparisons correction). Gray and blue bars indicate BMDM surface levels on BMDMs cocultured with thymocytes without mAb or mAb without thymocytes, respectively. (B) Flow cytometric analysis of FcγRI and FcγRIIb surface levels on hMDMs cocultured with CLL cells in the absence (gray) or presence (color) of ALM mAb for 2 hours. Unstained control shown as dashed line. Graphs below show quantification of relative MFI for each receptor. Data shown are mean ± SEM (n = 3; P values derived from unpaired 2-tailed Student t test). (C) Flow cytometric analysis of CD11b surface levels on BMDMs after 2-hour coculture with thymocytes and αCD90.2 (n = 3; P values derived from unpaired 2-tailed Student t test). (D) Flow cytometric analysis of CD11b surface levels on hMDMs after 2-hour coculture with CLL cells and ALM mAb (n = 3; P values derived from unpaired 2-tailed Student t test). (E) BMDMs were cocultured with thymocytes ± anti-CD90.2 for 2 hours to induce hypophagia; targets and free Ab were then washed away and BMDMs cultured in fresh medium for 0 to 48 hours. Surface levels of FcγRI and FcγRIIb were measured by flow cytometry at the indicated times. Unstained control shown as dashed line. Representative histograms (left) and MFI quantification of FcγRI and FcγRIIb levels relative to unfed BMDM (right) are shown. Data shown are mean ± SEM (n = 3-6; P values derived from unpaired 2-tailed Student t test). (F) Relative surface levels of FcγRI and FcγRIIb from panel E for anti-CD90.2 conditions from 0-, 24-, and 48-hour time points were compared. Data shown are mean ± SEM (n = 3-6; P values derived from unpaired 2-tailed Student t test). (G) Representative flow cytometric analysis of FcγRI and FcγRIIb surface levels on KCs isolated from hCD2-iCre-tdTomato mice treated for 6 hours with 25 µg of αCD20 IV (red) or not (blue). Unstained KCs from untreated mice are shown in gray. (H) Quantification of FcγRI and FcγRIIb levels on KCs from f (n = 3 mice per group). **P < .01, ***P < .001, ****P < .0001. ns, not significant.
Previous studies have shown that engagement of FcγRs by multivalent ligands (eg, IgG complexes) can result in internalization of these receptors into phagosomes along with the antibody-bound cargo.37,38 However, the fate of internalized FcγRs, whether recycled back to the surface or degraded via the phagolysosome, is dependent on several poorly understood factors and is largely reliant upon FcγR subtype.38,39 Furthermore, although it has been shown that Fc fusion proteins can induce FcγR downregulation and lead to impaired ADCP,40 the functional impact and specific FcγR trafficking accompanying ADCP of mAb-opsonized target cells remain to be elucidated. To address this, we examined whether the loss of surface FcγRs seen in our models of ADCP corresponded to an intracellular accumulation of FcγRs. Levels of surface and intracellular FcγRI and FcγRIIb were compared on unfed and hypophagic BMDMs at various times after ADCP by flow cytometry. Whereas surface levels of both FcγRI and FcγRIIb were decreased by >90% in ADCP-fed macrophages compared with unfed (Figure 4A-B; supplemental Figure 6), we did not detect a significant accumulation of internalized FcγRI by intracellular staining or flow cytometry (Figure 4A). By contrast, the total level of FcγRIIb (ie, surface plus intracellular) in ADCP+ macrophages showed a significant increase compared with all other samples tested (Figure 4B). These results are consistent with previous studies showing internalization of FcγRIIb (which does not associate with the common Fcγ chain) results in shunting of this receptor to recycling endosomes that ultimately return this receptor to the cell surface.38,40 FcγRI, by contrast, which requires noncovalent association with the common γ chain for surface expression and signaling, was not recycled to the surface, nor did it accumulate significantly in the cytosol (Figure 4A). These results raised the possibility that FcγRI was preferentially degraded upon internalization during ADCP. To confirm this, we measured total levels of FcγRI and FcγRIIb by western blotting of whole-cell lysates from unfed and ADCP-fed BMDMs. Indeed, within 2 hours of ADCP, total levels of FcγRI were significantly decreased, whereas the total levels of FcγRIIb, relative to the loading control, were not changed in the same samples (Figure 4C). Note that Syk was used as a loading control in these experiments because BMDMs express Syk, but thymocytes do not (data not shown),41 thus avoiding the contribution of proteins derived from engulfed thymocytes in our lysates, which would have confounded our ability to normalize FcR levels to a BMDM-only loading control. To determine the potential importance of phagolysosomal processing and proteasomal degradation in selective loss of FcγRI, BMDMs were treated with bafilomycin A1 to disrupt lysosomal acidification or with proteasome inhibitor MG132. Treatment with MG132 or bafilomycin A1 caused a significant restoration of total FcγRI levels in hypophagic BMDMs, although neither inhibitor significantly affected FcγRIIb levels (Figure 4C-D). Because blocking the proteasome restored FcγRI levels (Figure 4C), we examined K48 ubiquitination of FcγRI immunoprecipitated from unfed and hypophagic BMDMs. As shown in Figure 4E, K48 ubiquitination of FcγRI was detected in hypophagic but not unfed BMDMs pretreated with MG132. Based on these results, we conclude that ADCP hypophagia is associated with the sustained loss of the activating FcγRI and that this loss is due to internalization, phagolysosomal processing, and proteasomal degradation of FcγRI during ADCP. Furthermore, our data suggest that the long-term persistence of hypophagia is due to the differential trafficking and processing of FcγRI and FcγRIIb after receptor internalization.
![Selective internalization and proteasomal degradation of FcγRI in hypophagic macrophages. (A) BMDMs were cocultured with thymocytes ± αCD90.2 for 2 hours to induce hypophagia and analyzed by intracellular staining and flow cytometry to measure surface and total (surface + intracellular) levels of FcγRI. Data shown are mean ± standard error of the mean (SEM; n = 3; P values derived from unpaired 1-way analysis of variance [ANOVA]). (B) BMDMs were treated as in panel A and analyzed for FcγRIIb levels. Data shown are mean ± SEM (n = 3; P values derived from unpaired 1-way ANOVA). (C) Total levels of FcγRI were measured by western blotting of total lysates from BMDMs cocultured with thymocytes ± αCD90.2 (ADCP) for the indicated times. Pretreatment with bafilomycin A1 (Baf; 100 nM) and MG132 (MG; 25 μM) for 3 hours before addition of mAb. Representative western blot image (top) and densitometry quantification of FcγRI levels (normalized to total Syk) are shown below. Data shown are mean ± SEM (n = 4; P values derived from unpaired 1-way ANOVA with multiple comparisons correction). (D) Total levels of FcγRIIb were analyzed as in panel C. Representative western blot image (top) and densitometry quantification of FcγRIIb levels (normalized to total Syk) are shown below. Data shown are mean ± SEM (n = 4; P values derived from unpaired 1-way ANOVA with multiple comparisons correction). (E) BMDMs were pretreated for 3 hours ± 25 μM of MG132 before coculture with thymocytes ± αCD90.2 for 2 hours to induce hypophagia. FcγRI was immunoprecipitated from BMDM total lysates and analyzed by western blotting with indicated Abs. Representative blot of 5 experiments is shown. Arrow indicates FcγRI band. (F) ADCP assay was performed on BMDMs pretreated ± 25 μM of MG132 for 3 hours before addition of thymocytes and αCD90.2 as described in Figure 1E. Relative phagocytosis quantification for both the initial and secondary challenges is shown in lower graphs (n = 4). Data shown are mean ± SEM (P values derived from unpaired 2-tailed Student t test [initial challenge] and unpaired 1-way ANOVA with multiple comparisons correction [secondary challenge]). (G) BMDMs were induced to undergo hypophagia for 2 hours, washed, and cultured for 24 hours ± recombinant IFN-γ (50 ng/mL) or C5a (50 ng/mL) before rechallenge with thymocytes ± αCD90.2 for 4 hours, and ADCP was measured by live-cell imaging as in Figure 1E. Representative data from 1 of 3 independent experiments are shown. (H) Quantification of ADCP rechallenge experiments in panel G. Data shown are mean ± SEM (n = 3; P values derived from unpaired 1-way ANOVA with multiple comparisons correction). (I) Surface levels of FcγRI on BMDMs from experiments in panels G and H were analyzed by flow cytometry. Data shown are mean ± SEM (n = 3; P values derived from unpaired 1-way ANOVA with multiple comparisons correction). (J) Surface levels of FcγRIIb on BMDMs from experiments in panels G and H were analyzed by flow cytometry. Data shown are mean ± SEM (n = 3; P values derived from unpaired 1-way ANOVA with multiple comparisons correction; differences observed between groups were not significant [ns]). *P < .05, **P < .01, ***P < .001, ****P < .0001. MFI, mean fluorescence intensity.](https://ash.silverchair-cdn.com/ash/content_public/journal/blood/136/18/10.1182_blood.2020005571/3/m_bloodbld2020005571f4.png?Expires=1769091122&Signature=DUhZ3ckhko7rMA489ZqHjwBe2DkTvZ2BSlLkas6Y0wDMoupIVy6AcbguQvUxr9J3fFSatNGQD3GpWKxrcaJcfdp~HYxD9Hu4HCCRchFvCf0KXTI8kQYyGJUeL2PaZBtKX-ZtB4a1MH0IGZV~SeG1p0feiJVR9DsQezqpIyUntVTw5UIuY72eWaA9w1Y21btzSDdi~m2apSdw1OKa9ak039kc4yhSpnmmUgtaQJTVOXHWBa1h1LbM22j8SzGhIMeR-GOuiTDuLJA1KRcA7OePsZQYP2n8BcwR91QKG9qRjrC5ohiLjZL58suM3n77SHTJRJ6BvgXhWCrjZuPtUb40Ow__&Key-Pair-Id=APKAIE5G5CRDK6RD3PGA)
Selective internalization and proteasomal degradation of FcγRI in hypophagic macrophages. (A) BMDMs were cocultured with thymocytes ± αCD90.2 for 2 hours to induce hypophagia and analyzed by intracellular staining and flow cytometry to measure surface and total (surface + intracellular) levels of FcγRI. Data shown are mean ± standard error of the mean (SEM; n = 3; P values derived from unpaired 1-way analysis of variance [ANOVA]). (B) BMDMs were treated as in panel A and analyzed for FcγRIIb levels. Data shown are mean ± SEM (n = 3; P values derived from unpaired 1-way ANOVA). (C) Total levels of FcγRI were measured by western blotting of total lysates from BMDMs cocultured with thymocytes ± αCD90.2 (ADCP) for the indicated times. Pretreatment with bafilomycin A1 (Baf; 100 nM) and MG132 (MG; 25 μM) for 3 hours before addition of mAb. Representative western blot image (top) and densitometry quantification of FcγRI levels (normalized to total Syk) are shown below. Data shown are mean ± SEM (n = 4; P values derived from unpaired 1-way ANOVA with multiple comparisons correction). (D) Total levels of FcγRIIb were analyzed as in panel C. Representative western blot image (top) and densitometry quantification of FcγRIIb levels (normalized to total Syk) are shown below. Data shown are mean ± SEM (n = 4; P values derived from unpaired 1-way ANOVA with multiple comparisons correction). (E) BMDMs were pretreated for 3 hours ± 25 μM of MG132 before coculture with thymocytes ± αCD90.2 for 2 hours to induce hypophagia. FcγRI was immunoprecipitated from BMDM total lysates and analyzed by western blotting with indicated Abs. Representative blot of 5 experiments is shown. Arrow indicates FcγRI band. (F) ADCP assay was performed on BMDMs pretreated ± 25 μM of MG132 for 3 hours before addition of thymocytes and αCD90.2 as described in Figure 1E. Relative phagocytosis quantification for both the initial and secondary challenges is shown in lower graphs (n = 4). Data shown are mean ± SEM (P values derived from unpaired 2-tailed Student t test [initial challenge] and unpaired 1-way ANOVA with multiple comparisons correction [secondary challenge]). (G) BMDMs were induced to undergo hypophagia for 2 hours, washed, and cultured for 24 hours ± recombinant IFN-γ (50 ng/mL) or C5a (50 ng/mL) before rechallenge with thymocytes ± αCD90.2 for 4 hours, and ADCP was measured by live-cell imaging as in Figure 1E. Representative data from 1 of 3 independent experiments are shown. (H) Quantification of ADCP rechallenge experiments in panel G. Data shown are mean ± SEM (n = 3; P values derived from unpaired 1-way ANOVA with multiple comparisons correction). (I) Surface levels of FcγRI on BMDMs from experiments in panels G and H were analyzed by flow cytometry. Data shown are mean ± SEM (n = 3; P values derived from unpaired 1-way ANOVA with multiple comparisons correction). (J) Surface levels of FcγRIIb on BMDMs from experiments in panels G and H were analyzed by flow cytometry. Data shown are mean ± SEM (n = 3; P values derived from unpaired 1-way ANOVA with multiple comparisons correction; differences observed between groups were not significant [ns]). *P < .05, **P < .01, ***P < .001, ****P < .0001. MFI, mean fluorescence intensity.
Selective internalization and proteasomal degradation of FcγRI in hypophagic macrophages. (A) BMDMs were cocultured with thymocytes ± αCD90.2 for 2 hours to induce hypophagia and analyzed by intracellular staining and flow cytometry to measure surface and total (surface + intracellular) levels of FcγRI. Data shown are mean ± standard error of the mean (SEM; n = 3; P values derived from unpaired 1-way analysis of variance [ANOVA]). (B) BMDMs were treated as in panel A and analyzed for FcγRIIb levels. Data shown are mean ± SEM (n = 3; P values derived from unpaired 1-way ANOVA). (C) Total levels of FcγRI were measured by western blotting of total lysates from BMDMs cocultured with thymocytes ± αCD90.2 (ADCP) for the indicated times. Pretreatment with bafilomycin A1 (Baf; 100 nM) and MG132 (MG; 25 μM) for 3 hours before addition of mAb. Representative western blot image (top) and densitometry quantification of FcγRI levels (normalized to total Syk) are shown below. Data shown are mean ± SEM (n = 4; P values derived from unpaired 1-way ANOVA with multiple comparisons correction). (D) Total levels of FcγRIIb were analyzed as in panel C. Representative western blot image (top) and densitometry quantification of FcγRIIb levels (normalized to total Syk) are shown below. Data shown are mean ± SEM (n = 4; P values derived from unpaired 1-way ANOVA with multiple comparisons correction). (E) BMDMs were pretreated for 3 hours ± 25 μM of MG132 before coculture with thymocytes ± αCD90.2 for 2 hours to induce hypophagia. FcγRI was immunoprecipitated from BMDM total lysates and analyzed by western blotting with indicated Abs. Representative blot of 5 experiments is shown. Arrow indicates FcγRI band. (F) ADCP assay was performed on BMDMs pretreated ± 25 μM of MG132 for 3 hours before addition of thymocytes and αCD90.2 as described in Figure 1E. Relative phagocytosis quantification for both the initial and secondary challenges is shown in lower graphs (n = 4). Data shown are mean ± SEM (P values derived from unpaired 2-tailed Student t test [initial challenge] and unpaired 1-way ANOVA with multiple comparisons correction [secondary challenge]). (G) BMDMs were induced to undergo hypophagia for 2 hours, washed, and cultured for 24 hours ± recombinant IFN-γ (50 ng/mL) or C5a (50 ng/mL) before rechallenge with thymocytes ± αCD90.2 for 4 hours, and ADCP was measured by live-cell imaging as in Figure 1E. Representative data from 1 of 3 independent experiments are shown. (H) Quantification of ADCP rechallenge experiments in panel G. Data shown are mean ± SEM (n = 3; P values derived from unpaired 1-way ANOVA with multiple comparisons correction). (I) Surface levels of FcγRI on BMDMs from experiments in panels G and H were analyzed by flow cytometry. Data shown are mean ± SEM (n = 3; P values derived from unpaired 1-way ANOVA with multiple comparisons correction). (J) Surface levels of FcγRIIb on BMDMs from experiments in panels G and H were analyzed by flow cytometry. Data shown are mean ± SEM (n = 3; P values derived from unpaired 1-way ANOVA with multiple comparisons correction; differences observed between groups were not significant [ns]). *P < .05, **P < .01, ***P < .001, ****P < .0001. MFI, mean fluorescence intensity.
Finally, we tested whether enhancing FcγRI levels could restore the ADCP activity of hypophagic macrophages. We focused on FcγRI in part because of the discovery by Gul et al3 that the high-affinity receptor was a key mediator of malignant cell clearance within their melanoma model. We first tested whether preventing the proteolytic degradation of FcγRI using MG132 could restore ADCP in hypophagic macrophages. As shown in Figure 4F, although pretreatment of BMDMs with MG132 led to a modest but significant increase in ADCP by unfed BMDMs, neither MG132 nor bafilomycin A1 affected the onset or duration of hypophagia (Figure 4F; supplemental Figure 7A). In addition, MG132 did not restore surface levels of FcγRI or FcγRIIb (supplemental Figure 7B-C). Therefore, preventing proteolytic degradation of internalized FcγRI is not sufficient to restore FcγRI surface levels or phagocytic activity. Furthermore, these data suggest that recovery of phagocytic activity after ADCP is not dependent on recycling of FcγRI but instead requires de novo synthesis of FcγRI. To test this, BMDMs were treated with IFN-γ, which is known to enhance the expression of many genes, including Fcgr142 and the chemokine C5a, which has been reported to enhance the transcription of activating FcγR in macrophages.43 Strikingly, treatment of hypophagic BMDMs for 24 hours with 50 ng/mL of IFN-γ completely restored ADCP, whereas C5a treatment did not alter hypophagia (Figure 4G-H). The ability to overcome hypophagia upon IFN-γ treatment was associated with significantly increased levels of FcγRI (but not FcγRIIb surface levels; Figure 4I-J). Importantly, unfed/naïve and hypophagic macrophages showed similar ADCP levels after 24-hour treatment with IFN-γ (supplemental Figure 8A-C). Taken together, these results demonstrate that internalization of FcγRI during ADCP leads to cytosolic degradation of the receptors and that the sustained loss of activating FcRs is likely a prominent mechanism underlying hypophagia.
Discussion
Although great progress has been made in our understanding of ADCP, relatively little is known about how macrophages regulate their rate or capacity for ADCP. These unanswered questions about ADCP are highly relevant to many pathophysiologic processes, including diseases where aberrant macrophage phagocytosis contributes to life-threatening conditions (eg, autoimmune hemolytic anemia, immune thrombocytopenia) and in the setting of unconjugated therapeutic mAbs, which are now widely used to treat numerous malignancies and autoimmune disorders. The issue of finite macrophage ADCP capacity is particularly important in mAb treatment of malignancies, where the target cells can vastly outnumber tissue macrophages and potentially exhaust the body’s innate immune cytotoxic capacity and thereby limit mAb efficacy. Our findings show for the first time that macrophage ADCP capacity is finite such that macrophages undergo a protracted period of phagocytic exhaustion (hypophagia) after initial uptake of ADCP targets and that this exhaustion impinges on the continued clearance of mAb-opsonized target cells. Similarly, in vivo, when mice are challenged multiple times with circulating mAb-opsonized targets, KCs in the liver lose normal phagocytic function over time.
Recent in vivo studies in mice by several groups have established that B-cell depletion via αCD20 mAbs is mediated primarily by phagocytes in the liver, including tissue-resident macrophages (KCs) and monocyte-derived populations.3-5,44 Our in vivo studies focused on the ADCP activity of KCs using conventional KC markers (CD45+/Tim4hi/SSChi).45,46 These data show that repeated challenge of KCs with mAb-opsonized targets results in decreased ADCP activity by KCs in vivo. Interestingly, we found that only approximately one-third of these KCs were positive for engulfing endogenous lymphocytes upon treatment with αCD20. This was a surprising finding, given that 80% of circulating B cells are depleted by 1 hour upon αCD20 treatment and sustained near this level for at least 3 weeks in mice with normal B cells (data not shown). Our findings may reflect the involvement of a specific subset of KCs that function in ADCP and differ by ontogeny, tissue localization, and/or discrete gene expression patterns among KC populations that have been reported in other studies.11,12,46,47 Although depletion of circulating B cells by αCD20 is profound and rapid in humans, in the context of B-cell malignancies such as CLL, αCD20 mAbs alone do not mediate sustained depletion and are not curative.13,48 We are currently investigating the possible role of hypophagia in controlling αCD20-mediated cell clearance in mouse models of B-cell malignancy.
After finding that ADCP hypophagia did not affect efferocytosis, an Ab-independent form of phagocytosis, we speculated that the hypophagia we observed was specific to Ab-mediated phagocytosis signaling. Importantly, our ADCP culture conditions contained 10% heat-inactivated serum and were thus devoid of complement, allowing us to specifically study FcR-mediated engulfment. We are currently investigating hypophagia in the context of complement-mediated ADCP. In regard to normal serum IgG effects on ADCP, we provide data that the addition of 20 μg/mL of normal IgG to our in vitro ADCP assays had minimal effects on ADCP. Serum IgG levels can range from 8.0 to 15 mg/mL, so perhaps the addition of even higher IgG amounts may influence ADCP hypophagia, particularly ADCP mediated by FcγRI. However, we and others have shown that addition of high levels of IgG to in vitro coculture assays, whether via the addition of serum or IVIG, had minimal impact on macrophage ADCP mediated by therapeutic mAbs.20,29
Our mechanistic studies revealed that surface expression of all 4 mouse FcRs were significantly downregulated within 30 minutes of initial ADCP and that this loss of surface FcR correlated with the onset of hypophagia. Similarly, hypophagic hMDMs showed significantly reduced levels of all FcRs tested, including FcγRI, FcγRIIb, FcγRIIa, and FcγRIIIa. These results are consistent with previous studies that have shown that FcRs can be internalized upon ligation with multivalent IgG complexes.37,38,40 Although FcR ubiquitination has been reported,39 neither the functional consequences of FcR degradation on ADCP nor the precise signaling mechanisms that regulate FcR degradation have been clearly defined. Indeed, our data show that the activating FcγRI, but not the inhibitory FcγRIIb, is degraded via phagolysosomal processing in hypophagic macrophages. This corresponds to the faster restoration of surface FcγRIIb in hypophagic macrophages compared with FcγRI. Given that FcγRIIb is a potent inhibitor of ADCP in vivo and in vitro,28 this finding raises the possibility that FcγRIIb might play an important role in maintaining macrophages in a hypophagic state even as levels of activating FcRs are restored. Indeed, targeted disruption of inhibitory FcRs is a relatively new and promising approach to enhance ADCP therapeutically.49-51 Nevertheless, additional investigations are required to definitively establish the role of FcγRIIb in hypophagia.
Interestingly, despite greatly reduced levels of FcRs, hypophagic macrophages seemed to retain the ability to interact with mAb-opsonized target cells. A precise understanding of the relationship between hypophagia and FcR-IgG binding requires future in-depth analysis. Nevertheless, given that ADCP, but not FcR-IgG binding, requires FcR clustering to activate signaling pathways to achieve target internalization,52 it is possible that the residual levels of FcRs on hypophagic macrophages are sufficient to allow some level of target binding. In addition, there are a number of other surface proteins besides FcRs that have been implicated in ADCP, including integrins, SIRPα, and CD47,53,54 which could contribute to the retention of binding capacity for hypophagic macrophages.
Multiple studies have shown that in vivo cell clearance via mAbs is mediated by a combination of FcRs.55-59 This, combined with our finding that all FcRs we tested, both activating and inhibitory, were downregulated during hypophagia, strongly suggests that additional FcRs besides FcγRI play important functional roles in hypophagia. Given that numerous studies have shown that IFN-γ selectively upregulates expression of FcγRI but not other FcRs,60-63 our finding that IFN-γ treatment of macrophages reverses hypophagia points to an important, but not exclusive, role for FcγRI depletion in hypophagia. An important caveat to this finding is that IFN-γ is a robust immune mediator known to affect the transcription of many genes besides FcγRI in macrophages.42,64,65 Nevertheless, detailed analyses of the functional role of all FcRs in hypophagia, particularly in the context of therapeutic ADCP, will be important to fully understand the mechanisms underlying hypophagia and its role in mAb efficacy in vivo.
We believe that our findings provide important new information on the basic mechanisms of macrophage phagocytosis and implicate phagocytic exhaustion as a potential novel mechanism to explain the diminished efficacy of therapeutic mAbs. Moreover, because macrophages and other myeloid cells have recently emerged as important new players in the realm of targeted cellular therapies, we believe that our data will provide many new insights to improve our ability to manipulate macrophages for therapeutic benefits.
For original data, please e-mail the corresponding author.
The online version of this article contains a data supplement.
The publication costs of this article were defrayed in part by page charge payment. Therefore, and solely to indicate this fact, this article is hereby marked “advertisement” in accordance with 18 USC section 1734.
Acknowledgments
The authors thank members of the Center for Vaccine Biology and Immunology and the Center for Cell Clearance for critical feedback on this project and manuscript, Ron Taylor for critical feedback throughout the project, Kodi Ravichandran for helpful suggestions in preparing the manuscript, Daniel Barber for insightful suggestions, Rachel Pinney for her advice on figure design, and Genentech for supplying the anti-CD20 mAb.
This work was supported by the National Institutes of Health (NIH) National Institute of Allergy and Infectious Diseases (AI-114554) (M.R.E.); NIH National Institute of Diabetes and Digestive and Kidney Diseases (DK-119285) (M.R.E.); a grant from the University of Rochester Wilmot Cancer Institute; an Acerta Pharma, LLC grant (005656) (M.R.E. and C.C.C.); a University of Rochester Research Award (M.R.E., C.S.Z.); and the Wilmot Cancer Institute, Acerta Pharma, LLC, and donation by Elizabeth J. Aaron (C.S.Z.). J.J.P. was supported by University of Rochester Immunology Training T32 Grant (AI-007285) from the NIH National Institute of Allergy and Infectious Diseases. Genentech supplied the anti-CD20 mAb used in this study. The funding sources, including Acerta Pharma, LLC, did not contribute to the concept or design of this project, nor did they contribute to the data acquisition or data analysis presented here.
Authorship
Contribution: M.R.E., C.S.Z., J.J.P., and C.C.C. were responsible for conceptualization; J.J.P., M.R.E., F.R.-E., and C.C.C. were responsible for methodology; J.J.P., F.R.-E., C.C.C., H.E.W., A.M.N., M.C.B., and K.R.V. were responsible for data acquisition; J.J.P., F.R.-E., C.C.C., A.M.N., M.C.B., and M.R.E. performed data analysis; J.J.P. and M.R.E. were responsible for writing; M.R.E. supervised the study; and M.R.E., C.S.Z., and C.C.C. were responsible for funding acquisition.
Conflict-of-interest disclosure: The authors declare no competing financial interests.
Correspondence: Michael R. Elliott, Department of Microbiology, Immunology, and Cancer Biology, University of Virginia, 1340 Jefferson Park Ave, Charlottesville, VA 22908; e-mail: mre4n@virginia.edu.

This feature is available to Subscribers Only
Sign In or Create an Account Close Modal