

Key Points
Heme clearance in macrophages requires a metabolic shift to the PPP.
CO released by heme oxygenase 1 enzymatic activity is sufficient to induce the PPP in vitro and in vivo; this pathway occurs in mouse SCD.

Abstract
Heme is an essential cofactor for numerous cellular functions, but release of free heme during hemolysis results in oxidative tissue damage, vascular dysfunction, and inflammation. Macrophages play a key protective role in heme clearance; however, the mechanisms that regulate metabolic adaptations that are required for effective heme degradation remain unclear. Here we demonstrate that heme loading drives a unique bioenergetic switch in macrophages, which involves a metabolic shift from oxidative phosphorylation toward glucose consumption. Metabolomic and transcriptional analysis of heme-loaded macrophages revealed that glucose is funneled into the pentose phosphate pathway (PPP), which is indispensable for efficient heme detoxification and is required to maintain redox homeostasis. We demonstrate that the metabolic shift to the PPP is controlled by heme oxygenase–dependent generation of carbon monoxide (CO). Finally, we show that PPP upregulation occurs in vivo in organ systems central to heme clearance and that PPP activity correlates with heme levels in mouse sickle cell disease (SCD). Together, our findings demonstrate that metabolic adaptation to heme detoxification in macrophages requires a shift to the PPP that is induced by heme-derived CO, suggesting pharmacologic targeting of macrophage metabolism as a novel therapeutic strategy to improve heme clearance in patients with hemolytic disorders.
Introduction
Hemolysis is prevalent in infections, genetic disorders such as sickle cell disease (SCD),1 glucose-6-phosphate dehydrogenase (G6PD) deficiency,2 and autoimmune-, trauma-, or drug-induced hemolytic anemia.3 Release of free heme into the circulation4 damages the endothelium,5 promotes vascular inflammation,6 and exacerbates SCD,7,8 sepsis,9 and malaria.10,11 Oxidative damage is a key driver of heme-induced pathology,12 and highly conserved antioxidant programs, including the upregulation of heme oxygenase 1 (HMOX1)13,14 are at the core of the cellular response to increased free heme.15,16 HMOX1 uses reduced nicotinamide adenine dinucleotide phosphate (NADPH) as a cofactor to catalyze the degradation of heme into biliverdin, iron, and carbon monoxide (CO). Activation of nuclear factor erythroid-like 2 (NRF2),16 PPARγ,17 or CREB–AP-1 signaling18,19 or inhibition of the repressor BACH120 regulate HMOX1 expression, and defects in antioxidant-response pathways result in heme-driven pathologies.21 Moreover, HMOX1 deficiency in mice and humans reduces the capacity to withstand oxidative stress and leads to the development of iron deficiency anemia, iron accumulation,22 chronic inflammation,23 and atherosclerosis.24,25
Macrophages are specialized in heme clearance, controlling both the physiologic turnover of heme from senescent erythrocytes26 and the response to pathological increases in free heme through uptake of heme-hemopexin,27 hemoglobin-haptoglobin,28 or heme itself.29,30 Furthermore, macrophages are mediators of central iron metabolism31,32 as well as iron homeostasis in peripheral tissues.33,34 Metabolic adaptation is inextricably linked to macrophage function35-37 ; however, the metabolic adaption necessary for heme detoxification in macrophages remains unexplored. Furthermore, it is not known whether heme itself or catalytic products of heme degradation induce metabolic adaptation.
Here we examine the impact of heme loading on macrophage bioenergetics and investigate the mechanisms that regulate the cellular metabolic adaptations to promote heme clearance and detoxification. Our findings uncover a unique bioenergetic profile of heme-loaded macrophages and demonstrate a requirement for NADPH production, which is induced via a CO-dependent feed-forward induction of the pentose phosphate pathway (PPP). This mechanism highlights the requirement for cellular metabolic reprogramming in macrophages that acts in parallel with the canonical heme oxygenase pathway to promote heme degradation, redox homeostasis, and cell survival.
Methods
Complete experimental methods are included in the supplemental Data, available on the Blood Web site.
Mice
Male C57BL/6J, B6.129X1-Nfe2l2tm1Ywk/J (Nrf2 deficient), FVB.129S4(B6)-Hif1atm1Jhu/CkaMmjax (Hif1-α deficient), and B6;129-Hbbtm2(HBG1,HBB*)Tow/Hbbtm3(HBG1,HBB)TowHbatm1(HBA)Tow/J (Townes SCD) mice were obtained from The Jackson Laboratory (Bar Harbor, ME) and housed at the Pinn Vivarium, University of Virginia, according to standard animal care practices dictated by the University of Virginia’s Animal Care and Use Committee. Animals had access to food and water ad libitum and were housed in a 12-hour light/dark cycle.
Bone marrow isolation and culture
Bone marrow-derived macrophages (BMDMs) were cultured as previously described.38 Briefly, bone marrow from the hind legs of 7- to 11-week-old mice was isolated and incubated with 0.83% ammonium chloride to lyse erythrocytes. The remaining marrow was cultured in RPMI 1640 (Genesee Scientific, El Cajon, CA) containing 10% fetal bovine serum (Atlanta Biologicals, Flowery Branch, GA), 2% N-2-hydroxyethylpiperazine-N′-2-ethanesulfonic acid (HEPES), 2% Antibiotic-Antimycotic (both from Gibco, Gaithersburg, MD), and 10% L929-conditioned media as a source of macrophage colony-stimulating factor (L929 cells from American Type Culture Collection [ATCC], Manassas, VA). Media was exchanged every 3 days, and on day 7, the media was exchanged for one lacking L929-conditioned media. BMDMs were then detached using 0.25% trypsin (Gibco), centrifuged, and had their media refreshed before analysis.
RAW macrophage culture
RAW264.7 cells were obtained from ATCC and cultured on Petri dishes in Dulbecco’s modified Eagle medium (DMEM) media (Genesee Scientific), with 10% fetal bovine serum (Atlanta Biologicals), 2% HEPES (Gibco), and 1% Antibiotic-Antimycotic (Gibco). Media was replaced every 3 to 4 days, and cells were allowed to grow to 90% confluency before splitting and passaging. Cells were separated from Petri dishes using 0.25% trypsin (Gibco).
Liver and spleen isolation
Three- to 4-month-old Townes SCD mice were euthanized by carbon dioxide, and blood was drawn via cardiac puncture. Blood was allowed to clot, and serum was prepared by centrifugation for 5 minutes at 800g. Liver and spleens from these mice were then surgically excised. For assays involving protein, sections of ∼50 mg were homogenized in 1× radioimmunoprecipitation assay (RIPA) lysis buffer (containing complete mini protease inhibitor) in a tissue homogenizer (QIAGEN) for 10 minutes, before samples were centrifuged at 13 000 rpm for 5 minutes. The protein concentration of the supernatant was determined via Pierce BCA Assay (Thermo Scientific, Waltham, MA) before G6PD activity was measured.
Messenger RNA expression by RT-qPCR
RNA was isolated from BMDMs, tissue samples, or fluorescence-activated cell sorted (FACS)–isolated cells with the RNEasy Mini Kit (QIAGEN, Hilden, Germany), and libraries of complementary DNA (cDNA) were generated using the iScript cDNA Synthesis Kit (Bio-Rad). Real-time quantitative polymerase chain reaction (RT-qPCR) was performed using Bioline SensiMix SYBR and Fluorescein Kit (Meridian Life Sciences, Memphis, TN) on a CFX Connect Real Time PCR System (Bio-Rad). Primer pairs used were described previously or designed with PrimerBLAST and verified with melt-curve analysis. Sequences and references for primers used in this study can be found in supplemental Table 1.
Metabolomics
Metabolomics analyses were conducted as described previously.38 Briefly, BMDMs were treated with either vehicle or heme (10 μM) for 6 hours. Cells were detached and centrifuged at 600g for 5 minutes. The supernatant was removed under vacuum, and the sample pellets were stored at −80°C before transport to Metabolon, Inc. (Durham, NC), which performed the global metabolomic analysis. Abundance data for all metabolites was normalized to sample protein content (as measured by a Bradford assay), and data are represented as a relative normalized abundance. Extended metabolomics methods can be found in the supplemental Data.
Extracellular flux analysis
Extracellular flux analysis on BMDMs was conducted as previously described.38 Briefly, BMDMs were seeded into a Seahorse 24-well culture plate (Agilent Technologies). Cells were allowed to adhere for 1 to 2 hours before treatment with vehicle or heme (10 or 50 μM) for 6 hours. For assessing respiratory capacity, cells underwent a mitochondrial stress test (MST) as established previously.39 For assessing the glycolytic capacity of the cells, a glycolytic stress test (GST) was performed to measure extracellular acidification rate (ECAR), representing the secretion of lactate into the extracellular media. Bioenergetics plots were created using the maximum respiratory capacity from MST (y-axis) and the glycolytic capacity from GST (x-axis) from parallel experiments in which the cells received identical treatments. Extended methods can be found in the supplemental Data.
Protein expression and functional cellular assays
Protein expression was quantified by western blot. BMDMs were plated in 6-well plates and treated as indicated. Cells were lysed in ice-cold RIPA buffer (Millipore, Burlington, MA) containing Complete Mini Protease inhibitor (Roche), sonicated for 30 seconds, and centrifuged at 18 000g, and the supernatant was retained. Protein concentration was determined by Pierce BCA Assay (Thermo Scientific), and 50 μg of each sample was digested in sodium dodecyl sulfate polyacrylamide gel electrophoresis loading buffer at 95°C for 5 minutes. Samples were run on a 10% sodium dodecyl sulfate gel, transferred to nitrocellulose, stained with primary antibodies (see supplemental Data), and imaged on a LI-COR Odyssey imaging system using fluorescently tagged secondary antibodies (LI-COR Biosciences, Lincoln, NE). Functional assays were conducted on supernatants or whole cell lysates from BMDMs treated with vehicle, heme (10 or 50 μM), tricarbonylchloro(glycinato)ruthenium (II) (CORM3; 50 or 100 μM), or iCORM3 (50 or 100 μM). A description of the methods can be found in the supplemental Data.
Statistical analysis
Data are represented as mean ± standard error of the mean, unless otherwise specified. Unpaired Welch’s t test determined statistical significance between 2 groups. For comparisons between more than 2 groups, one-way analysis of variance tests were conducted to determine overall significance. Post hoc Dunnett’s multiple comparison test was used for experiments comparing multiple experimental groups to a single control, and post hoc Tukey’s tests were used for comparison between multiple experimental groups. For all experiments, α = .05. Data analysis was performed using Prism 8 software (GraphPad Software, La Jolla, CA) and FCSExpress 6 (DeNovo Software, Pasadena, CA).
Results
Heme loading drives a bioenergetic shift in macrophages, reducing mitochondrial respiration and promoting glucose uptake
We established that exposure of murine BMDMs to free heme resulted in intracellular heme accumulation in a dose-dependent manner (Figure 1A). MSTs revealed a significant and dose-dependent suppression of oxygen consumption in heme-loaded macrophages (Figure 1B), with significant decreases in both basal and maximal mitochondrial respiration as well as reserve capacity. Heme loading induced a significant increase in uptake of the fluorescent glucose analog 2-(N-(7-nitrobenz-2-oxa-1,3-diazol-4-yl)amino)-2-deoxyglucose (Figure 1C) as well as a 2.5-fold increase in gene expression of the glucose transporter Glut1 (Figure 1D). These data imply that heme-loaded macrophages use glucose as a fuel source. However, glycolytic stress tests revealed modest changes in glycolytic rate and capacity in heme-loaded macrophages (Figure 1E), and the bioenergetics phenogram illustrates that heme loading drives macrophages away from aerobic metabolism, with only a minor trend toward increased glucose utilization (Figure 1F). The dampened bioenergetic profile of heme-loaded macrophages resulted in a dose-dependent decrease in intracellular adenosine triphosphate (ATP) levels (Figure 1G), despite demonstrating sustained cell survival (Figure 1H). Cell death was observed only at an extracellular heme concentration of 100 μM, demonstrating a remarkable ability of BMDMs to withstand heme toxicity. Together, the significant increase in glucose uptake with minor changes in glycolytic rate imply that glucose is used in alternative metabolic pathways in heme-loaded macrophages.

Heme loading drives a bioenergetic shift in macrophages, reducing mitochondrial respiration and promoting glucose uptake. (A) BMDMs were treated with vehicle or heme (10 or 50 μM) for 6 hours, and intracellular heme content was normalized to protein (n = 3). (B) MST of BMDMs loaded with 10 µM vehicle or 50 µM heme for 6 hours (n = 3-4). The oxygen consumption rate (OCR) was measured initially (basal; blue) and after injection of 1 µM oligomycin, 2 µM BAM15 (maximal; green), and 10 µM antimycin A (AA) and 1 µM rotenone (Rot) (gray; non-mitochondrial). Basal and maximal OCR were calculated by subtracting the mean OCR of the first 3 (basal) or post-BAM15 (maximal) measurements from the mean OCR of the post-AA/Rot measurements. Reserve capacity is the difference in maximal and basal respiratory capacity. (C) Glucose uptake of BMDMs loaded with vehicle, 50 µM heme or lipopolysaccharide (LPS; 1 µg/mL) for 6 hours, measured by the accumulation of 2-(N-(7-nitrobenz-2-oxa-1,3-diazol-4-yl)amino)-2-deoxyglucose (2-NBDG) (n = 4). (D) Messenger RNA (mRNA) expression of Glut1 in BMDMs loaded with vehicle or 50 µM heme for 6 hours measured by real-time quantitative polymerase chain reaction (RT-qPCR) (n = 4). (E) Glycolytic stress test (GST) of BMDMs loaded with 10 µM vehicle or 50 µM heme for 6 hours (n = 4). The extracellular acidification rate (ECAR) was measured after injection of 20 mM glucose, 1 µM oligomycin, and 80 mM 2-deoxyglucose (2-DG) to produce the basal (blue), stressed (green), and background (gray) ECAR, respectively. Basal and stressed ECAR were calculated by subtracting the mean ECAR of the post-glucose (basal) or post-oligomycin (stressed) measurements from the mean ECAR of the post–2-DG measurements. (F) Bioenergetics plot of heme-loaded macrophages, based on glycolytic capacity (stressed ECAR) and maximal respiratory capacity (maximal OCR). (G) Intracellular ATP levels of BMDMs treated with 10 µM vehicle or 50 µM heme as measured by luminescent signal of the Cell-Titer Glo ATP Assay are presented as percent of initial vehicle control (n = 4). (H) Viability of RAW264.7 macrophages treated with 10 µM vehicle or with 50 µM or 100 µM heme was determined by percentage of cells that excluded trypan blue dye and is presented as percentage of initial vehicle control (n = 4). Data are represented as mean ± standard error of the mean (SEM). Statistical significance between 2 groups was determined by Welch’s unpaired t test. Significance between more than 2 groups was determined by one-way analysis of variance (ANOVA), with post hoc Tukey or Dunnett’s multiple comparison test to determine significance between groups. *P < .05; **P < .01; ***P < .001.
Heme loading drives a bioenergetic shift in macrophages, reducing mitochondrial respiration and promoting glucose uptake. (A) BMDMs were treated with vehicle or heme (10 or 50 μM) for 6 hours, and intracellular heme content was normalized to protein (n = 3). (B) MST of BMDMs loaded with 10 µM vehicle or 50 µM heme for 6 hours (n = 3-4). The oxygen consumption rate (OCR) was measured initially (basal; blue) and after injection of 1 µM oligomycin, 2 µM BAM15 (maximal; green), and 10 µM antimycin A (AA) and 1 µM rotenone (Rot) (gray; non-mitochondrial). Basal and maximal OCR were calculated by subtracting the mean OCR of the first 3 (basal) or post-BAM15 (maximal) measurements from the mean OCR of the post-AA/Rot measurements. Reserve capacity is the difference in maximal and basal respiratory capacity. (C) Glucose uptake of BMDMs loaded with vehicle, 50 µM heme or lipopolysaccharide (LPS; 1 µg/mL) for 6 hours, measured by the accumulation of 2-(N-(7-nitrobenz-2-oxa-1,3-diazol-4-yl)amino)-2-deoxyglucose (2-NBDG) (n = 4). (D) Messenger RNA (mRNA) expression of Glut1 in BMDMs loaded with vehicle or 50 µM heme for 6 hours measured by real-time quantitative polymerase chain reaction (RT-qPCR) (n = 4). (E) Glycolytic stress test (GST) of BMDMs loaded with 10 µM vehicle or 50 µM heme for 6 hours (n = 4). The extracellular acidification rate (ECAR) was measured after injection of 20 mM glucose, 1 µM oligomycin, and 80 mM 2-deoxyglucose (2-DG) to produce the basal (blue), stressed (green), and background (gray) ECAR, respectively. Basal and stressed ECAR were calculated by subtracting the mean ECAR of the post-glucose (basal) or post-oligomycin (stressed) measurements from the mean ECAR of the post–2-DG measurements. (F) Bioenergetics plot of heme-loaded macrophages, based on glycolytic capacity (stressed ECAR) and maximal respiratory capacity (maximal OCR). (G) Intracellular ATP levels of BMDMs treated with 10 µM vehicle or 50 µM heme as measured by luminescent signal of the Cell-Titer Glo ATP Assay are presented as percent of initial vehicle control (n = 4). (H) Viability of RAW264.7 macrophages treated with 10 µM vehicle or with 50 µM or 100 µM heme was determined by percentage of cells that excluded trypan blue dye and is presented as percentage of initial vehicle control (n = 4). Data are represented as mean ± standard error of the mean (SEM). Statistical significance between 2 groups was determined by Welch’s unpaired t test. Significance between more than 2 groups was determined by one-way analysis of variance (ANOVA), with post hoc Tukey or Dunnett’s multiple comparison test to determine significance between groups. *P < .05; **P < .01; ***P < .001.
Unbiased metabolomics analysis of heme-loaded macrophages reveals enrichment for metabolites associated with the PPP
To investigate the changes in metabolic profile upon heme loading in macrophages, we used a mass spectrometry–based unbiased metabolomics approach (Metabolon, Inc., Durham, NC), which analyzed the relative abundance of more than 500 cellular metabolites (a list of all significantly changed metabolites is provided in supplemental Table 2). Metabolomics analysis of BMDMs after 6 hours of heme loading revealed enrichment for specific metabolic pathways, including heme degradation, dipeptide metabolism, PPP, and glycolysis (Figure 2A). Unsurprisingly, the most highly enriched pathway in heme-loaded macrophages was heme metabolism, with significant increases in heme and its degradation products biliverdin and bilirubin (Figure 2A-B). Although heme loading increased glucose uptake (Figure 1C), initial metabolites such as glucose-6-phosphate, fructose-6-phosphate, and fructose-1,6-bisphosphate were not significantly increased, whereas several downstream glycolytic metabolites, including dihydroxyacetone phosphate, 3-phosphoglycerate, phosphoenolpyruvate, pyruvate, and lactate, were significantly enriched in heme-loaded macrophages (Figure 2C). These increases in glycolytic metabolites were not associated with changes in intermediates of the tricarboxylic acid cycle after heme loading (supplemental Figure 1A). However, metabolites associated with the oxidative reactions of the PPP, such as 6-phosphogluconate, ribulose/xylulose-5-phosphate, and ribose, were significantly more abundant in heme-loaded macrophages (Figure 2D). Isotopically labeled glucose studies in heme-loaded RAW macrophages also demonstrated a significant enrichment of [13C]5-ribose, as well as nonsignificant increases in metabolites at points of reentry from the PPP into glycolysis, without changes in any [13C] isotopologues of lactate (supplemental Figure 1B), which paralleled the modest increase in glycolytic rate in heme-loaded macrophages (Figure 1E). Taken together, these results suggest that heme loading in macrophages redirects glucose metabolism to the PPP (Figure 2E).
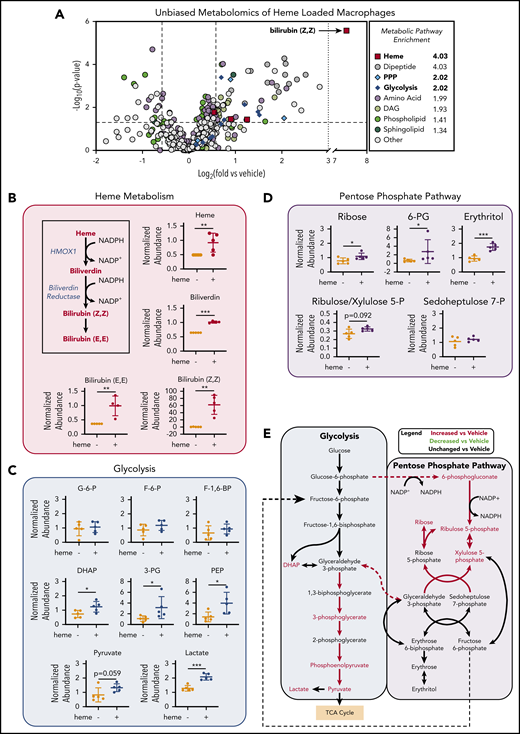
Unbiased metabolomics analysis of heme-loaded macrophages reveals enrichment for metabolites associated with glycolysis and the PPP. (A) Volcano plot representing the changes in BMDM metabolism after 6 hours of 10 µM heme loading, as measured by unbiased mass spectrometry–based metabolomics. Log2 values of the fold change of individual metabolites are plotted on the x-axis, and –log2 of the P value of a Welch’s t test between control and heme-loaded BMDMs is plotted on the y-axis (n = 5). (B) Changes in heme metabolite abundance in heme-loaded BMDMs. Metabolites in red text are increased in heme-loaded BMDMs relative to vehicle control with corresponding plots for the individual metabolites involved in heme catabolism (n = 5). (C) Plots representing individual metabolites involved in the glycolysis pathway (n = 5). (D) Plots representing individual metabolites involved in the PPP (n = 5). (E) Pathway analysis summary of glycolysis and the PPP in heme-loaded BMDMs. Metabolites in red text are increased in heme-loaded BMDMs relative to vehicle control. Data are mean ± standard deviation (SD) of relative abundance measurements for control and heme-loaded BMDMs (n = 5). Statistical significance between 2 groups was determined by Welch’s unpaired t test. *P < .05; **P < .01; ***P < .001. See also supplemental Figure 1.
Unbiased metabolomics analysis of heme-loaded macrophages reveals enrichment for metabolites associated with glycolysis and the PPP. (A) Volcano plot representing the changes in BMDM metabolism after 6 hours of 10 µM heme loading, as measured by unbiased mass spectrometry–based metabolomics. Log2 values of the fold change of individual metabolites are plotted on the x-axis, and –log2 of the P value of a Welch’s t test between control and heme-loaded BMDMs is plotted on the y-axis (n = 5). (B) Changes in heme metabolite abundance in heme-loaded BMDMs. Metabolites in red text are increased in heme-loaded BMDMs relative to vehicle control with corresponding plots for the individual metabolites involved in heme catabolism (n = 5). (C) Plots representing individual metabolites involved in the glycolysis pathway (n = 5). (D) Plots representing individual metabolites involved in the PPP (n = 5). (E) Pathway analysis summary of glycolysis and the PPP in heme-loaded BMDMs. Metabolites in red text are increased in heme-loaded BMDMs relative to vehicle control. Data are mean ± standard deviation (SD) of relative abundance measurements for control and heme-loaded BMDMs (n = 5). Statistical significance between 2 groups was determined by Welch’s unpaired t test. *P < .05; **P < .01; ***P < .001. See also supplemental Figure 1.
Heme loading induces changes in metabolic gene expression to promote persistent PPP flux and macrophage redox homeostasis
Immediate metabolic responses are mainly mediated by enzymatic activity, whereas prolonged changes in cellular metabolism are reflected in transcriptional activation of metabolic enzymes. To analyze changes in metabolic gene expression upon heme loading, we exposed BMDMs for 6 or 24 hours with 1, 5, or 10 µM heme. We found marked upregulation of heme degradation enzymes (Hmox1, Blvra, Blvrb) as well as genes involved in glucose uptake and phosphorylation (Glut1 and Hk2) at both time points (Figure 3A). Conversely, Pfkp, which encodes the phosphofructokinase required to commit glucose-6-phosphate to glycolysis, was downregulated (Figure 3A). Concomitantly, enzymes that regulate the PPP, including glucose-6-phosphate dehydrogenase (G6pd) and 6-phosphogluconate dehydrogenase (Pgd), were upregulated after 6 hours (Figure 3Bi), and remained significantly upregulated 24 hours after heme treatment (Figure 3Bii). Furthermore, heme loading induced upregulation of genes responsible for shuttling PPP metabolites back into the glycolytic pathway (Tkt, Taldo) (Figure 3B; supplemental Figure 2A-B), whereas downstream glycolytic enzymes (Gapdh, Pgk1, Pgam1, Pgam2, Pgam5, Eno1, and Eno2), were upregulated only after 24 hours (Figure 3A). Together, these data demonstrate that heme loading results in a time-dependent, persistent metabolic shift that promotes glucose uptake, diverts carbon into the PPP, and returns the downstream metabolites to glycolysis (Figure 3C).
![Heme loading induces changes in metabolic gene expression to promote persistent PPP flux and macrophage redox homeostasis. (A) Fold change in individual genes involved in the glycolytic, pentose phosphate, or heme metabolism pathways, as measured by RT-qPCR of BMDMs treated with 1 µM, 5 µM, or 10 µM heme for 6 or 24 hours (n = 3). Data in a heat map show the fold change compared with vehicle-treated macrophages. Primer sequences are listed in supplemental Table 1. (B) Volcano plots representing gene upregulation in BMDMs treated with 10 µM heme for 6 or 24 hours (n = 3) with the horizontal cutoff for P < .05. PPP and related enzymes are highlighted in purple. (C) Pathway analysis summary of 10 µM heme-driven gene regulation in BMDMs. mRNA for each gene was measured after 6 hours (left box) and 24 hours (right box) of heme stimulation. Orange-shaded boxes indicate upregulation, and blue-shaded boxes indicate downregulation of the respective gene vs the corresponding vehicle control. (D) mRNA expression of G6pd and Pgd in BMDMs treated with 1 µM to 10 µM heme for 6 or 24 hours (n = 4). (E) G6PD activity measured as the rate of NADPH synthesis in BMDMs treated with vehicle or 10 µM heme for 6 or 24 hours (n = 4). (F) Intracellular concentrations of reduced NADPH of BMDMs treated with vehicle, 100 µM dehydroepiandrosterone (DHEA; an inhibitor of G6PD), and/or 10 µM heme (n = 4). (G) Levels of oxidized glutathione (GSSG) in macrophages treated with vehicle, 100 µM DHEA, and/or 10µM heme (n = 4). (H) Ratio of reduced glutathione (GSH) to GSSG in BMDMs treated with vehicle, 100 µM DHEA, and/or 10 µM heme (n = 4). Data are represented as mean ± SEM. Statistical significance between 2 groups was determined by Welch’s unpaired t test. Significance between more than 2 groups was determined by one-way ANOVA, with post hoc Tukey’s or Dunnett’s multiple comparison tests, as appropriate, to determine differences between specific groups. RLU, relative light unit; TCA, tricarboxylic acid [cycle]. *P < .05; **P < .01; ***P < .001. See also supplemental Figure 2 and supplemental Tables 1 and 2.](https://ash.silverchair-cdn.com/ash/content_public/journal/blood/136/13/10.1182_blood.2020004964/1/m_bloodbld2020004964f3.png?Expires=1769114813&Signature=ZM9UljOzdTzwqJ-ss1uXg9i1THQmdP8guUAYBpPKivYeLJaDkVJRO-j2n~iDZiywe6i8SdvTYJGsyycllm3aLK3adg1ako8SIBJeddUhaQEaxhp7YPBVHlVXe9-QPiI2vgE2Vlu8ZYuFOF~MpOLOUf4txCJm5Y2JlwCV5RUo5FBdioxRwqK~EVzSo2ihdGETvGCd0OKBjqJ3l~XKmFF8kRGb9D~ABMaOipVJtsdJj9SgBASYxyu3PNiStKdReCWFmeb4Jt~Edg1rax0OyPuEHRosW95dpA8NvxiywvIzgoy565pICSLvseWHwipcVvi~F401VRVkNHrcayRpQT4OJw__&Key-Pair-Id=APKAIE5G5CRDK6RD3PGA)
Heme loading induces changes in metabolic gene expression to promote persistent PPP flux and macrophage redox homeostasis. (A) Fold change in individual genes involved in the glycolytic, pentose phosphate, or heme metabolism pathways, as measured by RT-qPCR of BMDMs treated with 1 µM, 5 µM, or 10 µM heme for 6 or 24 hours (n = 3). Data in a heat map show the fold change compared with vehicle-treated macrophages. Primer sequences are listed in supplemental Table 1. (B) Volcano plots representing gene upregulation in BMDMs treated with 10 µM heme for 6 or 24 hours (n = 3) with the horizontal cutoff for P < .05. PPP and related enzymes are highlighted in purple. (C) Pathway analysis summary of 10 µM heme-driven gene regulation in BMDMs. mRNA for each gene was measured after 6 hours (left box) and 24 hours (right box) of heme stimulation. Orange-shaded boxes indicate upregulation, and blue-shaded boxes indicate downregulation of the respective gene vs the corresponding vehicle control. (D) mRNA expression of G6pd and Pgd in BMDMs treated with 1 µM to 10 µM heme for 6 or 24 hours (n = 4). (E) G6PD activity measured as the rate of NADPH synthesis in BMDMs treated with vehicle or 10 µM heme for 6 or 24 hours (n = 4). (F) Intracellular concentrations of reduced NADPH of BMDMs treated with vehicle, 100 µM dehydroepiandrosterone (DHEA; an inhibitor of G6PD), and/or 10 µM heme (n = 4). (G) Levels of oxidized glutathione (GSSG) in macrophages treated with vehicle, 100 µM DHEA, and/or 10µM heme (n = 4). (H) Ratio of reduced glutathione (GSH) to GSSG in BMDMs treated with vehicle, 100 µM DHEA, and/or 10 µM heme (n = 4). Data are represented as mean ± SEM. Statistical significance between 2 groups was determined by Welch’s unpaired t test. Significance between more than 2 groups was determined by one-way ANOVA, with post hoc Tukey’s or Dunnett’s multiple comparison tests, as appropriate, to determine differences between specific groups. RLU, relative light unit; TCA, tricarboxylic acid [cycle]. *P < .05; **P < .01; ***P < .001. See also supplemental Figure 2 and supplemental Tables 1 and 2.
Heme loading induces changes in metabolic gene expression to promote persistent PPP flux and macrophage redox homeostasis. (A) Fold change in individual genes involved in the glycolytic, pentose phosphate, or heme metabolism pathways, as measured by RT-qPCR of BMDMs treated with 1 µM, 5 µM, or 10 µM heme for 6 or 24 hours (n = 3). Data in a heat map show the fold change compared with vehicle-treated macrophages. Primer sequences are listed in supplemental Table 1. (B) Volcano plots representing gene upregulation in BMDMs treated with 10 µM heme for 6 or 24 hours (n = 3) with the horizontal cutoff for P < .05. PPP and related enzymes are highlighted in purple. (C) Pathway analysis summary of 10 µM heme-driven gene regulation in BMDMs. mRNA for each gene was measured after 6 hours (left box) and 24 hours (right box) of heme stimulation. Orange-shaded boxes indicate upregulation, and blue-shaded boxes indicate downregulation of the respective gene vs the corresponding vehicle control. (D) mRNA expression of G6pd and Pgd in BMDMs treated with 1 µM to 10 µM heme for 6 or 24 hours (n = 4). (E) G6PD activity measured as the rate of NADPH synthesis in BMDMs treated with vehicle or 10 µM heme for 6 or 24 hours (n = 4). (F) Intracellular concentrations of reduced NADPH of BMDMs treated with vehicle, 100 µM dehydroepiandrosterone (DHEA; an inhibitor of G6PD), and/or 10 µM heme (n = 4). (G) Levels of oxidized glutathione (GSSG) in macrophages treated with vehicle, 100 µM DHEA, and/or 10µM heme (n = 4). (H) Ratio of reduced glutathione (GSH) to GSSG in BMDMs treated with vehicle, 100 µM DHEA, and/or 10 µM heme (n = 4). Data are represented as mean ± SEM. Statistical significance between 2 groups was determined by Welch’s unpaired t test. Significance between more than 2 groups was determined by one-way ANOVA, with post hoc Tukey’s or Dunnett’s multiple comparison tests, as appropriate, to determine differences between specific groups. RLU, relative light unit; TCA, tricarboxylic acid [cycle]. *P < .05; **P < .01; ***P < .001. See also supplemental Figure 2 and supplemental Tables 1 and 2.
In response to external stimuli, macrophages adopt specific polarization states, which involves transcriptional upregulation of specific gene programs that allows them to respond appropriately.38,40,41 Although heme loading produced modest upregulation of the M1 marker genes Il6, Ptgs2, and Nos2 (supplemental Figure 2C) as well as M2 markers, including Il10, Il4, and Ym1 (supplemental Figure 2D), we observed a significant induction of marker genes for redox-responsive Mox macrophages (supplemental Figure 2E), which are typically induced by phospholipid oxidation products42 and are known to have metabolic characteristics distinct from canonical M1 or M2 macrophage subtypes.38 Consistent with this antioxidant response, we observed a marked increase in intracellular reactive oxygen species in heme-loaded macrophages; however, this increase in reactive oxygen species was unaffected by inhibition of G6PD with dehydroepiandosterone (DHEA) (supplemental Figure 2F).
Expression of G6pd and Pgd was significantly and dose-dependently increased in heme-loaded wild-type BMDMs (Figure 3D). This effect was independent of Nrf2, since heme loading induced the expression of Glut1, G6pd, and Pgd also in BMDMs isolated from Nrf2-deficient mice (supplemental Figure 2G). In contrast, the response in Hif1a−/− BMDMs was lower compared with wild-type (supplemental Figure 2H), suggesting a role for Hif1-α activity in the regulation of PPP gene expression upon heme loading.
G6PD and PGD use glucose-6-phosphate and its downstream metabolites to reduce NADP+ to NADPH,43 and heme loading increased the NADPH-producing activity of G6PD (Figure 3E). NADPH is required to reduce oxidized glutathione (GSSG), and pharmacologic inhibition of G6PD with DHEA significantly decreased NADPH levels (Figure 3F) and drastically increased intracellular GSSG (Figure 3G) in heme-loaded macrophages. Moreover, heme loading resulted in a significant decrease in the glutathione:glutathione disulfide (GSH:GSSG) ratio, indicative of increased oxidative stress, which was significantly exacerbated upon inhibition of G6PD (Figure 3H). These data demonstrate that in heme-loaded macrophages, induction of the PPP is necessary to maintain cellular redox homeostasis.
G6PD activity is required for heme detoxification in macrophages
To examine whether the activity of the PPP was required for heme loading and/or degradation, we first loaded macrophages with 10 µM heme for 1, 3, and 6 hours, which resulted in a time-dependent increase in intracellular heme accumulation for the first 3 hours with a subsequent decrease indicative of heme degradation. However, in the presence of the G6PD inhibitor DHEA, macrophages continued to accumulate heme, resulting in significantly higher intracellular heme levels at 6 hours (Figure 4A). These data indicate that G6PD activity controls the heme degradation phase, rather than impacting heme loading. Next, we preloaded macrophages with heme for 4 hours and monitored intracellular heme levels for an additional 12 hours. Although vehicle-treated heme-loaded macrophages demonstrated a steady decrease in intracellular heme levels, inhibition of G6PD by DHEA inhibited heme degradation (Figure 4B). Strikingly, G6PD inhibition decreased the heme degradation rate by 75% (Figure 4C). Moreover, pharmacologic inhibition of the PPP with 6-amininicotinamide (a PGD inhibitor) inhibited PPP gene expression induced by heme loading (supplemental Figure 3A), as did inhibition of G6PD with DHEA (supplemental Figure 3B). These data demonstrate that activity of the PPP is specifically required for heme degradation in macrophages (Figure 4D).

G6PD activity is required for heme detoxification in macrophages. (A) BMDMs were treated with 20 µM heme and/or 100 µM DHEA, and intracellular heme concentration was measured at 1, 3, and 6 hours (n = 4). (B) BMDMs were treated with 20 µM heme for 4 hours to create heme-loaded macrophages. Subsequently, heme-loaded BMDMs were washed and treated with vehicle or 100 µM DHEA, and intracellular heme was measured at 5, 6, 8, 10, and 16 hours (n = 4). (C) The difference in intracellular heme at 4 and 16 hours (representing 12 hours of degradation) was used to calculate the heme degradation rate in heme-loaded macrophages with or without the addition of DHEA (n = 4). (D) Schematic representing the requirement of G6PD activity for macrophage heme degradation. Data are represented as mean ± SEM. Statistical significance between 2 groups was determined by Welch’s unpaired t test. Significance between more than 2 groups was determined by one-way ANOVA with post hoc Tukey’s tests to determine differences between specific groups. *P < .05; **P < .01; ***P < .001. See also supplemental Figure 3.
G6PD activity is required for heme detoxification in macrophages. (A) BMDMs were treated with 20 µM heme and/or 100 µM DHEA, and intracellular heme concentration was measured at 1, 3, and 6 hours (n = 4). (B) BMDMs were treated with 20 µM heme for 4 hours to create heme-loaded macrophages. Subsequently, heme-loaded BMDMs were washed and treated with vehicle or 100 µM DHEA, and intracellular heme was measured at 5, 6, 8, 10, and 16 hours (n = 4). (C) The difference in intracellular heme at 4 and 16 hours (representing 12 hours of degradation) was used to calculate the heme degradation rate in heme-loaded macrophages with or without the addition of DHEA (n = 4). (D) Schematic representing the requirement of G6PD activity for macrophage heme degradation. Data are represented as mean ± SEM. Statistical significance between 2 groups was determined by Welch’s unpaired t test. Significance between more than 2 groups was determined by one-way ANOVA with post hoc Tukey’s tests to determine differences between specific groups. *P < .05; **P < .01; ***P < .001. See also supplemental Figure 3.
CO generated by HO-1–dependent heme breakdown triggers the metabolic switch to the PPP
Pharmacologic inhibition of HMOX1 activity blunted the increase in Glut1 and PPP gene expression induced by heme loading (supplemental Figure 4A), which indicated that a heme breakdown product may mediate changes in cellular metabolism. To test whether CO can act as an inducer of the PPP in macrophages, we treated BMDMs with tricarbonylchloro(glycinato)ruthenium (II) (CORM3), a molecule that releases CO upon contact with water (Figure 5A). CORM3 significantly increased the expression of Glut1, G6pd, and Pgd compared with treatment with vehicle or previously inactivated CORM3 (iCORM) (Figure 5B), with a concomitant increase in NADPH-producing activity (Figure 5C) and intracellular NADPH levels (Figure 5D). In contrast to heme loading, CORM treatment of BMDMs did not significantly induce either M1 (Figure 5E) or M2 (Figure 5F) marker gene expression. However, CORM treatment resulted in induction of expression of Mox markers Gclm, Srxn1, and Txnrd1 (Figure 5G), suggesting that CO is inducing a Mox macrophage phenotype. Because HMOX1 requires NADPH as a cofactor to detoxify heme, our data are consistent with the model in which CO derived from heme breakdown acts as a feed-forward signal to promote a metabolic redirection essential for NADPH production (Figure 5H). Furthermore, CORM3 induced Glut1 expression, which was significantly blunted in BMDMs from Hif1a-deficient mice (supplemental Figure 4B). However, CORM3-induced expression of G6pd and Pgd was similar between Hif1a-deficient and wild-type macrophages (supplemental Figure 4B), demonstrating that Hif1-α is required for the CO-dependent upregulation of Glut1, whereas the upregulation of PPP enzymes by CO is independent of Hif1-α.
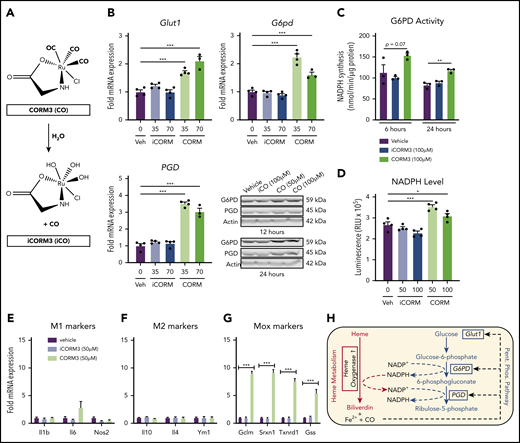
CO generated by HO-1–dependent heme breakdown upregulates the PPP. (A) Schematic showing the release of CO from CORM3 upon reaction with water and the generation of inactivated CORM3 (iCORM3). (B) mRNA expression of Glut1, G6pd, and Pgd in BMDMs treated with vehicle, 35-70 µM CORM3, or 35-70 µM iCORM3 for 6 hours. (n = 4). Corresponding representative western blot analysis of G6PD and PGD protein in BMDMs treated with vehicle, 100 µM iCORM3 (iCO), or 50-100 µM CORM3 (CO) for 12 or 24 hours. (C) G6PD activity, measured as the rate of NAPDH synthesis, in BMDMs treated with vehicle, 100 µM CORM3, or 100 µM iCORM3 for 6 or 24 hours (n = 3-4). (D) Intracellular NADPH levels measured from BMDMs treated with vehicle, 50-100 µM CORM3, or 50-100 µM iCORM3 for 6 hours (n = 4). (E) mRNA expression of M1 macrophage markers in BMDMs treated with vehicle, iCORM3, or 50 µM CORM3 for 6 hours (n = 4). (F) mRNA expression of M2 macrophage markers in BMDMs treated with vehicle, iCORM3, or 50 µM CORM3 for 6 hours (n = 4). (G) mRNA expression of Mox macrophage markers in BMDMs treated with vehicle, iCORM3, or 50 µM CORM3 for 6 hours (n = 4). (H) Schematic representing feed-forward regulation of PPP by heme breakdown mediated by CO. Data are represented as mean ± SEM. Statistical significance between 2 groups was determined by Welch’s unpaired t test. Significance between more than 2 groups was determined by one-way ANOVA with post hoc Tukey’s or Dunnett’s multiple comparisons tests, as appropriate, to determine differences between specific groups. *P < .05; **P < .01; ***P < .001. See also supplemental Figure 4.
CO generated by HO-1–dependent heme breakdown upregulates the PPP. (A) Schematic showing the release of CO from CORM3 upon reaction with water and the generation of inactivated CORM3 (iCORM3). (B) mRNA expression of Glut1, G6pd, and Pgd in BMDMs treated with vehicle, 35-70 µM CORM3, or 35-70 µM iCORM3 for 6 hours. (n = 4). Corresponding representative western blot analysis of G6PD and PGD protein in BMDMs treated with vehicle, 100 µM iCORM3 (iCO), or 50-100 µM CORM3 (CO) for 12 or 24 hours. (C) G6PD activity, measured as the rate of NAPDH synthesis, in BMDMs treated with vehicle, 100 µM CORM3, or 100 µM iCORM3 for 6 or 24 hours (n = 3-4). (D) Intracellular NADPH levels measured from BMDMs treated with vehicle, 50-100 µM CORM3, or 50-100 µM iCORM3 for 6 hours (n = 4). (E) mRNA expression of M1 macrophage markers in BMDMs treated with vehicle, iCORM3, or 50 µM CORM3 for 6 hours (n = 4). (F) mRNA expression of M2 macrophage markers in BMDMs treated with vehicle, iCORM3, or 50 µM CORM3 for 6 hours (n = 4). (G) mRNA expression of Mox macrophage markers in BMDMs treated with vehicle, iCORM3, or 50 µM CORM3 for 6 hours (n = 4). (H) Schematic representing feed-forward regulation of PPP by heme breakdown mediated by CO. Data are represented as mean ± SEM. Statistical significance between 2 groups was determined by Welch’s unpaired t test. Significance between more than 2 groups was determined by one-way ANOVA with post hoc Tukey’s or Dunnett’s multiple comparisons tests, as appropriate, to determine differences between specific groups. *P < .05; **P < .01; ***P < .001. See also supplemental Figure 4.
Treatment of BMDMs with CORM3 significantly reduced basal and maximal respiration (Figure 6A) as well as extracellular acidification rate, indicating a decrease in glycolytic activity (Figure 6B). The suppression of both mitochondrial respiration and glycolysis by CORM3 drove macrophages to a bioenergetically suppressed state (Figure 6C), which may explain why heme loading does not induce the glycolytic phenotype characteristic of M1 macrophages.44 As with heme loading, CORM3 treatment decreased intracellular ATP in a dose-dependent manner (Figure 6D). However, CORM3 treatment did not downregulate expression of genes encoding components of the electron transport chain complexes (supplemental Figure 5A), indicating that CO-induced decrease in oxygen consumption and ATP production were independent of changes in OXPHOS gene expression. Together these data demonstrate that CO mediates the metabolic changes characteristic of heme-loaded macrophages.
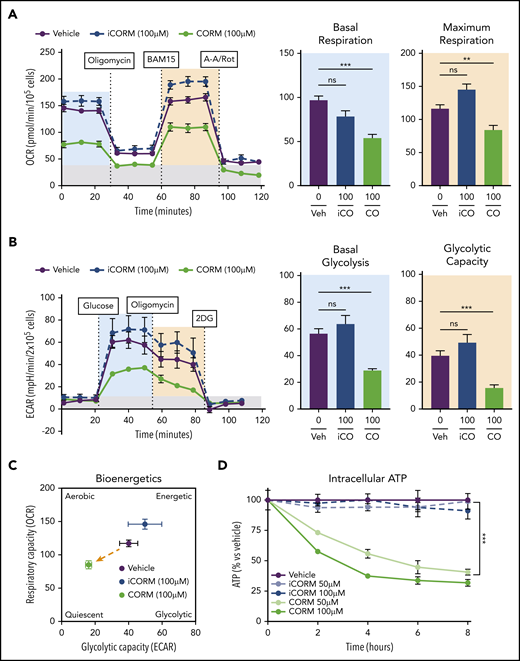
CO mimics the metabolic phenotype of heme-loaded macrophages. (A) MST of BMDMs treated with vehicle, 100 µM iCORM3, or 100 µM CORM3 for 6 hours (n ≥3). The OCR was measured initially (basal; blue) and after injection of 1 µM oligomycin, 2 µM BAM15 (maximal; green), 10 µM antimycin A, and 1 µM rotenone (gray; non-mitochondrial). Basal and maximal OCR were calculated by subtracting the mean OCR of the first 3 (basal) or post-BAM15 (maximal) measurements from the mean OCR of the post-AA/Rot measurements. Reserve capacity is the difference in maximal and basal respiratory capacity. (B) GST of BMDMs treated with vehicle, 100 µM iCORM3, or 100 µM CORM3 for 6 hours (n ≥3). The ECAR was measured after injection of 20 mM glucose, 1µM oligomycin, and 80 mM 2-deoxyglucose (2-DG) to produce the basal (blue), stressed (green), and background (gray) ECAR, respectively. Basal and stressed ECAR were calculated by subtracting the mean ECAR of the post-glucose (basal) or post-oligomycin (stressed) measurements from the mean ECAR of the post-2-DG measurements. (C) Bioenergetics plot relates the respiratory capacity of the cells (based on maximal OCR; y-axis) to the glycolytic capacity (based on stressed ECAR; x-axis) in BMDMs treated with CORM3 or iCORM3 for 6 hours (n ≥3). (D) as measured by luminescent signal of the Cell-Titer Glo ATP Assay and presented as percent of initial vehicle control (n = 5). Data are represented as mean ± SEM. Statistical significance between 2 groups was determined by Welch’s unpaired t test. Significance between more than 2 groups was determined by one-way ANOVA with post hoc Tukey’s or Dunnett’s multiple comparisons tests, as appropriate, to determine differences between specific groups. ns, not significant. *P < .05; **P < .01; ***P < .001. See also supplemental Figure 5.
CO mimics the metabolic phenotype of heme-loaded macrophages. (A) MST of BMDMs treated with vehicle, 100 µM iCORM3, or 100 µM CORM3 for 6 hours (n ≥3). The OCR was measured initially (basal; blue) and after injection of 1 µM oligomycin, 2 µM BAM15 (maximal; green), 10 µM antimycin A, and 1 µM rotenone (gray; non-mitochondrial). Basal and maximal OCR were calculated by subtracting the mean OCR of the first 3 (basal) or post-BAM15 (maximal) measurements from the mean OCR of the post-AA/Rot measurements. Reserve capacity is the difference in maximal and basal respiratory capacity. (B) GST of BMDMs treated with vehicle, 100 µM iCORM3, or 100 µM CORM3 for 6 hours (n ≥3). The ECAR was measured after injection of 20 mM glucose, 1µM oligomycin, and 80 mM 2-deoxyglucose (2-DG) to produce the basal (blue), stressed (green), and background (gray) ECAR, respectively. Basal and stressed ECAR were calculated by subtracting the mean ECAR of the post-glucose (basal) or post-oligomycin (stressed) measurements from the mean ECAR of the post-2-DG measurements. (C) Bioenergetics plot relates the respiratory capacity of the cells (based on maximal OCR; y-axis) to the glycolytic capacity (based on stressed ECAR; x-axis) in BMDMs treated with CORM3 or iCORM3 for 6 hours (n ≥3). (D) as measured by luminescent signal of the Cell-Titer Glo ATP Assay and presented as percent of initial vehicle control (n = 5). Data are represented as mean ± SEM. Statistical significance between 2 groups was determined by Welch’s unpaired t test. Significance between more than 2 groups was determined by one-way ANOVA with post hoc Tukey’s or Dunnett’s multiple comparisons tests, as appropriate, to determine differences between specific groups. ns, not significant. *P < .05; **P < .01; ***P < .001. See also supplemental Figure 5.
Macrophages undergo metabolic adaptation in clinically relevant models of heme clearance
During episodes of hemolysis, macrophages in the spleen and liver are responsible for detoxifying heme from the extracellular environment.29,45 To examine the metabolic state of these organ systems in a model of chronic hemolysis, we used Townes SCD transgenic mice, which express human β-globin instead of the endogenous mouse protein.46-48 When compared with mice that expressed normal human hemoglobin (βA mice), mice that expressed sickle hemoglobin (βS mice) had significantly higher levels of free heme in their serum (Figure 7A). Compared with βA mice, spleens of βS mice showed increased messenger RNA expression of Hmox1 and Pgd and a trend toward increased expression of G6pd (Figure 7B). Expression of Hmox1, G6pd, and Pgd was also significantly increased in the livers of βS mice (Figure 7C), which corresponded to a significant increase in liver G6PD activity (Figure 7D). Remarkably, liver G6PD activity positively correlated with serum heme levels in βS mice (Figure 7E).
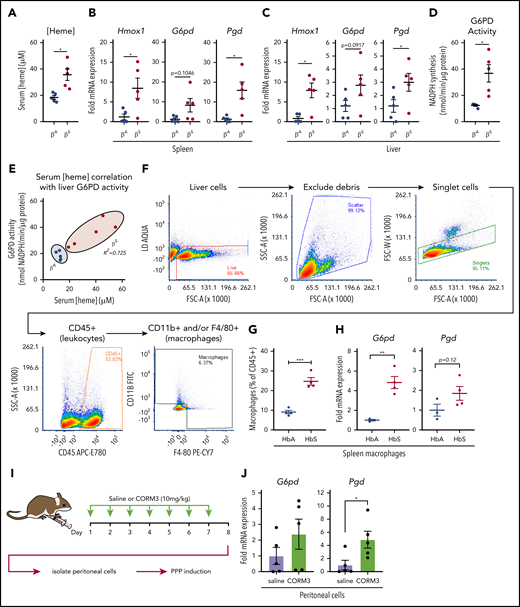
Macrophages undergo metabolic adaptation in an in vivo model of hemolytic SCD. (A) Blood was collected from transgenic B6/129 knockin mice (Townes SCD model) that expressed human hemoglobin α homozygous for either the βA or βS sickle hemoglobin, and serum heme concentrations were measured (n = 5 per group). (B) mRNA expression of Hmox1, G6pd, and Pgd in spleens of βA or βS mice (n = 5 per group). (C) mRNA expression of Hmox1, G6pd, and Pgd in livers of βA or βS mice (n = 5). (D) G6PD activity measured as the rate of NADPH synthesis in supernatants of whole liver lysates of βA or βS mice (n = 5 per group). (E) Correlation of serum heme concentration with liver G6PD activity in βA or βS mice (n = 5 per group). (F) Representative gating strategy for FACS of macrophage-like cells from spleens of βA or βS mice. (G) Abundance of macrophages as percentage of live CD45+ cells from βA or βS mice (n = 4). (H) mRNA expression of G6pd and Pgd in FACS-sorted splenic macrophages from βA or βS mice. (I) Schematic describing CORM3 treatment regimen and peritoneal cell isolation. (J) mRNA expression of G6pd and Pgd in isolated peritoneal cells from mice treated with saline or CORM3 for 7 days (n = 5). Data are represented as mean ± SEM. Statistical significance between 2 groups was determined by Welch’s unpaired t test. Significance between more than 2 groups was determined by one-way ANOVA with post hoc Tukey’s or Dunnett’s multiple comparisons tests, as appropriate, to determine differences between specific groups. Correlation analysis is based on determination of Pearson coefficient, and significant correlations are presented as R2 values. FITC, fluorescein isothiocyanate; SSC-A, side scatter area.*P < .05; **P < .01; ***P < .005.
Macrophages undergo metabolic adaptation in an in vivo model of hemolytic SCD. (A) Blood was collected from transgenic B6/129 knockin mice (Townes SCD model) that expressed human hemoglobin α homozygous for either the βA or βS sickle hemoglobin, and serum heme concentrations were measured (n = 5 per group). (B) mRNA expression of Hmox1, G6pd, and Pgd in spleens of βA or βS mice (n = 5 per group). (C) mRNA expression of Hmox1, G6pd, and Pgd in livers of βA or βS mice (n = 5). (D) G6PD activity measured as the rate of NADPH synthesis in supernatants of whole liver lysates of βA or βS mice (n = 5 per group). (E) Correlation of serum heme concentration with liver G6PD activity in βA or βS mice (n = 5 per group). (F) Representative gating strategy for FACS of macrophage-like cells from spleens of βA or βS mice. (G) Abundance of macrophages as percentage of live CD45+ cells from βA or βS mice (n = 4). (H) mRNA expression of G6pd and Pgd in FACS-sorted splenic macrophages from βA or βS mice. (I) Schematic describing CORM3 treatment regimen and peritoneal cell isolation. (J) mRNA expression of G6pd and Pgd in isolated peritoneal cells from mice treated with saline or CORM3 for 7 days (n = 5). Data are represented as mean ± SEM. Statistical significance between 2 groups was determined by Welch’s unpaired t test. Significance between more than 2 groups was determined by one-way ANOVA with post hoc Tukey’s or Dunnett’s multiple comparisons tests, as appropriate, to determine differences between specific groups. Correlation analysis is based on determination of Pearson coefficient, and significant correlations are presented as R2 values. FITC, fluorescein isothiocyanate; SSC-A, side scatter area.*P < .05; **P < .01; ***P < .005.
We then used FACS to isolate cells that expressed macrophage markers from spleens of βA and βS mice (representative gating strategy in Figure 7F). Interestingly, we observed that a larger proportion of the CD45+ cells in the spleens of βS mice were positive for macrophage markers, including F4/80 and CD11b (Figure 7G). Furthermore, FACS-isolated macrophages demonstrated significantly higher expression of G6pd and a trend toward increased Pgd levels (Figure 7H). Because we observed that the PPP is upregulated locally in tissues in which HMOX1 activity was increased, we tested the hypothesis that local production of CO is sufficient to upregulate the PPP. We treated wild-type mice with either saline or CORM3 (10 mg/kg) for 7 days via intraperitoneal injection (Figure 7I) and examined expression of PPP genes in isolated peritoneal cells. Peritoneal cells from mice treated with CORM3 showed an increase in expression of G6pd and Pgd compared with cells isolated from mice that received saline control (Figure 7J). Taken together, these data demonstrate that chronic hemolysis in vivo is associated with an upregulation of the PPP in cells and tissues central to heme clearance and that increased PPP activity is correlated with increased circulating heme levels seen in SCD.
Discussion
Efficient heme clearance is vital to prevent massive oxidative tissue damage in settings of hemolysis. Macrophages are specialized to deal with excessive free heme, and we demonstrate how heme-loaded macrophages adapt their metabolism to maintain redox homeostasis, to prevent cell death, and to efficiently detoxify heme. Although extracellular heme has been shown to act as a danger signal in proinflammatory contexts,7,49 the metabolic adaptations that allow macrophages to detoxify heme remained unclear. Here we show that intracellular free heme induces a specific metabolic shift in macrophages (Figure 1), which involves downregulation of oxidative phosphorylation and a minimal change in aerobic glycolysis despite increased uptake of glucose, which is used by the PPP at the apparent expense of decreased intracellular ATP. Upregulation of the PPP (Figure 2) is controlled at the transcriptional level (Figure 3) as well as by the function of metabolic enzymes, and pharmacologic inhibition of the PPP revealed that this metabolic pathway is essential for heme degradation in macrophages (Figure 4).
The PPP is a major source of the reducing equivalent NADPH,50 and we show that heme-loaded macrophages had increased activity of G6PD, which resulted in increased NADPH production. Furthermore, pharmacologic inhibition of G6PD increased the level of accumulated heme, decreased the accumulation of NADPH, and prevented heme degradation by macrophages (Figure 4). As expected, heme increased oxidative stress within the cell via oxidation of glutathione. In addition, inhibition of G6PD further increased the oxidation level in heme-loaded macrophages. Genetic deficiency of G6PD, the initial enzyme in the PPP and a key generator of cellular NADPH, is the most common inherited hemolytic anemia worldwide,2 and patients with G6PD deficiency are susceptible to hemolytic events after exposure to oxidative stresses such as infection or certain drugs.51 Our data suggest that G6PD deficiency impairs the macrophage response to oxidative stress and underscore the importance of macrophage metabolic adaptation in maintaining homeostasis in response to free heme.
Macrophages are able to accumulate heme intracellularly at concentrations deleterious to other cell types and thus play an essential role in heme clearance.52 Interestingly, blockade of NADPH production via inhibition of G6PD negated the heme-induced upregulation of the PPP, suggesting that the activity of this pathway in response to heme results in positive feedback that stimulates its own upregulation. In response to heme, cells such as macrophages upregulate the expression of Hmox1, which metabolizes heme to biliverdin in an NADPH-dependent manner, releasing Fe2+ and CO in this process.53 We show that HMOX1 activity is required for the upregulation of the PPP in heme-loaded macrophages, and that CO itself can induce the metabolic shift toward the PPP in vitro and in vivo. In the absence of heme, CO drives macrophages toward a bioenergetically suppressed phenotype (Figure 6), similar to the profile we previously observed in Mox macrophages.38
We further demonstrate that this heme-CO–induced metabolic switch to the PPP is independent of the activity of the transcription factors Nrf2 and Hif1-α. CO has been shown to stimulate gene expression,54 and we show that addition of a CO-releasing molecule (CORM3) to BMDMs upregulates the expression of enzymes regulating the PPP (G6pd and Pgd) and Glut1 in the absence of heme (Figure 5). Moreover, CO treatment produces changes in macrophage bioenergetics that parallel heme loading, and administration of exogenous CORM3 in vivo results in a local upregulation of the PPP (Figure 7J). This is consistent with a model by which CO released via the activity of HMOX1 drives the shift in macrophage metabolism, suggesting a local feed-forward mechanism that is induced by heme catabolism itself. The mechanisms by which CO causes a metabolic switch to the PPP in macrophages remain unclear. CO is a highly active intracellular signaling molecule55-58 and acts via several mechanisms, including direct binding to cytosolic enzymes, transcription factors such as Hif1-α, and components of the electron transport chain. In erythrocytes, CO has been shown to promote antioxidant adaptations by promoting the release of GSH from hemoglobin and upregulating the PPP.59 Previous studies in cancer cells have demonstrated that CO inhibits the hydrogen sulfide (H2S)–producing enzyme cystathionine β synthase, which results in a loss of 6-phosphofructo-2-kinase/fructose-2,6-biphosphatase 3 stability. This results in lower intracellular levels of fructose-2,6-bisphosphate and a subsequent increase in glucose through the PPP.60 Furthermore, CO has been shown to induce activation of HIF1-α to promote a cytoprotective transcriptional program61 ; however, our results indicate that in heme-loaded cells, the induction of the PPP is independent of HIF1-α.
Finally, we show that the PPP is upregulated in macrophages in a mouse model of SCD (Figure 7). Cells of the reticuloendothelial system are responsible for the clearance of erythrocytes62 and free heme63 : red pulp macrophages in the spleen are responsible for removing damaged erythrocytes,64,65 and monocyte-derived macrophages are recruited to the liver to support Kupffer cell–mediated clearance of erythrocytes and heme in SCD.66 Our data show that the PPP is upregulated in the livers and spleens of SCD mice and that the NADPH-producing activity of the PPP is directly correlated with serum heme levels in these mice. We propose that metabolic adaptation is key for heme clearance by reticuloendothelial cells and that metabolic adaptation of these cells is necessary to deal with the homeostatic stress of chronic hemolysis.
Together, our findings point to a central role of metabolic adaptation in cells that deal with excessive heme concentrations, and therefore may be the basis for the identification of therapies that can be used to enhance efficient heme clearance in pathological settings such as hemolytic anemia, SCD, β-thalassemia, and in other settings in which erythrocyte turnover is increased. Currently, CO therapy is being investigated as an intervention in stroke,67 acute lung injury,68 ischemia-reperfusion injury,69,70 acute respiratory distress syndrome,71 and SCD.72,73 Our findings point to an additional therapeutic potential of CO, which has an impact on heme clearance in SCD, sepsis,9 and malaria.10,11
All reasonable requests for data related to this manuscript will be fulfilled by the corresponding author, Norbert Leitinger.
The online version of this article contains a data supplement.
The publication costs of this article were defrayed in part by page charge payment. Therefore, and solely to indicate this fact, this article is hereby marked “advertisement” in accordance with 18 USC section 1734.
Acknowledgments
The authors thank Clint Upchurch for technical support with experiments. Fluorescence-activated cell sorting (FACS) was performed by the Flow Cytometry Core Facility at the University of Virginia.
This work was supported by a grant from the National Institutes of Health (NIH), National Institute of Diabetes and Digestive and Kidney Diseases (R01 DK096076) (N.L.) and predoctoral NIH Fellowship (5 F31 DK108553-02) (V.S.); by National Heart, Lung, and Blood Institute grants (P01 HL120840) (N.L. and B.E.I.) and (R01 HL088554) (B.E.I.); by a grant from National Institute of General Medical Sciences, Medical Scientist Training Program (T32 GM007267) (S.Y.), Pharmacological Sciences Training Grant (T32 GM007055-44) (S.Y.), and Pharmacological Sciences Training Grant 5 T32 GM007055-40 (V.S.); and by American Heart Association Fellowship 15 PRE 255600036 (V.S.).
Authorship
Contribution: N.L. conceived the project, designed experiments, analyzed data, and helped write the manuscript; G.F.P.B. conceived the project, designed and conducted experiments, analyzed data, and helped write the manuscript; S.Y. and V.S. designed and conducted experiments, analyzed data, and helped write the manuscript; T.E.F. conducted experiments and analyzed data; B.E.I. provided reagents and animal models and analyzed data; and all authors critically read, corrected, and approved the final version of the manuscript.
Conflict-of-interest disclosure: The authors declare no competing financial interests.
The current affiliation for G.F.P.B. is Centre Méditerranéen de Médecine Moléculaire (C3M), INSERM U1065, Nice, France.
Correspondence: Norbert Leitinger, Department of Pharmacology, University of Virginia School of Medicine, 1340 Jefferson Park Ave, Charlottesville, VA 22908; e-mail: nl2q@virginia.edu.

This feature is available to Subscribers Only
Sign In or Create an Account Close Modal