


Background: Hydroxyurea is the standard of care for children with sickle cell anemia (SCA). We have developed and prospectively validated a population pharmacokinetics (PK)-based dosing model to initiate hydroxyurea at a personalized dose that achieves maximum tolerated dose (MTD) quickly and produces a more robust HbF response than traditional weight-based dosing. HbF is distributed unequally across RBCs, and most mature RBCs have no detectable HbF. Genetic traits and hydroxyurea increase the number of HbF-containing RBCs. Measurement of HbF alone reflects an average of the HbF content across all RBCs in a lysate, so the varying, cell-specific compartmentalization of HbF across RBCs is not evaluated. In contrast, flow cytometry can be used to detect HbF-containing RBCs (F-cells) and non-F-cells, and the amount of HbF per F-cell (F/F-cell) can also be quantified. Prior studies indicate that an F/F-cell of 10 pg should completely prevent sickling.
Methods:We studied participants in the Therapeutic Response Evaluation and Adherence Trial (TREAT, ClinicalTrials.gov NCT02286154), which is a prospective study with the primary objective of developing and evaluating a population PK model to predict the MTD of hydroxyurea for individualized dosing. Individuals with genotype-confirmed HbSS or sickle-β0-thalassemia (both classified here as SCA) were enrolled; none had gene-deletion HPFH. We recently developed a multiparametric flow cytometric assay (F-cell analysis) to measure the amount and distribution of HbF in all RBCs and in immature (CD71+) reticulocytes. The total number of HbF-containing RBCs (F-cells) and HbF-containing immature reticulocytes (F-retics) were enumerated. Mean concentration of HbF per F-cell (F/F-cell) was calculated from F-cell number, Hb F quantitation by capillary zone electrophoresis, and automated blood counts (RBC count and hemoglobin concentration).
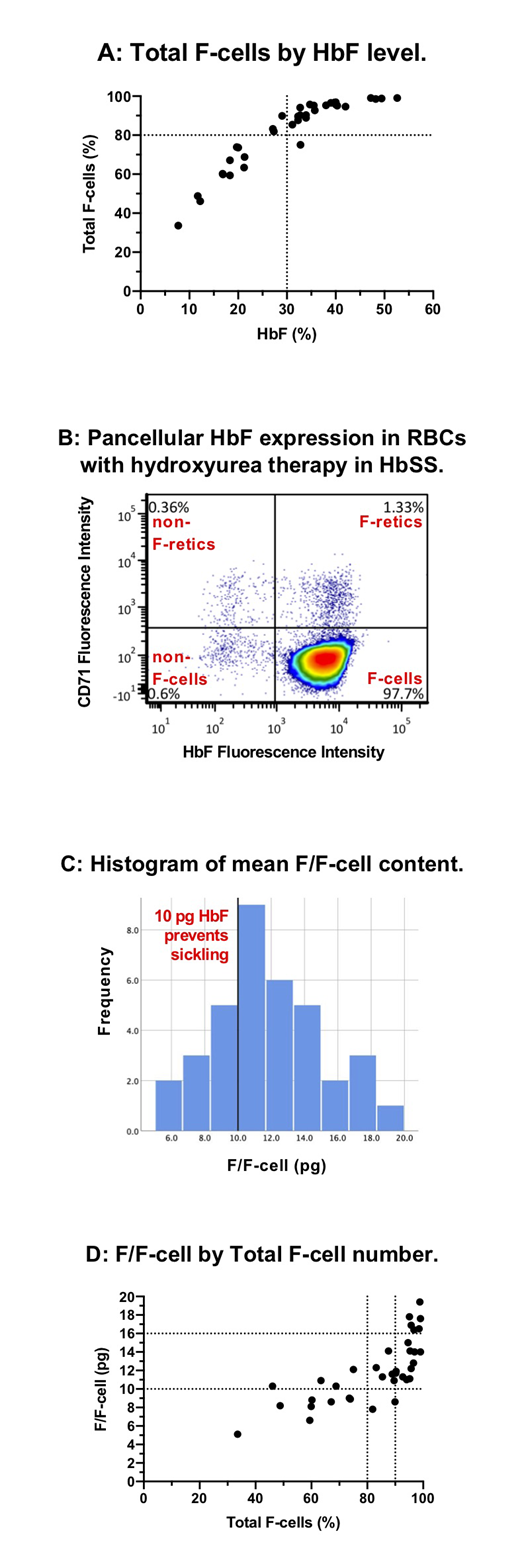
Results:To date, 36 TREAT patients have had F-cell analysis with a mean age of 5.6 years (median 4.1; range 1.2-21.1). Mean age at start of hydroxyurea was 3.2 years (median 1.0; range 0.5-19.5) with a mean duration of hydroxyurea therapy of 2.4 years (median 2.1; range 0.5-4.1). Mean dose of hydroxyurea at the time of F-cell analysis was 27.0 mg/kg (median 27.6; range 17.8-38.6). HbF induction was robust with a mean HbF level of 30.8% (median 32; range 7.7-52.6). HbF level had a curvilinear association with F-cell fraction (Figure A). Mean total F-cell fraction (percent of all RBCs that are F-cells) was 82.2% (median 89.8; range 33.6-99.0); 24/36 (67%) had >80% F-cells, and 17/36 (47%) had >90% F-cells, indicating the ability to achieve a near pancellular distribution of HbF with PK-guided hydroxyurea therapy in a significant fraction of patients, especially those with high adherence (Figure B). The mean F/F-cell was 11.9 pg (median 11.5; range 5.1-19.4; Figure C), and 26/36 (72%) had an mean F/F-cell ≥10 pg, an amount of HbF in an individual RBC that completely prevents sickling (mean F/F-cell does not reflect the variance of F/F-cell across the RBC population). All patients who had a HbF level ≥30% (22/36, 61%) had mean F/F-cell ≥10 pg (Figure D). Of those with total F-cells ≥80%, 22/24 (91%) had mean F/F-cell ≥10 pg. As expected, higher total F-cells and mean F/F-cell were associated with higher hemoglobin concentration and lower reticulocyte counts. Mean F/F-cell >16 pg was associated with a mean hemoglobin >10 g/dL and mean absolute reticulocyte count <100x106/mm3. Bland-Altman analysis of total F-cells and F-retics showed a mean bias of 33.5 percentage points (total F-cells > F-retics), indicating the difference between F-cell production (F-retics) and peripheral survival advantage of F-cells. For F-cells >80%, however, the difference between F-cell and F-retic fraction decreased rapidly, consistent with little non-F-cell production by the bone marrow.
Discussion: PK-guided dosing of hydroxyurea at MTD can achieve near-pancellular HbF expression in a large fraction of patients with sickle cell anemia. Our data suggest that an F-cell fraction of 80% and a mean F/F-cell of 10 pg should be the minimum goals for hydroxyurea therapy to minimize or prevent sickling, hemolysis, and anemia. These same minimum goals should apply to any HbF-inducing therapy, including genetic therapies, and F-cell analysis should be included in the standard laboratory analysis for these treatments.
Quinn:Celgene: Membership on an entity's Board of Directors or advisory committees; Amgen: Other: Research Support. Ware:Bristol Myers Squibb: Other: Research Drug Donation; Addmedica: Other: Research Drug Donation; Global Blood Therapeutics: Membership on an entity's Board of Directors or advisory committees; Agios: Membership on an entity's Board of Directors or advisory committees; Nova Laboratories: Membership on an entity's Board of Directors or advisory committees; CSL Behring: Membership on an entity's Board of Directors or advisory committees; Novartis: Other: DSMB.
This icon denotes a clinically relevant abstract

This feature is available to Subscribers Only
Sign In or Create an Account Close Modal