

Introduction
Baseline metabolic tumor volume (bMTV) is increasingly studied as a prognostic factor for classical Hodgkin lymphoma (cHL). Before implementation as a clinical prognostic marker, it is important to investigate different methods for deriving bMTV since not all methods are suitable for each type of malignancy. Semi-automatic segmentation is influenced less by observer bias and variability compared to manual segmentation and might therefore be more reliable for assessing bMTV. However, not much is known about the use of different semi-automatic segmentation methods and how this influences the prognostic value of bMTV in cHL. Here we present a comparison of bMTV derived with 6 semi-automatic segmentation methods. In addition, a visual quality scoring of all segmentations is performed to gain insight into which segmentation methods could be used to determine bMTV in cHL.
Methods
We selected 61 baseline 18FDG-PET-CT scans that met specific quality criteria (http://EARL.EANM.org) from patients treated in the Transplant BRaVE study for relapsed/refractory cHL [Blood 2018 132:2923]. Six semi-automatic segmentation methods were applied using the Accurate tool, an in-house developed software application which has already been validated in other types of cancer, including diffuse large B-cell lymphoma [Eur Radiol 2019 06178:9, J Nucl Med. 2018;59(suppl 1):1753]. We compared two fixed thresholds (SUV4.0 and SUV2.5), two relative thresholds (A50P: a contrast corrected 50% of standard uptake value (SUV) peak, and 41max: 41% of SUVmax), and 2 majority vote methods, MV2 and MV3 selecting delineations of ≥2 and ≥3 of previously mentioned methods, respectively.
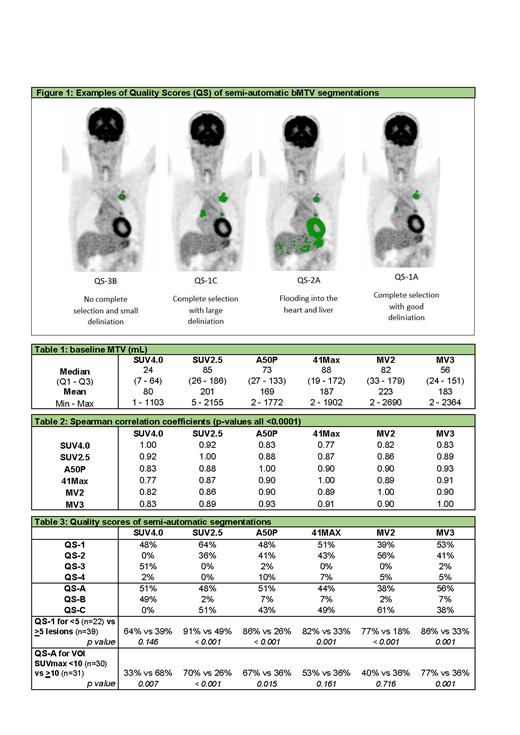
Quality of the segmentation was scored using visual quality scores (QS) by two reviewers (JD, GZ): QS-1 for complete selections containing all visible tumor localizations; QS-2 when segmentations 'flood' into regions with physiological FDG uptake; QS-3 when segmentations do not select all visible lesions; or QS-4: a combination of QS-2 and QS-3. In addition, the quality of the delineation was rated: QS-A for good visual delineation of lesions; QS-B for too small delineation; and QS-C for too large delineation. All segmentations that had score QS-2 or QS-4 were manually adapted by erasing regions that flooded into areas with high physiological uptake. Figure 1 shows examples of the quality scores.
We used Spearman's correlations to compare the bMTV of all semi-automatic methods. Comparison of quality scores was performed using chi-square tests.
Results
The median bMTV differed substantially among the segmentation methods, ranging from 24 mL for SUV4.0 to 88 mL for 41max (Table 1). However, there was a high significant correlation (p <0.0001) between all methods with spearman coefficients ranging between 0.77 and 0.93 (Table 2).
The quality of the segmentation was best using the SUV2.5 threshold with QS-1 in 64% of scans and delineation was best for MV3 with QS-A in 56% (Table 3). The segmentation quality was significantly better when less than 5 lesions were present on a scan. A large difference was observed for SUV2.5 with score QS-1 in 91% of cases for scans with <5 lesions (n=22), compared to QS-1 in 49% for scans containing ≥5 lesions (n=39) (p <0.001; Table 3). The delineation quality did not depend on the number of lesions. However, for SUV2.5, A50P and MV3, the delineation was considered better when the SUVmax of selected volumes of interest (VOI) was <10, while SUV4.0 performed significantly better with a SUVmax ≥10 (Table 3).
Conclusions
We found a good correlation between all methods, suggesting that the segmentation method used will probably not influence the predictive value of bMTV. Ease of use was highest with a semi-automatic segmentation of bMTV using the SUV2.5 segmentation method. SUV2.5 had the best visual quality and needed least manual adaptation. To investigate possible implementation of bMTV in clinical practice, we will validate the quality of the segmentation methods and the predictive value of bMTV in a larger cohort of patients with other prognostic parameters including quantitative radiomics analysis of baseline PET-scans.
Kersten:Bristol-Myers Squibb: Honoraria, Research Funding; Gilead: Honoraria; Roche: Honoraria, Research Funding; Celgene: Honoraria, Research Funding; Novartis: Honoraria; Mundipharma: Honoraria, Research Funding; Amgen: Honoraria, Research Funding; Miltenyi: Honoraria; Takeda Oncology: Research Funding; Kite Pharma: Honoraria, Research Funding. Zijlstra:Janssen: Honoraria; Gilead: Consultancy, Honoraria, Membership on an entity's Board of Directors or advisory committees; Takeda: Consultancy, Honoraria, Membership on an entity's Board of Directors or advisory committees; Roche: Consultancy, Honoraria, Membership on an entity's Board of Directors or advisory committees.

This feature is available to Subscribers Only
Sign In or Create an Account Close Modal