

Global gene expression profiling of the tumor microenvironment in diffuse large B-cell lymphoma (DLBCL) has revealed broad innate immune signatures that distinguish the heterogeneous disease subtypes and correlate with good treatment outcome. However, we still lack tools to identify the relatively large group of patients that are refractory to initial therapy and have a dismal prognosis. Here, we used mass cytometry and serum profiling in a systems-level approach to analyze immune responses in 36 patients with aggressive B cell lymphoma and age- and sex-matched healthy controls. Stochastic neighbor embedding (t-SNE) analysis of protein profiles divided patients into two distinct clusters, with cluster 2 representing patients with a more severe deviation in their protein expression compared to healthy controls. Patients in cluster 2 showed a more dramatic perturbation of their immune cell repertoires with expansion of myeloid-derived suppressor cells (MDSCs), increased T cell differentiation and significantly higher expression of metabolic markers such as GLUT-1 and activation markers, including Ki67, CD38 and PD-1. An extended analysis of serum protein profiles in two independent cohorts (n=69 and n=80 patients, respectively) revealed that that the identified systemic immune signatures were linked to poor progression free survival (PFS) and inferior overall survival (OS). Immune monitoring during chemo-immunotherapy showed that most patients normalized their serum protein profiles. Notably, non-responding patients retained higher than normal expression of several proteins, including PD-L1, CD70, IL-18, granzyme A and CD83. These studies demonstrate distinct patterns of disease-driven alterations in the systemic immune response of DLBCL patients that are associated with poor survival and persist in patients who are refractory to therapy.
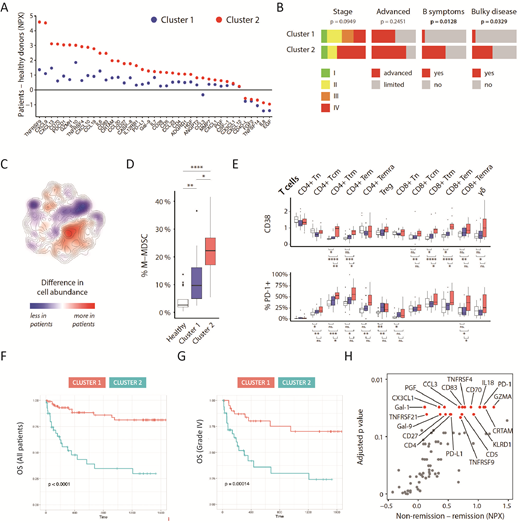
Figure 1 System-level immune signatures associated with poor prognosis in DLBCL.A) Altered serum profiles in patients compared to healthy controls. Two clusters of patients were identified based on t-SNE analysis of serum profiles. B) Patients in cluster 2 had bulky disease and B symptoms. C) t-SNE map of all patients (n=36) and controls (n=17). Relative abundance of cells from healthy controls and patients in all areas of the t-SNE clustering, highlighting cell subsets that are larger or smaller in patients compared to healthy donors. Colors indicate the difference in kernel density estimation of the t-SNE data for patients and healthy controls. D) Abundance of monocytic myeloid-derived suppressor cells as percentage of all CD45+ cells in healthy donors and the two patient clusters. White, Healthy controls; Blue, Cluster 1; Red, Cluster 2. E) Major phenotypic differences between patient clusters shown as mean mass intensity (MMI) or percent positive cells for selected markers (CD38 and PD-1) across multiple subsets. White, Healthy controls; Blue, Cluster 1; Red, Cluster 2. F-G) Overall survival in patients with serologically defined immune signatures belonging to cluster 1 or 2. H) Abundance of serum proteins in patients that stayed in remission (n=24) compared to those that did not (n=6).
Olweus:Gilead Kite: Research Funding; Intellia: Consultancy, Honoraria, Membership on an entity's Board of Directors or advisory committees. Wahlin:Roche and Gilead: Consultancy. Fehniger:Cyto-Sen Therapeutics: Consultancy; Horizon Pharma PLC: Other: Consultancy (Spouse). Holte:Novartis: Honoraria, Other: Advisory board. Kolstad:Nordic Nanovector: Membership on an entity's Board of Directors or advisory committees, Research Funding; Merck: Research Funding. Malmberg:Fate Therapeutics, Inc.: Consultancy, Research Funding; Vycellix: Consultancy, Membership on an entity's Board of Directors or advisory committees.

This feature is available to Subscribers Only
Sign In or Create an Account Close Modal