

Key Points
VirScan highlights both donor and recipient contributions to the viral antibody repertoire, and acquisition of new viral epitopes after HCT.
Age, CMV serostatus, and receipt of glucocorticoids correlate with recognition of viral epitopes after HCT.

Abstract
Further insight into humoral viral immunity after hematopoietic cell transplantation (HCT) could have potential impact on donor selection or monitoring of patients. Currently, estimation of humoral immune recovery is inferred from lymphocyte counts or immunoglobulin levels and does not address vulnerability to specific viral infections. We interrogated the viral antibody repertoire before and after HCT using a novel serosurvey (VirScan) that detects immunoglobulin G responses to 206 viruses. We performed VirScan on cryopreserved serum from pre-HCT and 30, 100, and 365 days after myeloablative HCT from 37 donor-recipient pairs. We applied ecologic metrics (α- and β-diversity) and evaluated predictors of metrics and changes over time. Donor age and donor/recipient cytomegalovirus (CMV) serostatus and receipt systemic glucocorticoids were most strongly associated with VirScan metrics at day 100. Other clinical characteristics, including pre-HCT treatment and conditioning, did not affect antiviral repertoire metrics. The recipient repertoire was most similar (pairwise β-diversity) to that of donor at day 100, but more similar to pre-HCT self by day 365. Gain or loss of epitopes to common viruses over the year post-HCT differed by donor and recipient pre-HCT serostatus, with highest gains in naive donors to seropositive recipients for several human herpesviruses and adenoviruses. We used VirScan to highlight contributions of donor and recipient to antiviral humoral immunity and evaluate longitudinal changes. This work builds a foundation to test whether such systematic profiling could serve as a biomarker of immune reconstitution, predict clinical events after HCT, or help refine selection of optimal donors.
Introduction
Following myeloablative allogeneic hematopoietic cell transplantation (HCT), full lymphocyte reconstitution and resolution of hypogammaglobulinemia may be protracted.1,2 Human viral pathogens number in the hundreds, with thousands of possible strains, and clinically used proxies for risk of viral infection, such as absolute lymphocyte count (ALC) or total immunoglobulin levels (immunoglobulin G [IgG]), do not strongly predict protection against specific viral pathogens. Following HCT, preformed antibodies from the recipient continue to circulate, with an average half-life of ∼26 days, and are thought to be slowly replaced by donor IgG following establishment of the donor B cell and plasma cell population much later.3-6 Much is known about how cytomegalovirus (CMV) impacts clinical outcomes, including death, following HCT, and recent data demonstrate the importance of humoral immunity and far-reaching immunologic effects of this virus.7-11 Much less is known about the reconstitution of immunity toward other viruses,12 the role of other viruses in post-HCT outcomes, or how other factors associated with altered B-cell responses, including graft-versus-host disease (GVHD) or CMV infection, might influence reconstitution of humoral antiviral immunity.13,14
We longitudinally employed VirScan,15 a novel serosurvey, to evaluate new metrics to define humoral antiviral immunity (the viral antibody repertoire). The purpose of this study was to determine whether we could detect differences in the donor and recipient repertoire, define clinical or demographic characteristics that predict antiviral repertoire measures, and evaluate for gain or loss of viral pathogen recognition after HCT.
Methods
We selected stored serum samples from 37 donor/recipient pairs who received a first allogeneic HCT at our center. We prespecified a cohort with HLA-matched or partially mismatched donors from within 2 available cohorts in our repository who had availability of pretransplant donor (pre-D) and recipient (pre-R) samples, as well as recipient samples at 30, 100, and 365 days after HCT. Sample size was predetermined as the maximum number of donor/recipient sample suites that could be sequenced alongside the VirScan library in a single flow cell, with a targeted 10× read depth for samples and 100× depth for the library. All patients provided signed consent for use of leftover biologic materials, and the Fred Hutchinson Cancer Research Center (FHCRC) Institutional Review Board approved this study.
Laboratory methods
We amplified the VirScan T7 bacteriophage library from the original library (Elledge Laboratory) according to the manufacturer’s suggested protocol (EMD Millipore) and sequenced the product to quantify the frequency of targets in our input library. VirScan was carried out according to the previously published method with the following minor modifications.15 We first quantified total IgG from each sample using the Human IgG ELISA Quantitation Set (Bethyl Laboratories, Inc, Montgomery, TX). We mixed the phage library with sufficient volume of serum to provide 2 μg of IgG (between 2 and 8 μL) in each of 2 replicates per sample. After DNA sequences were lysed from bound phage, we performed 2 rounds of polymerase chain reaction (PCR), the first to amplify the phage inserts and the second to attach adapter sequences and individual index sequences to each sample to allow pooling. Indexed amplimers from the second PCR were quantified with fluorometry using the Qubit dsDNA HS Assay Kit (Thermo Fisher Scientific, Waltham, MA), pooled proportionally, and gel purified. Next-generation sequencing was performed by Illumina HiSeq 2500. The previously described analysis pipeline was used to deconvolute oligonucleotide data into epitope hits and viral scores, and pipeline output was not altered until subsequent to obtaining epitope hits. All laboratory work was performed blind to sample identity.
Statistical analysis
To call positive responses to viruses (∼ seropositivity), we augmented the originally described methods of thresholding epitope hits. We used the higher of either the empiric threshold described previously15 or else a total of at least 3 hits, one of which was required to be a public epitope for viruses for which “public epitopes” had been previously identified (epitopes common across most persons who recognize that virus; Stephen Elledge and Tomasz Kula, unpublished data; supplemental Table 1, available on the Blood Web site, Receiver operating characteristics at different thresholds). Several novel metrics were developed to describe the viral antibody repertoire. Statistical methods were adapted from ecologic analyses, which evaluate community-level metrics and are widely accepted methods employed in microbiome or other population analyses: (i) Total epitope score: The sum of unique epitopes observed for all 206 viruses in VirScan; (ii) Total non-CMV epitopes: The sum of epitopes observed for all viruses excepting CMV-specific epitopes; (iii) Total virus score: The number of viruses for which the sample was considered seropositive, where binary determination of seropositivity was defined as meeting the highest above-described threshold; (iv) Simpson's D (α-diversity): Selected on the ability to define diversity in a purely mathematical manner not reliant on genetic distance between members, given that phylogenetic distance may not be an appropriate manner to describe recognized epitopes to diverse viral species16,17 ; (v) Shannon's evenness metric (α-diversity).18,19 We last evaluated a divergence measure to compare the repertoire between samples (β-diversity): (vi) Jensen-Shannon divergence measures the similarity between 2 probability distributions.20 We applied it to measure the distance between each donor and recipient pair, longitudinally over time, from baseline through day 365 (d365). We modeled this distance over time using a linear mixed-effects (LMEs) model and performed pairwise comparisons of the distance between the D/R pairs’ antiviral repertoire pre-HCT (pre-D vs pre-R), with that at later time points, and last, compared pre-R vs d365.
We used generalized linear models to test the association between the above metrics with each clinical predictor in Table 1 for both donors and recipients as well as ALC at d100 and ALC and total B-cell count at d365. We calculated the maximum daily dose of systemic corticosteroids received during the 2 weeks prior to each endpoint. Observations within 15 weeks (∼4 half-lives)4 of documented receipt of IV immunoglobulin (IVIG) were censored for this analysis. The presence of GVHD was adjudicated by National Institutes of Health criteria and disease severity by Center for International Blood & Marrow Transplant Research criteria.
HCT cohort demographics and clinical characteristics
| Characteristic | N = 37 pairs (%) or median (IQR) |
|---|---|
| Recipient age, y | 47 (39.5, 54) |
| Recipient sex | |
| Female | 14 (38) |
| Race/ethnicity (donor-recipient) | |
| White | 28 (76) |
| Asian/Pacific Islander | 5 (14) |
| Hispanic (mixed race) | 3 (8) |
| Black | 1 (3) |
| Donor age | 48.5 (36, 55) |
| Donor type | |
| Related | 36 (97) |
| Unrelated | 1 (3) |
| Donor sex | |
| Female | 22 (59) |
| HLA-matched | 36 (97) |
| HLA-mismatched (6/10 match) | 1 (3) |
| Underlying disease | |
| AML | 12 (32) |
| ALL | 2 (5) |
| CML | 12 (32) |
| CLL | 2 (5) |
| Myelodysplastic syndromes | 6 (16) |
| Non-Hodgkin lymphoma | 3 (8) |
| Disease severity | |
| Early disease | 23 (62) |
| Intermediate disease | 7 (19) |
| Advanced disease | 7 (19) |
| Cell source* | |
| Bone marrow | 11 (30) |
| Peripheral blood | 27 (73) |
| Treatment year | |
| 1999-2003 | 33 (89) |
| 2012-2013 | 4 (13) |
| CMV serostatus of pair | |
| D+/R+ | 21 (57) |
| D+/R− | 8 (22) |
| D−/R+ | 5 (14) |
| D−/R− | 3 (8) |
| Previous treatment regimens† | |
| Anti-CD20 | 3 (8) |
| Lymphodepletion | 13 (35) |
| Intensive chemotherapy (any) | 19 (51) |
| Conditioning regimen | |
| Bu/Cy, + ATG (1) or RAB (1) | 26 (70) |
| TBI, + Cy (5) or VP-16 (1) | 8 (22) |
| Bu, Flu | 3 (8) |
| GVHD prophylaxis | |
| CSA, MTX | 31 (84) |
| CSA, Cy | 4 (11) |
| CSA, MMF | 2 (5) |
| Systemic GVHD (by NIH criteria) | |
| Yes | 25 (68) |
ALL, acute lymphoblastic leukemia; AML, acute myeloid leukemia; ATG, antithymocyte globulin; Bu, busulfan; CLL, chronic lymphocytic leukemia; CML, chronic myeloid leukemia; CSA, cyclosporine; Cy, cyclophosphamide; Flu, fludarabine; MMF, mycophenolate mofetil; MTX, methotrexate; NIH, National Institutes of Health; RAB, radiolabeled antibodies; TBI, total body irradiation; VP-16, etoposide.
Totals to 38; 1 person received both types of cells.
Anticancer or lymphodepleting agents given within the 12 mo prior to HCT were considered. The only anti-B-cell therapy given in this cohort was rituximab; no ofatumumab or anti-CD52 was given. Regimens considered to be lymphodepleting included rituximab, fludarabine, high-dose cytarabine, or cycloporin/ifosphamide, or combinations of the preceding.
To document changes in individual antiviral responses over time, we categorized each donor-recipient pair into 4 combinatorial groups (R−/D−, R−/D+, R+/D−, R+/D+) for each of the 58 viruses with public epitopes; the HCT pair could belong to a different group for each individual virus, as D/R status in this case was determined by threshold for each virus individually. We used an LME model to quantify epitope changes for each of the combinatorial groups compared with donor (pre-D) epitopes for each virus, then also compared with the pre-HCT recipient (pre-R).
Last, we identified HCT recipients who did or did not reactivate CMV during the first 100 days post-HCT, to capture the epitope heterogeneity due to CMV reactivation and disease, defined as a positive test for CMV activity in peripheral blood (antigenemia with CMV pp65 ≥2 cells per 2 × 10⁶ leukocytes or viremia with ≥100 copies of CMV per milliliter of blood by PCR), or by detection of CMV from any effected organ. We identified individual CMV epitopes recognized in the pre-R and d100 sample and then tested for homogeneity of epitopes recognition between these time points with McNemar’s test. Between-group differences (donor serostatus, reactivators vs non-reactivators) were tested with Fisher’s exact test. Original data are available by request to the corresponding author.
Results
The median age of HCT recipients and donors was similar at 47 years (interquartile range [IQR] 39.5, 54) and 48 years (IQR 36, 55), respectively (Table 1). The median IgG quantitation was highest in donors (median 2.70 × 10⁶ ng/mL; IQR 2.36, 3.25) and decreased from pre-R through d365 to 1.30 × 10⁶ ng/mL (IQR 0.73, 1.83; supplemental Figure 1).
We created heat maps to depict epitope enrichment for viruses with clinical import in this population. Because of the broad immunologic effects of CMV and because a high proportion of recognized epitopes pertain to CMV, we stratified results by D/R CMV serostatus, as determined by clinical serology. Results aggregated by time point and pair serostatus are shown in Figure 1A. We confirmed predictable gain of CMV epitopes over time in pairs with CMV-seronegative donors and seropositive recipients (D−/R+), gradual replacement of recipient immunity with that from CMV-seropositive donors (D+/R+, D+/R−), and minimal detectable CMV epitopes over time when both members of the pair were CMV-seronegative (D−/R−). For most viruses, the maximum post-HCT responses were at d30 or d100 and were weakest at d365, following the general decline in total IgG levels, despite equilibrating assay input for IgG concentration. The unsupervised individual-level heat map (supplemental Figure 2) demonstrates many individual cases of epitope gains in previously naive recipients with seropositive donors, or conversely, loss of epitopes associated with transplantation from a naive donor, across a number of viruses. We saw no demonstrable differences in breadth of the antiviral repertoire after vs before receiving IVIG, or in comparison between persons receiving and not receiving IVIG between d30 and d100 (supplemental Figure 3). We highlighted 2 case studies that demonstrate the ability of VirScan to capture development of antiviral antibodies in association with clinically verified infections (Figure 1B-C).
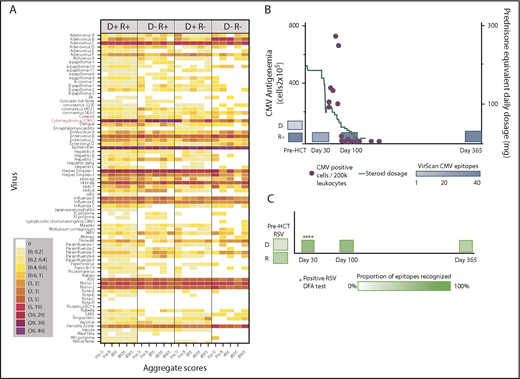
Visual representations of VirScan scores over time in HCT pairs. (A) Aggregated heat map with 5 longitudinal samples, grouped by CMV serostatus of the HCT donor-recipient pair (D+/R+, D−/R+, D+/R−, D−/R−). Colors correspond to mean numbers of epitopes recognized within all samples belonging to that group (range <1 to 40 mean recognized epitopes). White designates no epitope recognition in any sample (mean = 0). Attention to CMV row (red label) shows distinct differences over time by CMV serostatus as determined by Food and Drug Administration–approved serology. A threshold of 6 VirScan epitopes performs optimally against clinical serology (B) CMV epitopes detected by VirScan vs clinical reactivation of CMV in a D−/R+ recipient who also received high daily doses of systemic steroids for GVHD. Each quantitative antigenemia value is depicted by a purple dot and daily steroid dose by the orange line. (C) Acquisition of respiratory syncytial virus (RSV) epitopes during lower respiratory tract infection in a susceptible patient (D−/R+ for RSV); RSV was detected in upper and lower respiratory samples by direct fluorescent antibody (DFA) on 4 individual samples (DFA in clinical use, shown with asterisks). HPV, human papillomavirus; MPV, human metapneumovirus; HHV, human herpesvirus; SARS, severe acute respiratory syndrome; pre-D, pre-HCT donor sample; pre-R, pre-HCT recipient sample.
Visual representations of VirScan scores over time in HCT pairs. (A) Aggregated heat map with 5 longitudinal samples, grouped by CMV serostatus of the HCT donor-recipient pair (D+/R+, D−/R+, D+/R−, D−/R−). Colors correspond to mean numbers of epitopes recognized within all samples belonging to that group (range <1 to 40 mean recognized epitopes). White designates no epitope recognition in any sample (mean = 0). Attention to CMV row (red label) shows distinct differences over time by CMV serostatus as determined by Food and Drug Administration–approved serology. A threshold of 6 VirScan epitopes performs optimally against clinical serology (B) CMV epitopes detected by VirScan vs clinical reactivation of CMV in a D−/R+ recipient who also received high daily doses of systemic steroids for GVHD. Each quantitative antigenemia value is depicted by a purple dot and daily steroid dose by the orange line. (C) Acquisition of respiratory syncytial virus (RSV) epitopes during lower respiratory tract infection in a susceptible patient (D−/R+ for RSV); RSV was detected in upper and lower respiratory samples by direct fluorescent antibody (DFA) on 4 individual samples (DFA in clinical use, shown with asterisks). HPV, human papillomavirus; MPV, human metapneumovirus; HHV, human herpesvirus; SARS, severe acute respiratory syndrome; pre-D, pre-HCT donor sample; pre-R, pre-HCT recipient sample.
The viral antibody repertoire, evaluated with ecologic metrics
We evaluated clinical and demographic features that predicted differences in repertoire metrics from participant characteristics (Table 1), a priori; because of strong univariate relationships between donor/recipient age and CMV serostatus with most metrics, we focused on these predictors. The mean total epitope score was similar for donors and recipients pre-HCT (123-124 epitopes), but was lowest at d365 at 111.9 epitopes (P = .065; Table 2). The mean number of distinct viruses detected above the seropositivity threshold was 9 to 10 per participant and was also lowest at d365. Across all samples, the mean number of non-CMV epitopes was 107.6 (standard deviation [SD] = 38.0). The Simpson’s D score (mean 0.10, SD = 0.04) demonstrated high diversity within each individual (scoring 0-1.0, lower values ∝ higher diversity). Shannon’s evenness scores (mean 0.80, SD 0.05; scoring 0-1.0, directly proportional to value) showed high equality in distribution of epitopes within each individual.
Antiviral repertoire metrics in HCT donors and recipients by time point
| Metric, mean (SD) | Donor | Pre-R | d30 | d100 | d365 | Overall |
|---|---|---|---|---|---|---|
| Total epitopes | 123.2 (49.0) | 124.1 (37.4) | 136.4 (45.6) | 139.0 (45.1) | 111.9 (30.5) | 126.8 (42.8) |
| Non-CMV epitopes | 106.0 (45.3) | 106.2 (32.4) | 116.8 (36.7) | 118.1 (38.5) | 91.0 (31.0) | 107.6 (38.0) |
| Total viruses | 9.4 (3.3) | 9.5 (3.1) | 10.7 (3.6) | 10.5 (2.9) | 8.5 (3.1) | 9.7 (3.3) |
| Simpson’s D | 0.10 (0.03) | 0.11 (0.04) | 0.10 (0.03) | 0.10 (0.04) | 0.12 (0.07) | 0.10 (0.04) |
| Shannon’s evenness | 0.80 (0.05) | 0.80 (0.04) | 0.80 (0.04) | 0.80 (0.04) | 0.79 (0.07) | 0.80 (0.05) |
To better characterize the amalgamation of donor and recipient antiviral responses, we evaluated the β-diversity of paired samples. Comparing the donor and recipient pre-HCT samples, the mean Jansen-Shannon distance was β = 0.411 (SD = 0.01), indicating moderate diversity, or community-level differences, between donor and recipient antiviral repertoires before transplant. During the year after HCT, there were distinct changes in recipient’s antiviral responses when compared with the donor (Figure 2). The recipient repertoire tended to be slightly more similar to that of the donor at d30 (β-distance = 0.390, P = .06 compared with pre-HCT) and significantly more similar at d100 (β = 0.381, P = .01). However, this trend reversed by d365 (β = 0.407), at which point D/R community-level differences were not different from pre-HCT, P = .76. In addition, the mean β-distance between pre-R and d365 was 0.321 (SD = 0.08), which signifies that, 1 year after HCT, the antiviral repertoire is more similar to pre-HCT self than the donor (P < .001).
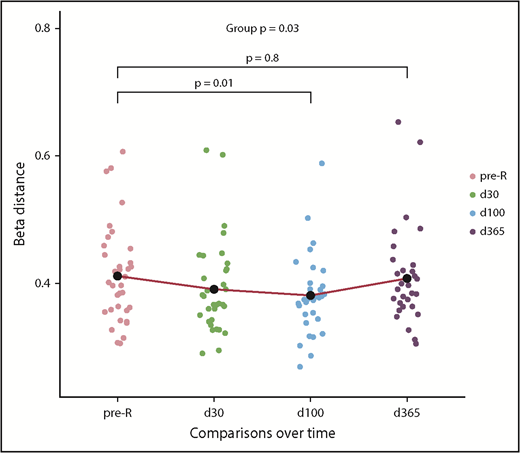
Pairwise diversity comparison between recipient and donor antiviral repertoires from pre-HCT through 1 year following transplant. Higher β-distance represents greater dissimilarity between the repertoire of the donor and recipient at any time point (n = 37). Recipient repertoires become more similar to the donor until d100 (β = 0.381) and then once again diverge by d365 (β = 0.407); pre-HCT recipient and d365 comparisons with donor were not different. The mean β-distance between recipient pre-HCT samples and d365 samples was 0.321, meaning that 1 year after HCT, the antiviral repertoire is significantly more similar to pre-HCT self than that of the donor (P < .001; see text), as modeled with an LME model. pre-tx, pretransplant.
Pairwise diversity comparison between recipient and donor antiviral repertoires from pre-HCT through 1 year following transplant. Higher β-distance represents greater dissimilarity between the repertoire of the donor and recipient at any time point (n = 37). Recipient repertoires become more similar to the donor until d100 (β = 0.381) and then once again diverge by d365 (β = 0.407); pre-HCT recipient and d365 comparisons with donor were not different. The mean β-distance between recipient pre-HCT samples and d365 samples was 0.321, meaning that 1 year after HCT, the antiviral repertoire is significantly more similar to pre-HCT self than that of the donor (P < .001; see text), as modeled with an LME model. pre-tx, pretransplant.
Participant characteristics predict VirScan metrics
Middle-aged donors (age 40-55) tended to have more diversity and evenness of their own repertoires compared with older (>55 years) donors or younger (<40 years) donors (Figure 3A;P = .06; supplemental Figure 4A; P < .08). Donor age was not associated with other metrics for their own repertoire (not shown). Donor age, however, strongly predicted scores at d100 in the same distribution, with recipients of middle-aged donors having the highest scores compared with <40 or >55 year olds for total (P = .03) and non-CMV epitopes (P = .02) as well as total viruses. There was also a trend toward effect of donor age on antibody diversity at d100 and d365 (both P < .10; supplemental Figure 4C-D). Middle-aged recipients also had the highest pre-HCT scores (total epitopes, P = .04; non-CMV epitopes, P = .03), and this U-shaped distribution favoring middle age was still apparent at d365 (total epitope score, P = .03; non-CMV epitope score, P = .10; Figure 3D-F).
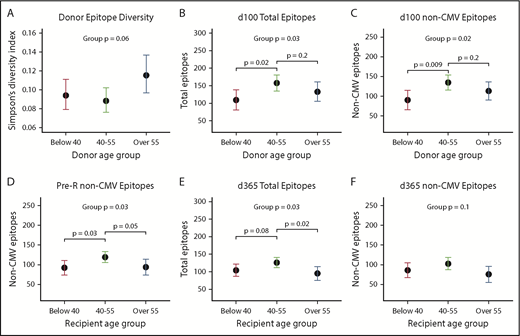
Donor and recipient age predicts antiviral antibody repertoires. Overall, persons in middle age (40-55 years) had higher epitopes scores, total viruses recognized, and higher diversity compared with both younger and older donors and recipients, and donor age more highly predicted d100 scores (n = 11, <40 years; n = 15, 40-55 years; n = 11, >55 years), whereas recipient age was more strongly predictive at d365 (n = 10, <40 years; n = 18, 40-55; n = 19, >55 years). Dots shown are estimates from generalized linear models, and whiskers depict 95% CIs for each estimate. (A) Simpson’s diversity within donor sample vs donor age: a lower score equates to higher levels of diversity of antiviral antibodies. (B) Donor age predicts total recognized epitopes at d100. (C) Donor age predicts all non-CMV epitopes (CMV epitopes removed to adjust for D/R CMV status) also at d100. (D) Recipient age predicts non-CMV epitopes pre-HCT. (E) Recipient age predicts total epitopes at d365. (F) Trend toward recipient age predicting non-CMV epitopes at d365 with significant differences between age 40-55 and >55.
Donor and recipient age predicts antiviral antibody repertoires. Overall, persons in middle age (40-55 years) had higher epitopes scores, total viruses recognized, and higher diversity compared with both younger and older donors and recipients, and donor age more highly predicted d100 scores (n = 11, <40 years; n = 15, 40-55 years; n = 11, >55 years), whereas recipient age was more strongly predictive at d365 (n = 10, <40 years; n = 18, 40-55; n = 19, >55 years). Dots shown are estimates from generalized linear models, and whiskers depict 95% CIs for each estimate. (A) Simpson’s diversity within donor sample vs donor age: a lower score equates to higher levels of diversity of antiviral antibodies. (B) Donor age predicts total recognized epitopes at d100. (C) Donor age predicts all non-CMV epitopes (CMV epitopes removed to adjust for D/R CMV status) also at d100. (D) Recipient age predicts non-CMV epitopes pre-HCT. (E) Recipient age predicts total epitopes at d365. (F) Trend toward recipient age predicting non-CMV epitopes at d365 with significant differences between age 40-55 and >55.
CMV serostatus also was associated with many repertoire metrics. There was a trend toward CMV-negative donors recognizing a higher number of non-CMV epitopes (mean difference +33.0 epitopes; 95% confidence interval [CI], −1.2, +66.3; P = .07). After HCT, an interaction between donor and recipient CMV status appeared, showing that the effects of each had to be considered in combination; this trend was visible but no longer significant at d365 (Figure 4A-D). At d100, the highest epitope counts were seen in D−/R+ pairs, followed by D+/R+, and then R− pairs of either D status (P = .002; Figure 4A). Recipient CMV serostatus did not predict epitope or virus totals pre-HCT, or at d365, either univariately or adjusted for donor serostatus. Neither donor nor recipient CMV serostatus predicted diversity or evenness scores of the antiviral repertoire at any time point.
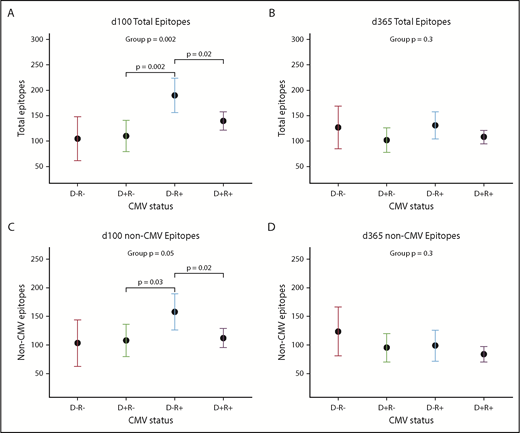
Donor and recipient CMV status is associated with viral epitope recognition at d100 but not d365 after HCT. (A-C) Dot and whisker plot representing the estimate and 95% CI of total epitopes recognized at d100 (D−/R− n = 3; D+/R− n = 8; D−/R+ n = 5; D+/R+ n = 21) (A) and total epitopes excepting CMV epitopes (C), derived from a generalized linear model accounting for both donor and recipient CMV status. D−/R+ recognized most epitopes, followed by both D+ groups, which shows that CMV confers greater influence than simply the addition of its epitopes to the total epitope count; there is an interaction between donor-recipient dynamics. (B,D) Similar plot at d365, although CMV status of donor or recipient no longer influences total viral epitopes recognized, whether or not CMV epitopes were included.
Donor and recipient CMV status is associated with viral epitope recognition at d100 but not d365 after HCT. (A-C) Dot and whisker plot representing the estimate and 95% CI of total epitopes recognized at d100 (D−/R− n = 3; D+/R− n = 8; D−/R+ n = 5; D+/R+ n = 21) (A) and total epitopes excepting CMV epitopes (C), derived from a generalized linear model accounting for both donor and recipient CMV status. D−/R+ recognized most epitopes, followed by both D+ groups, which shows that CMV confers greater influence than simply the addition of its epitopes to the total epitope count; there is an interaction between donor-recipient dynamics. (B,D) Similar plot at d365, although CMV status of donor or recipient no longer influences total viral epitopes recognized, whether or not CMV epitopes were included.
At d100, having recently received higher doses of systemic glucocorticoids was associated with lower total epitope counts and lower non-CMV epitopes compared with persons who received <0.5 mg/kg steroids. This effect was modified by whether there was a diagnosis of GVHD, although there was no univariate association with GVHD alone (Figure 5A-B). At 1 year, however, neither GVHD nor steroids predicted epitope counts. At d365, higher total B-cell counts were associated with a trend toward more evenness and higher diversity of the repertoire (supplemental Figure 4).
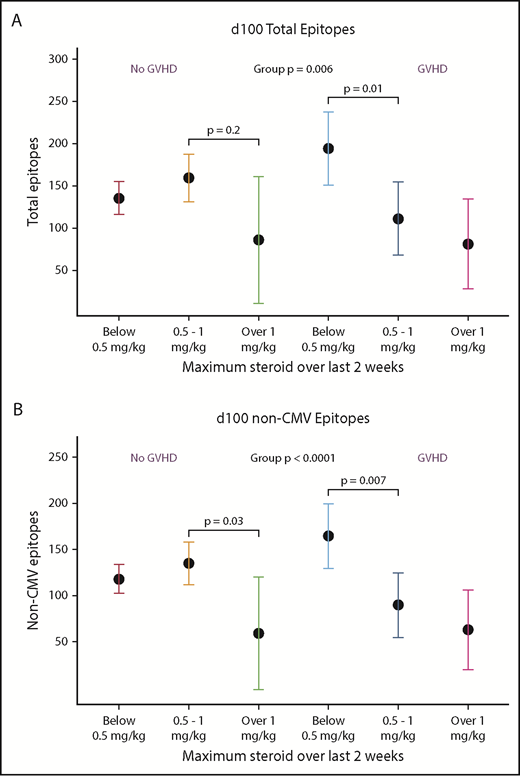
Receipt of high-dose glucocorticoids and GVHD is associated with viral epitope recognition at d100. In univariate analysis, presence of GVHD was not associated with VirScan metrics, but high-dose steroids (>1 mg/kg prednisone equivalents per day given within 2 weeks prior to analysis) was associated with lower total and non-CMV epitopes. Due to interaction of steroid dose and presence of GVHD, we present this analysis stratified by prior diagnosis of GVHD. In the non-GVHD group, <0.5 mg/kg, n = 15; 0.5-1 mg/kg, n = 7; >1 mg/kg, n = 1. In the GVHD group, <0.5 mg/kg, n = 3; 0.5-1 mg/kg, n = 3; >1 mg/kg, n = 1. At d365, there were no statistically significant differences between groups.
Receipt of high-dose glucocorticoids and GVHD is associated with viral epitope recognition at d100. In univariate analysis, presence of GVHD was not associated with VirScan metrics, but high-dose steroids (>1 mg/kg prednisone equivalents per day given within 2 weeks prior to analysis) was associated with lower total and non-CMV epitopes. Due to interaction of steroid dose and presence of GVHD, we present this analysis stratified by prior diagnosis of GVHD. In the non-GVHD group, <0.5 mg/kg, n = 15; 0.5-1 mg/kg, n = 7; >1 mg/kg, n = 1. In the GVHD group, <0.5 mg/kg, n = 3; 0.5-1 mg/kg, n = 3; >1 mg/kg, n = 1. At d365, there were no statistically significant differences between groups.
Sex did not predict total virus score or diversity scores. Having previously received lymphodepleting agents was associated only with an increase in pre-R repertoire diversity (P = .03), but not with other metrics before or after HCT. No other clinical or demographic characteristics predicted any repertoire metric, including source of transplanted cells, underlying disease, status of underlying malignancy before HCT, pre-HCT treatment, conditioning regimen, year of HCT, receipt of post-HCT cyclosporine, type of GVHD prophylaxis, or ALC, in univariate analyses. Total B-cell count was associated with diversity and evenness of the antiviral repertoire at d365 but was not associated with any other metrics (supplemental Figure 4). In addition, none of the above variables, including age, predicted an individual’s change in epitope counts between pretransplant and d365.
Differential change in epitopes by donor-recipient pretransplant serostatus
To better evaluate gain or loss of viral epitopes over time after HCT, we present LME results from groups of pairs with similar exposures to 24 individual viruses of clinical interest (Figure 6), with the overall mean effect size summed across all 58 viruses with public epitopes, including those not pictured. We modeled the mean change in epitopes from the donor to d365 sample (Figure 6A-D). For pairs that were D−/R− for any given virus, there was a small but nonsignificant increase in most viral epitopes from the donor to d365 (overall mean change 0.79 epitopes per virus; P = .20). In the seropositive donor pairs (D+/R− and D+/R+), we observed net loss of epitopes compared with the donor (mean change −3.91 and −2.27 epitopes per virus, respectively; P < .001 for both). Conversely, among D−/R+ pairs, there was an overall gain in epitopes compared with the donor sample, including for viruses that cause both transient and persistent infections (mean change +3.24 epitopes per virus; P < .001). The largest epitope gains were seen for human herpesviruses (HHVs) and adenoviruses, and significant epitope gains were seen toward acute respiratory or gastrointestinal viral pathogens that are common post-HCT.

Changes in viral epitope recognition at 1 year post-HCT. HCT pairs were assigned to a D/R status individually for each virus (each HCT pair could contribute to a different category for each virus) based on the described thresholding algorithm. Linear mixed modeling then evaluated group mean gain or loss of epitopes with respect to the pre-HCT sample of the donor (A-D) or recipient (E-H). Viruses for which there was net loss are shown with the estimate and 95% CI in blue (P < .05), and those with net gain are shown in red (P < .05); if the 95% CI crossed 0, black is used. Overall, D−/R− pairs showed no changes from either D or R baseline (A,E). With respect to D, the D+/R− pairs mainly lost epitope recognition across multiple viruses (B) and the D−/R+ pairs gained epitopes across many viruses after HCT (C). With respect to either D or R baseline, D+/R+ pairs mainly showed loss of epitopes (D,H). HHVs are shown here alphabetically by number, wherein HHV-1/2 = HSV 1/2; HHV-3 = varicella zoster virus; HHV-4 = Epstein-Barr virus; HHV-5 = cytomegalovirus; HHV6A/B, 7 = roseolaviruses.
Changes in viral epitope recognition at 1 year post-HCT. HCT pairs were assigned to a D/R status individually for each virus (each HCT pair could contribute to a different category for each virus) based on the described thresholding algorithm. Linear mixed modeling then evaluated group mean gain or loss of epitopes with respect to the pre-HCT sample of the donor (A-D) or recipient (E-H). Viruses for which there was net loss are shown with the estimate and 95% CI in blue (P < .05), and those with net gain are shown in red (P < .05); if the 95% CI crossed 0, black is used. Overall, D−/R− pairs showed no changes from either D or R baseline (A,E). With respect to D, the D+/R− pairs mainly lost epitope recognition across multiple viruses (B) and the D−/R+ pairs gained epitopes across many viruses after HCT (C). With respect to either D or R baseline, D+/R+ pairs mainly showed loss of epitopes (D,H). HHVs are shown here alphabetically by number, wherein HHV-1/2 = HSV 1/2; HHV-3 = varicella zoster virus; HHV-4 = Epstein-Barr virus; HHV-5 = cytomegalovirus; HHV6A/B, 7 = roseolaviruses.
We next modeled change over the year after HCT from the recipient’s own pre-HCT baseline (Figure 6E-H). For pairs that were D−/R− for any given viruses, there was no net gain or loss of epitopes (+0.03 epitopes per virus; P = .70), and there were nonsignificant gains in epitopes to CMV, HHV6b, RSV, and rhinovirus A. For pairs that were D+/R−, there was an overall small mean increase across all viruses (+0.76 epitopes per virus; P = .002), presumably due to immune reconstitution with cells from a nonnaive donor; although most changes in epitopes were small, a mean of 2.25 epitopes were added for RSV (P = .004). Overall, recipients from D−/R+ pairs predominantly lost evidence of viral recognition by d365 (mean change −1.67 epitopes per virus; P < .001). The exceptions to the general loss of viral epitopes include some persistent viruses that commonly reactivate following HCT, such as HSV1 and CMV. Large and significant losses of epitopes were seen for some enteroviruses, adenoviruses, acute respiratory viruses, and other HHVs D+/R+ pairs also tended to lose epitopes (−1.65 epitopes/virus overall, P = .004) compared with their seropositive baselines, despite having donors who were nonnaive to these pathogens. Significant losses in epitopes were seen to enterovirus B (−1.04 epitopes; P = .018), HSV-1, and HSV-2 (−7.96 and −2.84, P < .001 and .010, respectively), as well as for HHV7 and rhinovirus B.
Heterogeneity in CMV epitope recognition
In HCT pairs with recipients who reactivated CMV in the first 100 days after HCT, many showed heterogeneity in responses to CMV-specific epitopes between the pre-R and d100 sample (Figure 7). Of recipients who reactivated (n = 19), the CMV epitope distribution was nonhomogeneous between pre- and post-reactivation (d100) samples in 8 pairs (43%), including in 3 of 4 D− pairs, who should have had no preexisting contribution of donor-derived CMV immunity. New epitopes not detected pre-HCT were demonstrated in D− reactivators, with the expectation that CMV would either be due to endogenous reactivation or to acquisition from transfused blood product. Epitope recognition between these time points was homogeneous in all 4 D− pairs that did not reactivate. There was a trend toward persons who reactivated CMV showing more heterogeneity in epitope expression between pre- and post-HCT than in those who did not reactivate (43% vs 8% of pairs; P = .10).
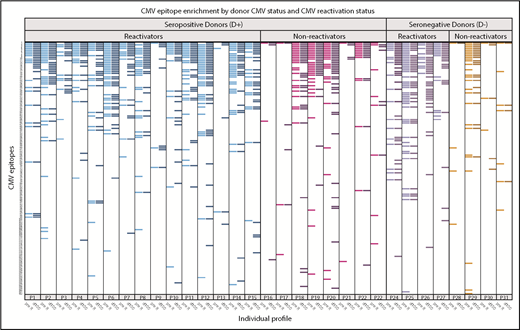
Recognition of individual CMV epitopes among HCT recipients who reactivated or did not reactivate CMV in the first 100 days after hematopoietic cell transplantation. Each row represents a unique CMV peptide, and peptides are ranked in descending order of frequency of recognition among all participants. Each labeled column (eg, P1) contains 2 samples, one from the recipient pre-HCT (pre-R, lighter bars within each color) and the other at 100 days post-HCT (d100, darker bars). Participants with seropositive donors (D+) are on the left, further stratified as to whether they demonstrated CMV reactivation before d100 (≥100 copies of CMV per milliliter by plasma PCR or ≥2 cells positive for CMV pp65/2 × 106 cells), reactivators in blue (n = 15) and nonreactivators in magenta (n = 8). Participants with seronegative donors (D−) are also stratified by CMV reactivation (purple; n = 4) or no reactivation (red; n = 4). Visually, those who reactivated (either D+ or D−) generally expressed more CMV epitopes. There was a trend toward reactivators having more heterogeneity in expressed epitopes before and after reactivation (42.1% vs 8.3%, P = .1). Three participants (P3, P4, and P25) who had confirmed diagnoses of CMV disease, which was gastrointestinal disease in all cases, are annotated with an asterisk. Six of 37 participants who were missing either sample are not displayed.
Recognition of individual CMV epitopes among HCT recipients who reactivated or did not reactivate CMV in the first 100 days after hematopoietic cell transplantation. Each row represents a unique CMV peptide, and peptides are ranked in descending order of frequency of recognition among all participants. Each labeled column (eg, P1) contains 2 samples, one from the recipient pre-HCT (pre-R, lighter bars within each color) and the other at 100 days post-HCT (d100, darker bars). Participants with seropositive donors (D+) are on the left, further stratified as to whether they demonstrated CMV reactivation before d100 (≥100 copies of CMV per milliliter by plasma PCR or ≥2 cells positive for CMV pp65/2 × 106 cells), reactivators in blue (n = 15) and nonreactivators in magenta (n = 8). Participants with seronegative donors (D−) are also stratified by CMV reactivation (purple; n = 4) or no reactivation (red; n = 4). Visually, those who reactivated (either D+ or D−) generally expressed more CMV epitopes. There was a trend toward reactivators having more heterogeneity in expressed epitopes before and after reactivation (42.1% vs 8.3%, P = .1). Three participants (P3, P4, and P25) who had confirmed diagnoses of CMV disease, which was gastrointestinal disease in all cases, are annotated with an asterisk. Six of 37 participants who were missing either sample are not displayed.
Discussion
We applied a novel comprehensive viral serosurvey, VirScan, to interrogate the viral antibody repertoire of donor/recipient pairs in the context of myeloablative HCT. VirScan detected general decrements in antiviral responses following transplantation, which followed decreases in total IgG quantitation over time, even though assay input was individually equilibrated for immunoglobulin concentration, and VirScan measures binary responses to individual epitopes rather than virus-level quantitative titers. We found distinction between donor and recipient antibody repertoires before HCT and demonstrated that recipient antiviral immunity initially resembled the donor profile following HCT, but then became more distinct again after 1 year. The lowest β-diversity between donors and recipients was seen at d100, which is consistent with our finding that donor characteristics were most associated with the antiviral repertoire at this time point and that engraftment of donor adaptive immunity should be beginning between 30 and 100 days.21 At 1 year after HCT, recipient factors were again more highly associated than donor factors with repertoire metrics, and β-diversity measures were closer between pre- and post-HCT recipient samples than compared with the donor. Although these results are exploratory and should be considered hypothesis generating, the summary of these analyses may indicate that donor characteristics dictate the rapidity of engraftment of transplanted humoral immunity, but longer-term maintenance of humoral immunity may involve a more complex interplay between graft and host factors, including ongoing exposure to reactivating DNA viruses endogenous to the recipient.
In donors, there tended to be lower number and diversity of antiviral antibodies in persons above the age of 55 years and younger than 40. In recipients, pretransplant assessments showed similar reductions in older patients with the peak number of epitopes recognized in those aged 40 to 55. These are intriguing results that provide rationale to further investigate the impact of age on viral immune reconstitution and to reconcile these results with the well-established beneficial effect of younger donors on overall outcomes in a larger cohort. Consistent with reported effects on T-cell function, we found an effect of high-dose steroids on the number of detectable epitopes at d100. We found no direct association with diagnosis of GVHD itself, but only when steroid dosage and GVHD were evaluated jointly, likely due to our small sample size. The diagnosis of GVHD has previously been associated with lower B-cell counts and circulating IgG subclasses, although it is not clear to what extent it is disease or treatment that mediates this effect.22-24 Further study is needed to evaluate the impact of specific immunosuppressive regimens and GVHD itself on antiviral immunity.
We modeled individual gain and loss of epitopes by virus, compared with pre-HCT donor and recipient baseline. We demonstrated that persons who were D−/R+ for persistent/latent infections tended to gain more epitopes to those viruses over time. This likely reflects a naive immune system, which is less able to prevent reactivation of endogenous viruses, and then subsequently responds with an immune response during the period when both reactivation of latent DNA viruses and acquisition of respiratory and gastrointestinal viruses are common. In pairs in which neither donor or recipient had been previously exposed to that virus, there was little gain or loss of epitopes over time. This supports the hypothesis that naive donors, or donor immunity not challenged by viral reactivation or acquisition, provide less virus-specific antibodies following engraftment. However, in pairs with a seropositive donor for a given virus, overall there was loss in epitope recognition during the year after transplantation, regardless of the serostatus of the recipient. This finding not only echoes the clinical experience that HCT recipients remain vulnerable to viral infections throughout the year after transplant and beyond but also highlights the fact that both donor and recipient exposures contribute to the antiviral repertoire after transplantation. Thus, after HCT, the sum of the viral antibody repertoire is a more complex amalgam than would be expected by interrogating either the donor or the recipient VirScan profiles alone.
CMV profoundly shapes the immune system in both immunocompetent and immunocompromised individuals.25-27 When we analyzed epitope diversity at d100 and d365 according to D/R serostatus, we found increased breadth of viral epitopes at d100 in D−/R+ pairs, likely due to the brisk reactivation of CMV in this setting associated with absence of donor immunity.28 The number of epitopes was significantly higher even after subtracting CMV epitopes, which echoes findings of several recently published studies in which torque-teno virus (a ubiquitous virus thought to be nonpathogenic, but serves as a marker of overall immunosuppression) and herpesvirus reactivation predicted reactivation of other viruses.29,30 It may be that persons who reactivated CMV were also more likely to subclinically reactivate other viruses due to overall immunosuppression, leading to the observed expansion of non-CMV viral epitopes. Heterogeneity in CMV epitope recognition could potentially help explain why CMV-positive donors may not be able to adequately control reactivation of a recipient’s specific CMV strain. Recent work in a murine model shows that strain-matched CMV antibodies are required to protect from reactivation.11 Our work together with preclinical data supports the idea that the donor CMV repertoire may be less skilled at recognizing the recipient’s endogenous virus in persons who reactivate CMV. We are also intrigued that across the cohort, in addition to the public epitopes, wide variability in CMV epitopes was detected, which could lead to continued work comparing viral strains with epitope responses.
Some limitations should be noted: the relatively small sample size and selection for survival at 1 year limited our ability to evaluate clinical correlations, such as the interaction of GVHD diagnosis with steroids, or to ascertain whether VirScan metrics predicted overall survival. Sample size also limited our ability to perform multivariate analyses, and conclusions about many of the trends observed, such as associations with age or by steroid dosage, may have been limited by small group size, especially within some strata. In addition, receiver operating characteristics of this synthetic virome to determine serostatus for any single virus is unknown, other than those for which public epitopes and accurate approved serologic methods are available. Therefore, we focused on ecologic measures of the antiviral repertoire and minimize dependence on seropositivity thresholds, except for the well-characterized viruses we highlighted.
Strengths of this study include rigorous and novel analytic techniques that pull from well-established metrics used in microbiome research, but which have to our knowledge not yet been applied to an antibody repertoire. These novel techniques applied to longitudinal pre- and post-HCT samples allowed us to interrogate virome-wide antibody responses in a way that is robust to many limitations of serologic assays.31-33
Viral serologic profiling with use of a synthetic virome could become a tool to assist in management of patients before and after HCT. Although it is already well known that donor age and CMV status predict several post-HCT clinical outcomes, it may be that these factors mediate breadth and diversity of the repertoire, as associations with age and CMV were recapitulated in this work.34,35 Important unanswered questions are whether donors or recipients with larger or more diverse repertoires have fewer infections and noninfectious adverse events after HCT, such as GVHD or improved survival. This question can only be answered with a much larger cohort not intentionally selected for survival through 1 year. In addition, studies with a larger and more diverse transplant population (ie, cord blood and autologous recipients) could help define whether use of serial viral antibody profiling in the months after transplant could predict clinical infections and overall outcomes, possibly replacing total immunoglobulin as a way to monitor immune reconstitution. For example, as well described in D−/R+ CMV pairs,35 and seen in the few case studies we evaluated for other specific viruses, persons who are immunologically naive are more likely to develop viral reactivation. Persons with naive donors to respiratory viruses, for example, may be more likely to acquire these infections after HCT.
In conclusion, we demonstrate that VirScan can document changes in humoral antiviral immunity over time and highlight the combined contributions of donor and recipient immunity following HCT. VirScan is a powerful tool to efficiently study immune reconstitution and pathogenesis in this setting. Larger studies are needed to validate our exploratory work, and further studies are needed to determine interactions of the viral antibody repertoire with the microbiome, kinetics of latent DNA viruses, and whether repertoire diversity or breadth are associated with clinical outcomes. Future applications of this technology could include use as a more nuanced biomarker for immune reconstitution or as an additional donor selection criterion in the setting where more than 1 donor is available.
All data associated with this study are available in the manuscript or available on request to corresponding author.
The online version of this article contains a data supplement.
The publication costs of this article were defrayed in part by page charge payment. Therefore, and solely to indicate this fact, this article is hereby marked “advertisement” in accordance with 18 USC section 1734.
Acknowledgments
The authors thank Trupti Gilada for efforts in establishing this project, Sam Minot for expertise in microbiome analysis, Nishaant Limaye for assistance with preliminary work, and the Fred Hutchinson Cancer Research Center (FHCRC) Genomics Core for sequencing the samples and providing technical expertise.
This work was supported by FHCRC Vaccine and Infectious Diseases Division Faculty Initiative Award (R.A.B.I., S.D., A.D., and M.B.), National Institutes of Health, National Institute of Allergy and Infectious Diseases grants K23AI129659 (R.A.B.I.), K23AI119133 (J.A.H.), U24AI8633 (S.J.E. and T.K.), National Cancer Institute grant P01CA018029 (S.J.L.), and National Heart, Lung, and Blood Institute grant K24HL093294 (M.B.).
Authorship
Contribution: R.A.B.I. designed this study, assisted in analysis, interpreted results, and wrote the manuscript; S.D. performed the statistical analysis and wrote the manuscript; T.S.-A. performed the wet-laboratory work and technical oversight and reviewed the manuscript; T.K. provided technical oversight, assisted in interpretation of results, and reviewed the manuscript; J.A.H. provided clinical input, interpretation of results, and reviewed the manuscript; S.J.L. adjudicated clinical data, interpreted results, and reviewed the manuscript; M.M. provided clinical interpretation and reviewed the manuscript; A.D. provided technical input and results interpretation and reviewed the manuscript; S.J.E. provided technical oversight, provided materials and methods, and reviewed the manuscript; and M.B. designed this study, interpreted results, and wrote the manuscript.
Conflict-of-interest disclosure: T.K. and S.J.E. are inventors on a patent application that covers the use of phage display libraries to detect antiviral antibodies. M.B. receives research funding from Lophius. The remaining authors declare no competing financial interests.
Correspondence: Rachel A. Bender Ignacio, Mailstop E2-112, Fred Hutchinson Cancer Research Center, 1100 Fairview Ave N, Seattle, WA 98109; e-mail: rbi13@uw.edu.

This feature is available to Subscribers Only
Sign In or Create an Account Close Modal