

Key Points
EBI macrophages are characterized by the expression of Epor in mouse and man.
Transcriptomes data provide resource for future studies of EBI macrophage function in normal and disordered erythropoiesis.

Abstract
The erythroblastic island (EBI), composed of a central macrophage and surrounding erythroid cells, was the first hematopoietic niche discovered. The identity of EBI macrophages has thus far remained elusive. Given that Epo is essential for erythropoiesis and that Epor is expressed in numerous nonerythroid cells, we hypothesized that EBI macrophages express Epor so that Epo can act on both erythroid cells and EBI macrophages simultaneously to ensure efficient erythropoiesis. To test this notion, we used Epor-eGFPcre knockin mouse model. We show that in bone marrow (BM) and fetal liver, a subset of macrophages express Epor-eGFP. Imaging flow cytometry analyses revealed that >90% of native EBIs comprised F4/80+Epor-eGFP+ macrophages. Human fetal liver EBIs also comprised EPOR+ macrophages. Gene expression profiles of BM F4/80+Epor-eGFP+ macrophages suggest a specialized function in supporting erythropoiesis. Molecules known to be important for EBI macrophage function such as Vcam1, CD169, Mertk, and Dnase2α were highly expressed in F4/80+Epor-eGFP+ macrophages compared with F4/80+Epor-eGFP− macrophages. Key molecules involved in iron recycling were also highly expressed in BM F4/80+Epor-eGFP+ macrophages, suggesting that EBI macrophages may provide an iron source for erythropoiesis within this niche. Thus, we have characterized EBI macrophages in mouse and man. Our findings provide important resources for future studies of EBI macrophage function during normal as well as disordered erythropoiesis in hematologic diseases such as thalassemia, polycythemia vera, and myelodysplastic syndromes.
Introduction
Erythropoiesis occurs at the erythroblastic island (EBI), which is composed of a central macrophage surrounded by developing erythroid cells.1 The functional role of the EBIs was first demonstrated by Mohandas and colleagues, who showed numbers of EBI were significantly decreased in hypertransfused rat bone marrow (BM).2 The functional role of macrophages in supporting erythropoiesis was further strengthened by in vitro observations that macrophages promote erythroblast proliferation/survival3,4 and by findings that abnormal macrophage differentiation of EMP-null5 and KLF1-null mice6 led to significantly impaired erythropoiesis and anemia. Two elegant studies demonstrated that macrophages play important roles in erythropoiesis in vivo, particularly under erythropoietic stress conditions.7,8 Despite these studies, the identity of EBI macrophages has remained elusive and the mechanisms by which they support erythropoiesis are still poorly understood.
Based on findings that the adhesion molecules EMP,9 Vcam1,10 αv integrin,11,12 CD163,13 and CD169 present on macrophages are involved in macrophage-erythroblast interactions, these molecules are considered potential EBI macrophage surface markers. F4/80 is historically used as a mouse macrophage surface marker.14,15 However, none of these surface markers alone is specific enough to define EBI macrophage populations. Given that Vcam1 plays a critical role in macrophage-erythroblast interaction10 and that depletion of CD169+ macrophages in mice led to impaired erythropoiesis in vivo,8 F4/80, Vcam1, and CD169 are considered as the best combination of markers to identify mouse EBI macrophages. To examine whether all F4/80+Vcam1+CD169+ macrophages are EBI macrophages, we examined the ratio of F4/80+Vcam1+CD169+ macrophages and erythroblasts. We found that the ratio of F4/80+Vcam1+CD169+ vs erythroblasts is ∼1:2.6 in mouse BM. The number of erythroblasts per island ranges from 10 cells observed in tissue sections from rat femur16 to 5 to >30 erythroblasts in islands harvested from human BM,17 our findings strongly suggest that it is unlikely all F4/80+Vcam1+CD169+ macrophages are EBI macrophages.
Because Epo is critical for erythropoiesis18,19 and Epor is expressed in nonerythroid cells,20-26 we hypothesized that EBI macrophages express Epor and Epo acts on erythroid cells and EBI macrophages simultaneously in the niche to ensure efficient red blood cell production. We tested this hypothesis using Epor-eGFPcre knockin mice and demonstrated the native EBIs in mouse BM and fetal liver (FL) were predominantly formed by F4/80+Epor-eGFP+ macrophages. Using an antibody specific for human EPOR, we further showed that human FL EBIs were also formed by EPOR+ macrophages. Bioinformatics analyses of RNA sequencing (RNA-seq) on the sorted F4/80+Epor-eGFP+ and F4/80+Epor-eGFP− macrophage populations further support the specialized function of the F4/80+Epor-eGFP+ macrophages in supporting erythropoiesis, as evidenced by the abundant expression of Vcam1 and CD169 known to be involved in macrophage-erythroblast interaction,7,10 Mertk required for pyrenocyte engulfment,27 DNase2α (DNAse2) critical for DNA degradation of the engulfed nuclei,28 and key molecules involved in iron recycling. The existence of iron-recycling machinery in BM EBI macrophages raises the possibility that the EBI macrophages could provide the iron source for erythropoiesis within the erythropoietic niche. Our studies provide the foundation for future studies of EBI macrophage function in normal and disordered erythropoiesis in hematologic diseases such as thalassemia, polycythemia vera, and myelodysplastic syndromes.
Materials and methods
Mice, antibodies, and primers
Both wild-type mice and Epor-eGFPcre knockin mice are on the C57BL/6 background and maintained at the New York Blood Center Animal Facility. Adult mice 2 to 3 months of age and fetal mice E14.5 of age were used for the studies. Mice were injected with Epo, as previously described.29 All animal protocols are approved by the Institutional Animal Care and Use Committee. Antibodies are listed in supplemental Table 1, available on the Blood Web site. Primers are listed in supplemental Table 2.
Preparation of single-cell suspension from mice BM, FL, and human FL
Mouse BM and FL single-cell suspension were prepared as previously described.30,31 Human FL at 19 to 24 weeks of gestation were purchased from Advanced Bioscience Resources (Alameda, CA). Human FL single-cell suspension was prepared as described previously.32 The details are described in the supplemental Materials and Methods.
Preparation of native EBIs from mice BM, FL, and human FL
Native mouse BM or FL EBIs were prepared according to the methods described by Seu et al.33 For human FL, ∼200 mg of human FL tissue was minced, gently pipetted up and down with a 1-mL pipette, and then filtered through a 70-µm cell strainer. The cell suspension was collected and processed as was previously done for murine EBI.33
Flow cytometry, fluorescence-activated cell sorting, and Amnis imaging flow cytometry
Mouse erythroblast staining was performed as previously described.34 The details for mouse macrophage staining, analyses, cell sorting and imaging flow cytometry are described in the supplemental Materials and Methods.
Transcriptome analysis
RNA was extracted from fluorescence-activated cell sorted F4/80+Epor-eGFP+ and F4/80+Epor-eGFP− macrophages. Library preparation, RNA-seq, and bioinformatics analyses were performed as described in our previous publications.35-37 Details are provided in the supplemental Materials and Methods.
In vitro human EBI formation and EPO treatment
Erythroblasts were derived from cord blood CD34+, as described previously.38 Macrophages were also derived from cord blood CD34+ cells. The conditions for coculture and EPO treatment were described in detail in the supplemental Materials and Methods.
Statistics
GraphPad Prism 7 software (GraphPad Software) was used for statistical analysis. All data were reported as mean ± standard error of the mean. Comparisons between 2 groups were performing using Student t test. Significance was set at P < .05.
Results
Not all F4/80+Vcam1+CD169+ macrophages in mouse BM are EBI macrophages
EBIs are composed of a central macrophage surrounded by multiple developing erythroid cells1,16,17 with macrophages in mouse marked by surface expression of combinations of F4/80, Vcam1, and CD169. To examine whether all F4/80+Vcam1+CD169+ mouse macrophages are EBI macrophages, we quantified the ratio of erythroblasts vs F4/80+Vcam1+CD169+ macrophages in mouse BM. We stained BM cells with Ter119 and CD44 as previously described.34 To calculate the numbers of F4/80+Vcam1+CD169+ macrophages, we stained BM cells with macrophage markers F4/80, Vcam1, CD169, along with Ly6G to gate out granulocytes and Ter119 to gate out erythroid cells. The gating strategy for F4/80+Vcam1+CD169+ macrophages is shown in supplemental Figure 1A. Calculation of the cell numbers revealed that there were ∼4 million F4/80+Vcam1+CD169+ macrophages and ∼10.5 million erythroblasts in BM cells from 2 femurs and 2 tibias (supplemental Figure 1B), giving a ratio of F4/80+Vcam1+CD169+ vs erythroblasts of about 1:2.6, strongly suggesting that it is unlikely all the F4/80+Vcam1+CD169+ macrophages are EBI macrophages.
A subpopulation of F4/80+ macrophages in mouse BM or FL expressed Epor-eGFP
To test the hypothesis that EBI macrophages express Epor and Epo acts on both erythroid cells and EBI macrophages simultaneously in the niche to ensure efficient red cell production, we used an Epor-eGFPcre knockin mouse model39 in which eGFP is fused with Cre recombinase (eGFPcre) knocked-in to 1 allele of Epor locus under the Epor promoter. Thus, the expression of eGFP reflects the expression of Epor. Figure 1A shows that, in the Epor-eGFPcre knockin mouse BM, ∼5% of F4/80+ macrophages express Epor-eGFP. As a negative control, no GFP+ macrophages were noted in wild-type F4/80+ macrophages. We then sorted the F4/80+Epor-eGFP+ and F4/80+Epor-eGFP− populations. Flow cytometry analyses of the sorted populations confirmed that eGFP was expressed in F4/80+Epor-eGFP+ but not in F4/80+Epor-eGFP− macrophages (Figure 1Ba). Figure 1Bb shows that, although both populations were F4/80+, expression levels of F4/80 on the Epor-eGFP+ macrophages were ∼2 times higher (mean fluorescence intensity: 6554 ± 540 for Epor-eGFP+ macrophages vs 2954 ± 82 for Epor-eGFP− macrophages). Importantly, no Ter119 expression was detected in F4/80+Epor-eGFP+ macrophages (Figure 1Bc), demonstrating that Epor-eGFP expression seen in F4/80+Epor-eGFP+ macrophages was not from contamination by erythroid cells. Furthermore, the 2 macrophage populations were morphologically different (Figure 1C), further demonstrating that they are indeed distinct macrophage populations. Interestingly, there were ∼0.7 million F4/80+Epor-eGFP+ macrophages in BM from 2 femurs and 2 tibias, giving the ratio of F4/80+Epor-eGFP+ macrophages vs erythroblasts of ∼1:15.

Identification of Epor+ macrophages in mouse BM and FL using the Epor-eGFPcre knockin mouse model. (A) Flow cytometry analysis of mouse BM F4/80+Epor-eGFP+ macrophages. Gating procedures are described in supplemental Figure 1A. WT mouse BM cells were used as control. N = 6. (B) Histogram of Epor-eGFP (a), F4/80 (b), and Ly6G/Ter119 (c) of the sorted BM F4/80+Epor-eGFP+ and F4/80+Epor-eGFP− macrophages. Dotted line: Fluorescence Minus One control. (C) The composite cytospin images of the sorted BM F4/80+Epor-eGFP+ and F4/80+Epor-eGFP− macrophages. (D) Flowcytometry analysis of mouse FL F4/80+Epor-eGFP+ macrophages. WT mouse FL cells were used as control. N = 4. (E) Histogram of Epor-eGFP (a), F4/80 (b), and Ly6G/Ter119 (c) of the sorted FL F4/80+Epor-eGFP+ and F4/80+Epor-eGFP− macrophages. (F) The composite cytospin images of the sorted FL F4/80+Epor-eGFP+ and F4/80+Epor-eGFP− macrophages. FSC, forward scatter area; SSC, side scatter; WT, wild-type.
Identification of Epor+ macrophages in mouse BM and FL using the Epor-eGFPcre knockin mouse model. (A) Flow cytometry analysis of mouse BM F4/80+Epor-eGFP+ macrophages. Gating procedures are described in supplemental Figure 1A. WT mouse BM cells were used as control. N = 6. (B) Histogram of Epor-eGFP (a), F4/80 (b), and Ly6G/Ter119 (c) of the sorted BM F4/80+Epor-eGFP+ and F4/80+Epor-eGFP− macrophages. Dotted line: Fluorescence Minus One control. (C) The composite cytospin images of the sorted BM F4/80+Epor-eGFP+ and F4/80+Epor-eGFP− macrophages. (D) Flowcytometry analysis of mouse FL F4/80+Epor-eGFP+ macrophages. WT mouse FL cells were used as control. N = 4. (E) Histogram of Epor-eGFP (a), F4/80 (b), and Ly6G/Ter119 (c) of the sorted FL F4/80+Epor-eGFP+ and F4/80+Epor-eGFP− macrophages. (F) The composite cytospin images of the sorted FL F4/80+Epor-eGFP+ and F4/80+Epor-eGFP− macrophages. FSC, forward scatter area; SSC, side scatter; WT, wild-type.
Similar experiments were performed using E14.5 FL cells. Consistent with a much more erythropoietic activity in the FL, ∼31% of FL F4/80+ macrophages expressed Epor-eGFP (Figure 1D). Flow cytometry analyses of the sorted FL macrophages confirmed that the FL F4/80+Epor-eGFP+ and F4/80+Epor-eGFP− macrophages are indeed GFP positive and negative, respectively (Figure 1Ea). Interestingly, the FL F4/80+Epor-eGFP+ macrophages contained F4/80low and F4/80hi populations, whereas F4/80+Epor-eGFP− macrophages only contained F4/80low population (Figure 1Eb). Importantly, none of the populations expresses erythroid specific marker Ter119 (Figure 1Ec), excluding the possibility that the Epor-eGFP expression in F4/80+Epor-eGFP+ macrophages was due to erythroid contamination. Moreover, the sorted Epor-eGFP+ macrophages were morphologically different from the Epor-eGFP− macrophages and appear to be very active (Figure 1F). Together, these findings clearly demonstrate that a subpopulation of mouse macrophages in BM and FL expresses Epor.
Native mouse BM and FL EBIs were formed by the Epor-eGFP+ macrophages
EBI macrophages are defined by their ability to form EBIs with erythroid cells. To demonstrate Epor-eGFP+ macrophages are indeed EBI macrophages, we analyzed native BM EBIs from Epor-eGFPcre mice using imaging flow cytometry (IFC) as previously described33 using the gating strategy shown in Figure 2A. Cell clusters were gated as potential EBIs (Figure 2Aa). Plot of F4/80 vs Ter119 revealed 2 distinct populations, F4/80+Ter119+ and F4/80+Ter119− (Figure 2Ab). Figure 2B shows 2 representative images from the Ter119+F4/80+ population. The upper panel shows an island structure in which the macrophage in the center was both F4/80+ and Epor-eGFP+ and the F4/80+Epor-eGFP+ macrophage was surrounded by several Ter119+ erythroid cells. In contrast, the lower panel reveals that, although the macrophage was F4/80+, it is Epor-eGFP− and the Epor-eGFP− macrophage was surrounded by only 1 erythroid cell. EBI was defined as a macrophage surrounded by 3 or more erythroid cells.33 Quantitative analyses from 2000 images revealed that >90% EBIs were formed by the F4/80+Epor-eGFP+ macrophages (Figure 2C). Further analyses showed that the percentages of EBIs with 3, 4, and 5 or more erythroid cells were ∼20%, ∼26%, and ∼54%, respectively (Figure 2D). When we analyzed mouse FL native EBIs, we obtained similar results (supplemental Figure 2). Together, these findings indicate that F4/80+Epor-eGFP+ macrophages in BM and FL are EBI macrophages.

Imaging flow cytometry analysis of mouse BM EBIs. (A) Cell clusters with more than 250 (Area_BF) were gated (a) as potential EBIs; (b) plot of F4/80 and Ter119 of the gated cell clusters. (B) Top: a representative EBI structure showing F4/80+Epor-eGFP+ macrophage was surrounded by multiple Ter119+ erythroid cells; bottom: a representative image showing the F4/80+Epor-eGFP− macrophage was surrounded by 1 Ter119+ erythroid cell. (C) Quantitative analyses revealing >90% EBIs were formed by the F4/80+Epor-eGFP+ macrophages. (D) Quantitative analyses showing percentages of EBIs with 3, 4, and 5 or more erythroid cells. (C-D) Quantitative analyses were performed using 2000 EBIs from 8 independent experiments.
Imaging flow cytometry analysis of mouse BM EBIs. (A) Cell clusters with more than 250 (Area_BF) were gated (a) as potential EBIs; (b) plot of F4/80 and Ter119 of the gated cell clusters. (B) Top: a representative EBI structure showing F4/80+Epor-eGFP+ macrophage was surrounded by multiple Ter119+ erythroid cells; bottom: a representative image showing the F4/80+Epor-eGFP− macrophage was surrounded by 1 Ter119+ erythroid cell. (C) Quantitative analyses revealing >90% EBIs were formed by the F4/80+Epor-eGFP+ macrophages. (D) Quantitative analyses showing percentages of EBIs with 3, 4, and 5 or more erythroid cells. (C-D) Quantitative analyses were performed using 2000 EBIs from 8 independent experiments.
Monocyte/macrophage surface markers were differentially expressed on F4/80+Epor-eGFP+ and F4/80+Epor-eGFP− macrophages
Previous studies have implicated several monocyte/macrophage surface markers are expressed on EBI macrophages including Vcam1, CD163, and CD169. Additional monocyte/macrophage markers include Ly6C,40 CD11b,41 and ER-HR3.42 Having shown that F4/80+Epor-eGFP+ macrophages are EBI macrophages, we compared the expression of these markers on F4/80+Epor-eGFP+ and F4/80+Epor-eGFP− macrophages by flow cytometry. Figure 3 (top) shows that all F4/80+Epor-eGFP+ macrophages are CD45+, almost all of them express Vcam1, CD169, and ER-HR3; a proportion of them express CD163 (∼35%) or Ly6C (∼69%); and some of them express moderate levels of CD11b. Figure 3 (bottom) shows that, similar to F4/80+Epor-eGFP+ macrophages, F4/80+Epor-eGFP− macrophages are also CD45+. In contrast, although almost all F4/80+Epor-eGFP− macrophages also expressed Vcam1 and CD169, but expression levels of Vcam1 and CD169 on the F4/80+Epor-eGFP− macrophages were low. Moreover, the F4/80+Epor-eGFP− macrophages did not express CD163, and a proportion of them expressed Ly6C (∼57%), ER-HR3 (∼52%), and CD11b (∼68%). These results indicate that mouse BM F4/80+Epor-eGFP+ macrophages are immunophenotypically distinct from F4/80+Epor-eGFP− macrophages.

Expression of monocyte/macrophage surface markers on mouse BM F4/80+Epor-eGFP+ and F4/80+Epor-eGFP−macrophages. Representative flow cytometry analyses revealing differential expression of indicated surface markers on the BM F4/80+Epor-eGFP+ macrophages (top) or F4/80+Epor-eGFP− macrophages (bottom). Dotted line: fluorescence-minus-one. N = 6.
Expression of monocyte/macrophage surface markers on mouse BM F4/80+Epor-eGFP+ and F4/80+Epor-eGFP−macrophages. Representative flow cytometry analyses revealing differential expression of indicated surface markers on the BM F4/80+Epor-eGFP+ macrophages (top) or F4/80+Epor-eGFP− macrophages (bottom). Dotted line: fluorescence-minus-one. N = 6.
Expression of various surface markers on EBI macrophages
We next used IFC to examine the expression of above surface markers on EBIs. Supplemental Figure 3 showed that Vcam1, CD169, and ER-HR3 were expressed on >90% of F4/80+Epor+ EBI macrophages, whereas CD163, Ly6C, and CD11b are expressed on ∼35%, ∼52%, and ∼32% of the F4/80+/Epor-eGFP+ EBI macrophages, respectively, suggesting a heterogenous collection of the F4/80+/Epor-eGFP+ EBI macrophages. Additionally, Ly6G, previously implicated as an EBI macrophage marker,42 was not expressed on the F4/80+Epor-eGFP+ EBI macrophages.
RNA-seq analyses suggest specialized function of BM F4/80+Epor-eGFP+ macrophages in supporting erythropoiesis
To develop a comprehensive characterization of the EBI macrophages at the molecular level and to gain insights into the mechanisms by which they support erythropoiesis, we performed RNA-seq analyses on the sorted F4/80+Epor-eGFP+ and F4/80+Epor-eGFP− macrophage populations. Principal component analysis showed clustering of 3 biological replicates of each population (Figure 4A), demonstrating that the 2 macrophage populations are functionally distinct. We then performed pairwise comparison of differentially expressed genes. Differentially expressed genes were defined as those with a log2 fold change >1 and fragments per kilobase million (FPKM) >10 on at least 1 side of the comparison. A total of 786 genes were differentially expressed, of which 346 genes were upregulated, whereas 440 were downregulated in F4/80+Epor-eGFP+ compared with F4/80+Epor-eGFP− macrophages. The heatmap of the differentially expressed genes is shown in Figure 4B. Differentially expressed genes are listed in supplemental Table 3. Gene ontology analysis of the differentially expressed genes revealed that the top upregulated pathways in F4/80+Epor-eGFP+ macrophages included erythrocyte development, apoptotic cell clearance, and cellular iron ion homeostasis (Figure 4C). In contrast, the top upregulated pathways in F4/80+Epor-eGFP− macrophages were mostly related to immune and inflammatory response (Figure 4D).
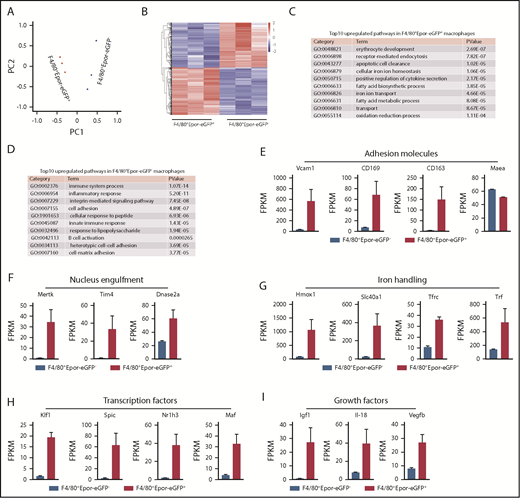
RNA-seq analyses of BM F4/80+Epor-eGFP+ and F4/80+Epor-eGFP- macrophages. (A) Principal component analysis. (B) Heatmap of the differentially expressed genes. (C) The top 10 upregulated pathways in F4/80+Epor-eGFP+ macrophages and P value are shown. (D) The top 10 upregulated pathways in F4/80+Epor-eGFP− macrophages and P value are shown. (E) The FPKM value of adhesion molecules involved in macrophage-erythroblast interaction. (F) The FPKM value of phagocytosis associated genes as indicated. (G) The FPKM value of iron-recycling genes as indicated. (H) The FPKM value of transcription factors as indicated. (I) The FPKM value of growth factors as indicated. N = 3.
RNA-seq analyses of BM F4/80+Epor-eGFP+ and F4/80+Epor-eGFP- macrophages. (A) Principal component analysis. (B) Heatmap of the differentially expressed genes. (C) The top 10 upregulated pathways in F4/80+Epor-eGFP+ macrophages and P value are shown. (D) The top 10 upregulated pathways in F4/80+Epor-eGFP− macrophages and P value are shown. (E) The FPKM value of adhesion molecules involved in macrophage-erythroblast interaction. (F) The FPKM value of phagocytosis associated genes as indicated. (G) The FPKM value of iron-recycling genes as indicated. (H) The FPKM value of transcription factors as indicated. (I) The FPKM value of growth factors as indicated. N = 3.
Specifically, the expression levels of genes encoding proteins known to be important for EBI macrophage function in supporting erythropoiesis were significantly higher in F4/80+Epor-eGFP+ macrophages than in F4/80+Epor-eGFP− macrophages. These included the adhesion molecules Vcam1, CD169, and CD163. The expression level of EMP (Maea) was slightly lower in F4/80+Epor-eGFP+ macrophages than in F4/80+Epor-eGFP− macrophages (Figure 4E). Tyrosine kinase Mertk and PS receptor Tim4 (also known as Timd4), required for nucleus engulfment,27,43,44 and DNase2α, critical for digestion of the engulfed nucleus,28 were also highly expressed in the F4/80+Epor-eGFP+ macrophages (Figure 4F), as were the expression levels of genes involved in iron handling such as heme oxygenase 1 (Hmox1), iron exporter ferroportin (Slc40a1), transferrin receptor (Tfrc), and transferrin (Trf) (Figure 4G). These findings strongly suggest that the F4/80+Epor-eGFP+ macrophages in the BM have evolved a specialized function in supporting erythropoiesis.
To define the key transcription factors (TF) for EBI macrophages, we compared the expression of TFs between the 2 macrophage populations. We found that 4 TFs (Klf, Spic, Nr1h3 [also known as liver X receptor α, LXRα], and Maf) were expressed in the F4/80+Epor-eGFP+ macrophages but not in the F4/80+Epor-eGFP− (Figure 4H), suggesting their selective roles in transcriptional regulation of the EBI macrophages.
EBI macrophages play important roles in proliferation of erythroid cells. But the underlying mechanisms are poorly understood. It has been reported that direct contact with the macrophages was necessary for the enhanced erythroblast proliferation.4 Here our RNA-seq results showed that the expression levels of 3 growth factors, Igf1, I1-18, and Vegfb, were significantly higher in F4/80+Epor-eGFP+ macrophages than in F4/80+Epor-eGFP− macrophages (Figure 4I), suggesting the possibility that EBI macrophages may enhance erythroid proliferation by secreting these growth factors. The RNA-seq data shown in Fig 4E-4I was validated by real-time polymerase chain reaction (supplemental Figure 4).
F4/80+Epor-eGFP+ macrophages were increased under stress
We next examined the functional roles of these F4/80+Epor-eGFP+ macrophages in stress erythropoiesis. Stress erythropoiesis can be induced by phlebotomy, hemolysis, or exogenous Epo administration. Indeed, phlebotomy or hemolysis-induced stress erythropoiesis is ultimately because of increased Epo levels. Therefore, we chose Epo injection as a stress erythropoiesis model. We show that Epo injection led to expansion of erythropoiesis in BM. Figure 5A shows that Epo injection leads to an approximate threefold increase in the number of EBIs in BM with a concomitant increase in EBIs with 5 or more erythroid cells (Figure 5B). The increase in EBIs was accompanied by an increase in both erythroblasts (Figure 5C) and F4/80+Epor-eGFP+ macrophages (Figure 5D), indicating the function of these Epor+ macrophages in stress erythropoiesis. Epo injection resulted in increased surface expression of Vcam1 (Figure 5E) but not CD169 (Figure 5F) on the F4/80+Epor-eGFP+ macrophages. Although Epo injection did not increase the surface expression of CD163, it increased the percentage of F4/80+Epor-eGFP+CD163+ macrophages (Figure 5G). As a negative control, Epo injection had no effect on the expression of Vcam1, CD169, and CD163 on the F4/80+Epor-eGFP− macrophages (data not shown). These findings demonstrate that both erythroid cells and EBI macrophages respond to Epo stimulation in vivo and suggest that Epo enhances the function of the EBI macrophages in supporting erythropoiesis at least in part by promoting the interaction between EBI macrophages and erythroid cells via increased surface expression of Vcam1.

Effects of Epo on EBIs and EBI macrophages in vivo. (A) EBI numbers in mouse BM with and without Epo. (B) Percentages of EBIs with 3, 4, and 5 or more erythroblasts with and without Epo. (C) Erythroblast numbers in mouse BM with and without Epo. (D) F4/80+Epor-eGFP+ macrophage numbers in mouse BM with and without Epo. (Ea) Representative Vcam1 expression profiles with and without Epo; (Eb) quantitative analyses of Vcam1 expression on mouse BM F4/80+Epor-eGFP+ macrophages with and without Epo. (Fa) Representative CD169 expression profiles with and without Epo; (Fb) quantitative analyses of CD169 expression on mouse BM F4/80+Epor-eGFP+ macrophages with and without Epo. (Ga) Representative CD163 expression profiles with and without Epo; (Gb) quantitative analyses of CD163 expression on mouse BM F4/80+Epor-eGFP+ macrophages with and without Epo; (Gc) the percentage of CD163+ cells within BM F4/80+Epor-eGFP+ macrophages with and without Epo. *P < .05, **P < .01, ***P < .001. N = 3.
Effects of Epo on EBIs and EBI macrophages in vivo. (A) EBI numbers in mouse BM with and without Epo. (B) Percentages of EBIs with 3, 4, and 5 or more erythroblasts with and without Epo. (C) Erythroblast numbers in mouse BM with and without Epo. (D) F4/80+Epor-eGFP+ macrophage numbers in mouse BM with and without Epo. (Ea) Representative Vcam1 expression profiles with and without Epo; (Eb) quantitative analyses of Vcam1 expression on mouse BM F4/80+Epor-eGFP+ macrophages with and without Epo. (Fa) Representative CD169 expression profiles with and without Epo; (Fb) quantitative analyses of CD169 expression on mouse BM F4/80+Epor-eGFP+ macrophages with and without Epo. (Ga) Representative CD163 expression profiles with and without Epo; (Gb) quantitative analyses of CD163 expression on mouse BM F4/80+Epor-eGFP+ macrophages with and without Epo; (Gc) the percentage of CD163+ cells within BM F4/80+Epor-eGFP+ macrophages with and without Epo. *P < .05, **P < .01, ***P < .001. N = 3.
We further analyzed changes in splenic erythropoiesis. Similar to phlebotomy or hemolysis-induced stress erythropoiesis,30 we found that spleen changed from a nonerythropoietic organ to be fully erythropoietic after Epo injection as demonstrated by the dramatic increases in both erythroblasts (supplemental Figure 5A) and EBIs (supplemental Figure 5B), which was accompanied by the increase in F4/80+Epor-eGFP+ macrophages (supplemental Figure 5C). Importantly, stress splenic EBIs were also formed by the F4/80+Epor-eGFP+ macrophages (supplemental Figure 5D), demonstrating the role of the F4/80+Epor-eGFP+ macrophages in splenic stress erythropoiesis.
EPOR is also expressed in human EBI macrophages
We examined whether EPOR is expressed in human EBI macrophages. For this purpose, we used an anti-human EPOR antibody to examine the expression of EPOR on human EPOR-expressing BaF3 cells using parental BaF3 cells as negative control45 by flow cytometry. Supplemental Figure 6A shows the antibody stained human EPOR-expressing BaF3 cells but not the parental BaF3 cells. We ectopically expressed human EPOR in 293T cell line and used this antibody to examine the expression of the ectopically expressed human EPOR. Supplemental Figure 6B shows the anti-EPOR antibody stains the human EPOR-expressing 293T cells but not control 293T cells. Finally, we checked the expression of EPOR in primary erythroid cells. Supplemental Figure 6C shows that the anti-EPOR antibody stained erythroid colony-forming unit cells but not CD34+ cells. Together, these results document that this antibody recognized human EPOR.
We examined macrophage populations in human FL for surface marker expression. We stained human FL CD45+ cells with myeloid cell markers CD14/CD16, macrophage marker CD163, and EPOR. Myeloid cells were gated on cells positive for both CD14 and CD16 (Figure 6A). Figure 6B shows that most of the CD14+/CD16+ cells are CD163+. Within the CD163+ cells, ∼27% were EPOR+ (Figure 6C). Cytospin images show that CD163+EPOR+ macrophages are morphologically different from CD163+EPOR− macrophages (Figure 6D). IFC revealed that human FL native EBIs were also formed by the EPOR+ macrophages (Figure 6E-F).
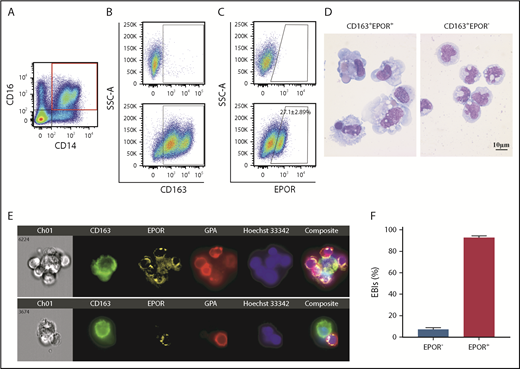
Expression of EPOR in human FL EBI macrophages. (A) Representative plot of CD14 vs CD16 in human FL CD45+ cells. (B) Representative plot of CD163 vs SSC-A of the CD14+CD16+ cells. Top, FMO; bottom: CD163 expression. (C) Representative plot of EPOR vs SSC-A of CD163+ cells. Upper panel: FMO; lower panel: EPOR expression; (D) Representative cytospin images of sorted human FL CD163+EPOR+ macrophages and CD163+EPOR− macrophages. N = 5. (E) Top: a representative EBI structure showing CD163+EPOR+ was surrounded by multiple GPA+ erythroid cells; bottom: a representative image showing the CD163+EPOR− macrophage was surrounded by 1 erythroid cell. (F) Quantitative analyses of human FL EBIs. Quantitative analyses of EBIs were performed using 200 EBIs from 2 independent experiments. FMO, fluorescence minus one.
Expression of EPOR in human FL EBI macrophages. (A) Representative plot of CD14 vs CD16 in human FL CD45+ cells. (B) Representative plot of CD163 vs SSC-A of the CD14+CD16+ cells. Top, FMO; bottom: CD163 expression. (C) Representative plot of EPOR vs SSC-A of CD163+ cells. Upper panel: FMO; lower panel: EPOR expression; (D) Representative cytospin images of sorted human FL CD163+EPOR+ macrophages and CD163+EPOR− macrophages. N = 5. (E) Top: a representative EBI structure showing CD163+EPOR+ was surrounded by multiple GPA+ erythroid cells; bottom: a representative image showing the CD163+EPOR− macrophage was surrounded by 1 erythroid cell. (F) Quantitative analyses of human FL EBIs. Quantitative analyses of EBIs were performed using 200 EBIs from 2 independent experiments. FMO, fluorescence minus one.
EPO enhanced in vitro human EBI formation
To test the hypothesis EPO plays a role in EBI formation by acting on EPO-responsive EBI macrophages, we developed an in vitro EBI formation assay with macrophages derived from human cord blood CD34+ cells. Figure 7A shows that EPOR, along with CD163 and CD169, are expressed on CD34+ cell-derived macrophages. EPOR expression was further confirmed by the finding that EPO treatment led to phosphorylation of STAT5 and AKT (Figure 7B), downstream targets of EPO/EPOR-mediated signal transduction.46,47 We then performed EBI formation by coculture of control macrophages or EPO-pretreated macrophages with erythroblasts in the absence of EPO. Figure 7C shows representative images of the EBIs. Quantitative analyses revealed that the EBI formation was significantly increased by EPO pretreatment of the macrophages (Figure 7D). To define the mechanisms for the enhanced EBI formation, we examined the effects of EPO on expression of CD163, CD169, EMP, and VCAM1CAM1. Supplemental Figure 7 showed EPO did not affect the expression of CD163, CD169, and EMP. Curiously, VCAM1CAM1 is not expressed in the in vitro derived macrophages although it is abundantly expressed in primary human FL EPOR+ macrophages (our unpublished data, W.L., Y.W., H. Zhao, S.W. and X.A.).
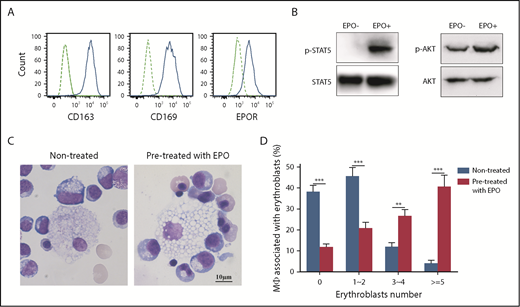
EPO enhanced in vitro human EBI formation. (A) Surface expression of CD163, CD169 and EPOR expression on cord blood CD34+ cell-derived macrophages. (B) Western blot analysis showing phosphorylation of STAT5 and AKT in CD34+ cell-derived macrophages upon EPO stimulation. (C) Representative images of EBIs formed between erythroblasts and untreated macrophages or macrophages pretreated with EPO. (D) Quantitative analyses of the EBIs showing enhancement of EBI formation by EPO pretreatment of the macrophages. *P < .05, ***P < .001. N = 3.
EPO enhanced in vitro human EBI formation. (A) Surface expression of CD163, CD169 and EPOR expression on cord blood CD34+ cell-derived macrophages. (B) Western blot analysis showing phosphorylation of STAT5 and AKT in CD34+ cell-derived macrophages upon EPO stimulation. (C) Representative images of EBIs formed between erythroblasts and untreated macrophages or macrophages pretreated with EPO. (D) Quantitative analyses of the EBIs showing enhancement of EBI formation by EPO pretreatment of the macrophages. *P < .05, ***P < .001. N = 3.
Discussion
Erythroblastic island was discovered >60 years ago by French hematologist Marcel Bessis.1 Yet, the identity of the EBI macrophage is still mysterious. In the present study, we discovered that F4/80+Epor-eGFP+ macrophages in BM and FL are EBI macrophages that have evolved a specialized function in supporting erythropoiesis. This conclusion is supported by several lines of evidence: (1) the native EBIs in mouse BM and FL were composed of F4/80+Epor-eGFP+ macrophages; (2) the F4/80+Epor-eGFP+ macrophages expressed high levels of adhesion molecules known to be involved in macrophage-erythroblast interaction; (3) the F4/80+Epor-eGFP+ macrophages also expressed high levels of molecules required for engulfing extruded nuclei and DNA degradation such as Mertk27,44 and DNase2α28 ; (4) Epo injection led to increases in both quantity and quality of EBIs, which were accompanied by expansion of both erythroblasts and F4/80+Epor-eGFP+ macrophages in vivo; and (5) EPO triggered EPOR-mediated signal transduction in human EPOR+ macrophages and enhanced human EBI formation in vitro.
It is well established that Epor is expressed in erythroid cells and that Epo/Epor-mediated signal transduction is essential for the survival of late stage erythroid progenitor erythroid colony-forming unit and early-stage erythroid precursor proerythroblasts.48-50 There is growing evidence that Epor is expressed beyond erythroid lineage. Epor protein is expressed in brain,20,21 kidney,22 heart,23 and various tumor cell lines.24-26 The expression of Epor in macrophages has been strongly suggested by findings that macrophages in spleen, liver, and peritoneum are responsive to Epo.29,51-53 Using the Epor-eGFP mouse model and the specific anti-human EPOR antibody, we documented in this study that EBI macrophages in BM and FL are characterized by the expression of Epor in mouse and man, suggesting Epo plays important roles not previously described.
EBI macrophages enhance proliferation of erythroid cells,3,4 but the mechanisms are still poorly understood. Our finding that growth factors Igf1, IL-18, and Vegfb were expressed in F4/80+Epor-eGFP+ macrophages suggests the possibility that the EBI macrophages may enhance erythroid proliferation by secreting these growth factors. Of note, the Igf1 receptor Igf1r is expressed in erythroid cells at all developmental stages and interleukin-18 receptor IL18R1 is expressed in erythroid progenitors (our unpublished data, H. Zhao, Y.W., X.A.). Role of IGF1 in regulation erythropoiesis has been suggested.54 Interleukin-18 has been shown to promote cell proliferation.55,56
Erythropoiesis requires large amount of iron for hemoglobin synthesis. It is generally accepted that the majority of iron required to sustain erythropoiesis is derived from recycled red blood cells by splenic iron-recycling macrophages where senescent red blood cells are phagocytosed,57 degraded and the heme is catabolized by Hmox1,58,59 releasing iron for storage in ferritin,60 or export into the circulation by ferroportin.61 Subsequently, iron binds to transferrin and is shuttled to the BM for use in erythropoiesis.62,63 Notably, all the key molecules involved in iron recycling are highly expressed in BM EBI macrophages. These include phagocytosis related molecules PS receptor Tim443 and membrane tyrosine kinase Mertk,27,44 heme metabolism-related molecules Spic and Hmox 1, iron exporter ferroportin, and iron transporter transferrin. Thus, it is tempting to speculate that the BM EBI macrophages possess iron-recycling ability and could provide iron to the developing erythroblasts locally to support erythropoiesis.
Another intriguing finding is the selective expression of Klf1 in EBI macrophages. Using pEKLF/GFP mice, the Bieker group has shown that ∼36% of mouse FL F4/80+ macrophages express EKLF (Klf1) and that Klf1 deficiency significantly impaired the function of central macrophages.64 In this study, using Epor-eGFPcre mice we showed that ∼31% of mouse FL F4/80+ macrophages expressed Epor. Moreover, our RNA-seq analyses showed that Klf1 was expressed in F4/80+Epor-eGFP+ macrophages but not in F4/80+Epor-eGFP− macrophages. Together, these findings strongly suggest that Klf1 is the key transcription factor of EBI macrophages, where it regulates the expression of key molecules important for EBI macrophage function, such as Vcam1 and DNase2α6 and other yet-to-be-identified Klf1 targets in EBI macrophages.
Macrophages are very heterogeneous. Our findings that Vcam1 and CD169 were broadly distributed on the mouse BM F4/80+Epor-eGFP+ macrophages and that only a proportion of mouse F4/80+Epor-eGFP+ macrophages expressed CD163 indicate the heterogeneity within the EBI macrophage population. EBI macrophages support erythropoiesis by stimulating the proliferation and differentiation of early-stage erythroid cells and promoting the enucleation of orthochromatic erythroblasts. As discussed previously, the BM EBI macrophages may also provide iron source for erythropoiesis by recycling senescent red cells. It is likely that these supporting roles may be performed by different subpopulations of EBI macrophages. Single-cell RNA-seq analyses of EBI macrophages should help to define these subpopulations. Consistent with the finding that rat EBIs were characterized by the expression of CD163,33 all human FL EPOR+ macrophages expressed CD163. The finding that only ∼35% mouse F4/80+Epor-eGFP+ macrophages expressed CD163 implies the differences among species.
In summary, we have identified and characterized EBI macrophages. Our transcriptomic data from F4/80+Epor-eGFP+ and F4/80+Epor-eGFP− macrophages provide new insights into potential mechanisms by which EBI macrophages support erythropoiesis. Our studies lay the groundwork for future investigation of the function of EBI macrophages, both during normal and disordered erythropoiesis, including the ineffective erythropoiesis of thalassemia,65,66 the expanded erythron in polycythemia vera,67,68 and altered erythropoiesis in myelodysplastic syndromes.69
The publication costs of this article were defrayed in part by page charge payment. Therefore, and solely to indicate this fact, this article is hereby marked “advertisement” in accordance with 18 USC section 1734.
The online version of this article contains a data supplement.
Acknowledgments
This work was supported in part by grants from the Natural Science Foundation of China (U1804282, 81530005, 81570099, 81770112, and 81700102); National Institutes of Health National, Heart, Lung, and Blood Institute (HL140625), and National Institute of Diabetes and Digestive and Kidney Diseases (5P01DK032094 and DK100810); and the Hugoton Foundation.
Authorship
Contribution: W.L. and Y.W. designed experiments, performed research, analyzed the data, and drafted “Materials and methods”; H. Zhao performed bioinformatics analyses; H. Zhang, Y.X., S.W., X.G., Y. Huang, S.Z., Y. Han, and X.W. performed research; C.M.R., G.H., P.G.G., A.M., K.Y., J.L., and L.C. analyzed the data and edited the manuscript; and X.A. designed experiments, analyzed data, and wrote the manuscript.
Conflict-of-interest disclosure: The authors declare no competing financial interests.
Correspondence: Xiuli An, New York Blood Center, 310 E 67th St, New York, NY 10065; e-mail: xan@nybc.org.

This feature is available to Subscribers Only
Sign In or Create an Account Close Modal