

Key Points
A moderate-intensity endurance exercise training program in SCD patients increases the capillary network without changing its morphology.
This type of training also partly reverses the microvascular deficits commonly observed in SCD patients.

Abstract
Sickle cell disease (SCD) is a genetic hemoglobinopathy leading to 2 major clinical manifestations: severe chronic hemolytic anemia and iterative vaso-occlusive crises. SCD is also accompanied by profound muscle microvascular remodeling. The beneficial effects of endurance training on microvasculature are widely known. The aim of this study was to evaluate the effects of an endurance training program on microvasculature of skeletal muscle in SCD patients. A biopsy of the vastus lateralis muscle and submaximal incremental exercise was performed before and after the training period. Of the 40 randomized SCD patients, complete data sets from 32 patients were obtained. The training group (n = 15) followed a personalized moderate-intensity endurance training program, while the nontraining (n = 17) group maintained a normal lifestyle. Training consisted of three 40-minute cycle ergometer exercise sessions per week for 8 weeks. Histological analysis highlighted microvascular benefits in the training SCD patients compared with nontraining patients, including increases in capillary density (P = .003), number of capillaries around a fiber (P = .015), and functional exchange surface (P < .0001). Conversely, no significant between-group difference was found in the morphology of capillaries. Indexes of physical ability also improved in the training patients. The moderate-intensity endurance exercise training program improved the muscle capillary network and partly reversed the microvascular defects commonly observed in skeletal muscle of SCD patients. This trial was registered at www.clinicaltrials.gov as #NCT02571088.
Introduction
Sickle cell disease (SCD) is the most common life-threatening genetic hemoglobinopathy worldwide, affecting millions of people.1 One single mutation of the gene that encodes for the synthesis of β-globin leads to synthesis of abnormal hemoglobin (HbS). When deoxygenated, HbS may polymerize, eventually resulting in the sickling of its host red blood cells (RBCs).2 Sickled RBCs are less deformable and adhere abnormally to endothelium, causing severe blood hemorheological and hemodynamical disorders.3 In that context, the entrapment of RBCs in the microvessels is promoted and could progress to painful, and potentially critical, vaso-occlusive crises.2 Sickled RBCs are also fragile and break easily, leading to massive intravascular hemolysis.2 Albeit upregulated, erythropoiesis does not counterbalance hemolysis, resulting in severe chronic anemia.2 SCD patients are also subjected to arterial oxygen Hb desaturation.4,5 Collectively, anemia and Hb desaturation depress oxygen transport to tissues.6,7 In accordance with this framework, reduced oxygenation has been observed in resting skeletal muscle8,9 as in other tissues like the brain.6,7 Importantly, the profound muscle microvascular remodeling of SCD patients may also contribute to the reduced oxygen delivery to tissues.10 Indeed, the lower capillary density (CD) and capillary tortuosity (CapTor) observed in SCD patients as compared with healthy subjects drastically reduce the exchange surface area and increase the distance of diffusion for oxygen, 2 major determinants of oxygen delivery to muscle tissue.10 Interestingly, similar microvascular remodeling has also been observed, but to a lesser extent, in sickle cell trait, the heterozygous form of the disease.11 In that context, any strategy that would reduce this deleterious microvascular remodeling is of interest for muscle tissue of SCD patients.
It is well established that endurance exercise training is an effective way to improve muscle oxygen supply by increasing CD and CapTor in healthy subjects and also in pathophysiological conditions.12-19 The microvascular benefits of regular physical activity have also been observed in sickle cell trait, with increased capillary network and tortuosity in active carriers compared with sedentary counterparts.20 Considering the feasibility and the safety of endurance exercise training in SCD patients21-23 and the potential benefits for patients of such an intervention,12-19 it is important to consider endurance exercise training as a possible strategy to counteract or even reverse, at least in part, the skeletal muscle microvascular defects observed in adult SCD patients. Recently, our group proposed an 8-week personalized moderate-intensity endurance training program on a cycle ergometer in adult SCD patients without severe chronic complications.22 This exercise program induced functional muscle improvements.22
The aim of the present study is to detail the skeletal muscle microvascular adaptations induced by this adapted endurance training program. More specifically, we hypothesized that the proposed moderate-intensity endurance exercise training program would lead to a growth of the capillary network in skeletal muscle in SCD patients.
Methods
Patients
Among the 40 adult homozygous SCD patients without severe chronic complications included, 33 (83%) completed this study (34 ± 10 years old; 18 men and 15 women).22 Patients’ baseline characteristics were similar between groups.22 The study took place at AP-HP Henri Mondor University Hospitals in the reference center for major sickle cell syndromes, the cardiac rehabilitation unit, and the functional and respiratory explorations unit in Créteil (France) as well as at the University Hospital of Saint-Etienne (France), which was the sponsor of this study (www.clinicaltrials.gov #NCT02571088). Eligible volunteers were informed of the purposes, procedures, and possible associated risks and/or discomforts related to the protocol before they gave written informed consent. The experiment was approved by the ethics committee and conformed to the standards set by the Declaration of Helsinki for human studies. All patients underwent preliminary screening, including a medical examination and blood phenotype analysis. Exclusion criteria are reported in the supplemental Methods (available on the Blood Web site).
Study design
Included SCD patients were subjected to a muscle biopsy and submaximal incremental cycling test as previously described.22 Then, patients were randomly (1:1) assigned to either a training (n = 20) or nontraining (n = 20) group. Subsequently, the patients in the training group performed a supervised endurance exercise training program, while the patients in the nontraining group maintained their usual lifestyle. After this 8-week period, the measurements/procedures performed at baseline were repeated. The second muscle biopsy was performed 2 to 3 cm proximal to the pretraining biopsy.
Muscle biopsy
Muscle biopsy specimens were obtained from the vastus lateralis using the percutaneous technique.24 After shaving, asepsis was obtained using alcohol and 10% iso-Betadine (MEDA Pharma, Paris, France). Then, local anesthesia of cutaneous and subcutaneous tissues was performed (2% lidocaine; AstraZeneca, Rueil-Malmaison, France). A small incision (not exceeding 8 mm) was made, cutting skin and muscular aponeurosis, through which Weil-Blakesley forceps (Lawton, Tittlingen, Germany) were introduced until the subjacent muscle. Approximately 150 to 200 mg of muscle was extracted. Hemostasis was then ensured by 5 minutes of compression, and the access was closed by sterile strips. Part of the biopsy sample that contained well-identified fascicles was oriented under a stereomicroscope and mounted in cryomount (Histolab, Göteborg, Sweden), frozen in isopentan (Chevron Phillips Chemicals International, Overijse, Belgium), and finally stored in liquid nitrogen until histochemical and immunohistochemical analyses. The remainder of the samples was frozen and stored in liquid nitrogen until further biochemical analysis.
Submaximal cardiopulmonary exercise test
The exercise tests were performed on an electronic cycle ergometer. Exercise started at a workload of 20 or 30 W and increased step-wise every 2 minutes by 10 or 15 W for women or men, respectively. Oxygen uptake (O2, L/min) and tissue saturation index (TSI; %) were continuously recorded while blood lactate concentration ([lactate]b, mmol/L) was assessed every minute. Patient-reported rating of perceived exertion (RPE; arbitrary units [A.U.]) was recorded at the end of each 2-minute stage. Exercise was stopped as soon as a blood lactate concentration ≥4 mmol/L was recorded.22,23 See supplemental Methods for more details.
Endurance exercise training protocol
Patients in the training group performed a physical activity program (moderate-intensity endurance exercise training) composed of 24 exercise sessions on a cycle ergometer (3 sessions a week for 8 weeks). Each session consisted of (1) an initial warm-up (5 minutes at 70% of the training workload), (2) a constant-load endurance exercise (30 minutes at 100% of the training workload), (3) a cool-down (5 minutes at 70% of the training workload), and (4) light stretching (5 minutes). Particular attention was paid to the appropriate hydration of patients during each session by encouraging patients to drink regularly and by providing them water ad libitum. During each exercise session, a physician was present for the clinical observation of patients. Blood pressure, peripheral oxygen saturation, and blood lactate concentration were measured, and self-perceived exertion was rated during each training session for monitoring and safety reasons (data not shown).22 If necessary, the exercise workload was modified between sessions so that blood lactate concentrations during the training sessions approximately matched the target value of 2.5 mmol/L (see supplemental Methods for more details).22,23
Muscle analysis
Muscle histological analysis of 1 patient in the nontraining group was impossible because of the poor quality of the sample. In total, biopsy samples from 32 of the 33 patients that completed the study were analyzed (17 men [53%] and 15 women [47%]; 17 in the nontraining group [10 men (59%) and 7 women (41%)] and 15 in the training group [8 men (53%) and 7 women (47%)]). All muscle analyses were carried out in a double-blind manner.
Muscle fiber types and perimeter
Fiber type determination was performed by immunofluorescence on 2 serial cross-sections. Anti-laminin-α1 (Sigma, Saint-Quentin-Fallavier, France) was conjugated to Alexa Fluor 488 (Invitrogen, Cergy-Pontoise, France) to identify the extracellular matrix. Additionally, monoclonal antibodies against myosin heavy-chain I (MHC-I) (BA-D5, DSHB) or MHC-IIa (N2.261, Enzo Life Sciences) were conjugated to Alexa Fluor 546 (Invitrogen) to identify the different fiber types. Images were captured with a high-resolution cooled digital DP-72 camera coupled to a BX-51 microscope (Olympus, Rungis, France) at a resolution of 0.64 µm/pixel. For each patient and condition, ∼3 representative fields of 120 fibers were selected. Using the image processing software Visilog-6.9 (Noesis, Gif-sur-Yvette, France), the contractile type (I, I-IIa, IIa, IIa-IIx, or IIx) was determined for each fiber, as previously described.25 Only 3 fiber types were considered: muscle fiber types I, IIa, and IIx. Hybrid I-IIa and IIa-IIx fibers were integrated into type I and IIa fibers, respectively. Muscle fiber perimeter (PF) was also measured.
Microvascular network analysis
Morphometric analysis of microvasculature was performed as previously described.10,11 Briefly, capillaries were stained with CD31 antibody (Dako, Glostrup, Denmark), which recognizes platelet endothelial cell adhesion molecule-1 expressed in vascular endothelial cells. The software ImageJ was used to analyze the microvascular network. A representative field was chosen to measure parameters of microvascular network density, namely CD (number of capillaries [cap] per mm2) and CAF (number of capillaries in contact with a single muscle fiber). In the same field, 90 capillaries were analyzed to measure morphological characteristics of microvessels such as CapTor, capillary surface area (CSA), capillary perimeter (CP) and capillary outer diameter (COD) as previously described.9,10 COD was also stratified considering the percentage of capillaries with diameters of <5 µm, 5 to 10 µm, and >10 µm. The product CD × CSA was used to estimate the instantaneous volume of blood that crosses the 10-µm-thick section. In the present study, Hb concentration was incorporated into this product (CD × CSA × Hb) to provide a better functional index of oxygen delivery potential in skeletal muscle. Other functional indexes, namely LC (the length of contact between a muscle fiber and the surrounding capillaries) and the LC/PF ratio (which indicates the exchange surface between a considered muscle fiber and the surrounding capillaries), were also determined. CAF and LC/PF were analyzed both without taking into account the fiber typology (mean) and by fiber type considering an average of 25 fibers per fiber type in the same field (Figure 1A).
![Effects of endurance exercise training in muscle microvascular characteristics of muscle fibers in training compared with nontraining patients. (A) Images of serial cross-sections labeled to identify (1) fiber type distribution (MHC-I or MHC-IIa stained in red), (2) extracellular matrix (anti-laminin-α1 stained in green), and (3) capillaries (CD31 antibody stained in black) of a nontraining patient and a training patient before and after the training period. Increases in the number of capillaries per surface area (CD) and around a muscle fiber (CAF) were observed after training (illustrated by CD31 images at high magnification) in the training patient, but not in the nontraining patient. (B) Percentage change in CAF in training and nontraining groups. CAF increased in training patients compared with nontraining patients (all fibers [mean]) and more specifically in type I muscle fibers. (C) Percentage change in LC/PF in training and nontraining groups. LC/PF increased in training patients compared with nontraining patients (all fibers [mean]) and more specifically in type I and type IIa muscle fibers. Statistically different between the 2 groups: *P < .05 and ***P < .001. Scale bars represent 100 μm.](https://ash.silverchair-cdn.com/ash/content_public/journal/blood/134/25/10.1182_blood.2019001055/5/m_bloodbld2019001055f1.png?Expires=1769087960&Signature=zoM2D-7iTG1SjjVblJWJVowR~pTqmsiBYdcIOce5lhMecAY~KzpdAmqc2X9D1EHqgFAk0gLmJGcCmDIscVNqx4vICxxaDJQAW7Q31-R6VdNHCx4mincvXXHiE4YwJOW65HLyRKaZ7A6C9zzDVWLcuXiu6ZFtZaj3PHKSBYKZkYv0~-7WtzOmkiemtE~P-lqmCnQfgNmB5aW2gVVZ0YqyqmfOpbMTaBQ6n1zf8iw5BMsKYahW1iEwSBJnRF-r6clGhYsjeuGCH-2R0VbVkttY6BasaW~-4JPbaxJgLC2HZPHhDX2GVSZ4lwFc33uwqMlXyqd7AOpo1IjctrBZ52pSBA__&Key-Pair-Id=APKAIE5G5CRDK6RD3PGA)
Effects of endurance exercise training in muscle microvascular characteristics of muscle fibers in training compared with nontraining patients. (A) Images of serial cross-sections labeled to identify (1) fiber type distribution (MHC-I or MHC-IIa stained in red), (2) extracellular matrix (anti-laminin-α1 stained in green), and (3) capillaries (CD31 antibody stained in black) of a nontraining patient and a training patient before and after the training period. Increases in the number of capillaries per surface area (CD) and around a muscle fiber (CAF) were observed after training (illustrated by CD31 images at high magnification) in the training patient, but not in the nontraining patient. (B) Percentage change in CAF in training and nontraining groups. CAF increased in training patients compared with nontraining patients (all fibers [mean]) and more specifically in type I muscle fibers. (C) Percentage change in LC/PF in training and nontraining groups. LC/PF increased in training patients compared with nontraining patients (all fibers [mean]) and more specifically in type I and type IIa muscle fibers. Statistically different between the 2 groups: *P < .05 and ***P < .001. Scale bars represent 100 μm.
Effects of endurance exercise training in muscle microvascular characteristics of muscle fibers in training compared with nontraining patients. (A) Images of serial cross-sections labeled to identify (1) fiber type distribution (MHC-I or MHC-IIa stained in red), (2) extracellular matrix (anti-laminin-α1 stained in green), and (3) capillaries (CD31 antibody stained in black) of a nontraining patient and a training patient before and after the training period. Increases in the number of capillaries per surface area (CD) and around a muscle fiber (CAF) were observed after training (illustrated by CD31 images at high magnification) in the training patient, but not in the nontraining patient. (B) Percentage change in CAF in training and nontraining groups. CAF increased in training patients compared with nontraining patients (all fibers [mean]) and more specifically in type I muscle fibers. (C) Percentage change in LC/PF in training and nontraining groups. LC/PF increased in training patients compared with nontraining patients (all fibers [mean]) and more specifically in type I and type IIa muscle fibers. Statistically different between the 2 groups: *P < .05 and ***P < .001. Scale bars represent 100 μm.
Statistical analysis
Descriptive results are presented as means (standard deviation [SD]) or medians (interquartile range [IQR]) depending on the normality of each variable as assessed by the Shapiro-Wilk test. The statistical analyses compared the relative mean change between groups (nontraining vs training). Student t tests for independent groups or Mann-Whitney tests were used according to the normality of the variable. Categorical variables, presented as number (percentage of population), were compared with Fisher’s exact test. The critical level for statistical significance was set at 5%. Analyses were computed with Statistica 8 (Statsoft, Tulsa, OK).
Results
Power output and V̇O2 at the first lactate threshold (LT1), [lactate]b at 40 or 60 W (for women and men, respectively), and CD have already been reported22 but are repeated here for discussion and convenience of the reader.
Baseline data and comparisons
At baseline, no significant between-group differences were found for anthropometric, hemoglobinic, or hematologic data (Table 1). Muscle microvascular characteristics measured at baseline were not significantly different between training and nontraining groups (Table 2). Muscle microvascular characteristics measured at baseline were not significantly different between patients receiving and not receiving hydroxyurea (HU) treatment (supplemental Table 1).
Baseline anthropometric, hemoglobinic, and hematologic characteristics of nontraining and training patients with SCD
| Variables | All (n = 33) | Nontraining patients (n = 18) | Training patients (n = 15) | P |
|---|---|---|---|---|
| Age, y | 34.1 (9.9) | 33.6 (9.0) | 34.7 (11.1) | .738 |
| Males, n (%) | 18 (54.5) | 10 (55.6) | 8 (53.3) | .898 |
| BMI, kg/m2 | 22.0 (2.7) | 22.2 (2.7) | 21.8 (2.8) | .682 |
| Hb, g/dL | 9.2 [8.3; 9.7] | 9.2 [8.2; 9.7] | 9.3 [8.6; 10.4] | .677 |
| Hematocrit, % | 27.4 (4.13) | 27.9 (3.7) | 26.8 (4.7) | .253 |
| HbS, % | 83.4 [76.3; 87.8] | 84.8 [76.1; 88.6] | 80.3 [77.3; 87.3] | .518 |
| HbF, % | 5.2 [2.9; 11.3] | 5.6 [3.0; 6.9] | 5.9 [3.2; 12.0] | .459 |
Results are expressed as mean (SD), n (% of population), or median [IQR].
BMI, body mass index.
Baseline microvascular and integrative characteristics of nontraining and training SCD patients
| Variables | All (n = 32) | Nontraining patients (n = 17) | Training patients (n = 15) | P |
|---|---|---|---|---|
| Microvascular characteristics | ||||
| Morphological characteristics | ||||
| CP, µm | 37.1 (9.6) | 39.0 (11.5) | 34.9 (6.8) | .289 |
| CSA, µm2 | 63.8 [39.0; 77.0] | 66.8 [39.3; 80.9] | 53.6 [38.8; 66.4] | .299 |
| COD, µm | 6.1 [4.8; 6.8] | 6.3 [4.9; 7.0] | 5.4 [4. 8; 6.4] | .299 |
| COD <5 µm, % | 26.7 [16.0; 62.6] | 20.5 [15.9; 64.4] | 48.2 [16.0; 61.3] | .664 |
| 5 < COD <10 µm, % | 61.0 [36.0; 77.0] | 72.2 [33.3; 76.5] | 50.0 [37.6; 79.3] | .985 |
| COD >10 µm, % | 1.5 [0.0; 4.3] | 2.3 [0.0; 5.5] | 1.1 [0.0; 2.8] | .395 |
| CapTor, A.U. | 2.14 (0.12) | 2.12 (0.10) | 2.16 (0.13) | .445 |
| Quantitative characteristics | ||||
| CD, cap/mm2 | 195 (32) | 193 (31) | 198 (34) | .611 |
| CAF, cap/fiber | ||||
| All fibers (mean) | 2.4 [2.1; 2.8] | 2.3 [2.0; 2.7] | 2.5 [2.2; 2.8] | .396 |
| Type I fibers | 2.8 [2.4; 3.3] | 2.8 [2.4; 3.1] | 2.8 [2.6; 3.3] | .748 |
| Type IIa fibers | 2.2 [1.9; 2.5] | 2.1 [1.9; 2.3] | 2.3 [2.1; 2.5] | .089 |
| Type IIx fibers | 1.5 [1.8; 1. 7] | 1.3 [1.2; 1.5] | 1.5 [1.3; 1.9] | .443 |
| Functional indexes | ||||
| LC, µm | 27.7 (10.7) | 28.5 (12.4) | 26.8 (8.7) | .653 |
| LC/PF, % | ||||
| All fibers (mean) | 11.2 (3.3) | 11.6 (3.9) | 10.9 (2.6) | .579 |
| Type I fibers | 13.4 (3.3) | 13.8 (3.7) | 12.9 (2.8) | .434 |
| Type IIa fibers | 10.3 (3.2) | 10.6 (3.5) | 10.1 (2.9) | .660 |
| Type IIx fibers | 6.5 [4.7; 8.2] | 5.5 [4.0; 8.2] | 7.1 [6.1; 8.1] | .292 |
| CD × CSA, µm2/mm2 | 14 400 (6622) | 15 146 (7601) | 13 554 (5444) | .506 |
| CD × CSA × Hb, A.U. | 1.34 (0.78) | 1.43 (0.83) | 1.25 (0.75) | .520 |
| Integrative data | ||||
| At LT1 | ||||
| Power output, W | 40.0 [30.0; 45.0] | 35.0 [30.0; 43.8] | 40.0 [30.0; 45.0] | .914 |
| O2, L/min | 0.64 [0.58; 0.82] | 0.67 [0.59; 0.78] | 0.62 [0.58; 0.82] | .638 |
| TSI, % | 66.0 [63.1; 67.9] | 65.9 [61.1; 67.5] | 66.0 [64.4; 68.0] | .539 |
| At 40W (women) and 60W (men) | ||||
| O2, L/min | 0.79 (0.19) | 0.82 (0.19) | 0.77 (0.19) | .461 |
| HR, min | 135 (17) | 137 (18) | 131 (15) | .331 |
| [lactate]b, mmol/L | 2.7 (0.7) | 2.7 (0.7) | 2.6 (0.8) | .857 |
| RPE, A.U. | 3.0 [1.5; 5.5] | 3.0 [1.3; 4.0] | 2.5 [1.8; 5.8] | 1.000 |
Results are expressed as mean (SD) or median [IQR]. P represents the difference between nontraining and training patients.
Training impact on muscle microvasculature
Changes in microvascular characteristics after 8 weeks of moderate-intensity endurance exercise training or habitual daily life are presented in Table 3. Treatment-induced changes in microvascular network density were different between groups. Specifically, CD (Table 3) and CAF (Figure 1B) significantly increased in the training group compared with the nontraining group (+17%, P = .003 and +18%, P = .015, respectively). The percentage change in CAF was greater in training SCD patients compared with nontraining patients in type I muscle fibers (+23%, P = .0004), but not in other fiber types (Figure 1B). Concerning the changes in the morphological characteristics of the microvessels, no significant between-group differences were found for CapTor, CP, CSA, or COD. In addition, no changes were observed in the percentage of capillaries with COD <5 µm, 5 to 10 µm, or >10 µm. The changes in the functional surface of exchange between capillaries and muscle fibers differed between groups. Specifically, LC/PF significantly increased in training patients compared with nontraining patients for all fibers (+42%, P < .0001; Figure 1C), as well as in type I and IIa muscle fibers (+48%, P < .0001 and +35%, P = .0001, respectively; Figure 1C). The increase in LC/PF in the training group is mainly due to the increase in LC (+50%, P = .0001), since PF was unchanged (data not shown; P = .122). The product CD × CSA increased in training patients compared with nontraining patients (+26%, P = .040; Figure 2A). When Hb is incorporated to this index (CD × CSA × Hb), an increase was observed in the training group compared with the nontraining patients (+33%, P = .027) (Figure 2B). Of note, the training-induced increase of this functional index CD × CSA × Hb is attributable to the increase of CD, since both CSA and Hb were unchanged by the training program (Table 3).22 Interestingly, the training-induced adaptations were not different between patients treated or not treated with HU (supplemental Table 2). One may also note that men and women adapted similarly to endurance training (supplemental Table 3). In the present study, the changes in the microvascular characteristics of the 4 hospitalized patients in the nontraining group were not different from the 13 others (supplemental Table 4), suggesting that the sedentary behavior resulting from hospitalization did not seem to have falsely widened the between-group differences (training vs nontraining).
Effects of endurance exercise training on microvascular characteristics and integrative data in training compared with nontraining patients
| Relative change (%) | |||
|---|---|---|---|
| Variables | Nontraining patients (n = 17) | Training patients (n = 15) | P |
| Microvascular characteristics | |||
| Morphological characteristics | |||
| CP, µm | +5.8 (31.1) | +18.5 (27.7) | .235 |
| CSA, µm2 | −0.90 [−11.9; +20.5] | +19.9 [−0.23; +85.1] | .157 |
| COD, µm | −1.3 [−6.4; +8.0] | +4.5 [−1.7; +40.8] | .168 |
| COD <5 µm, % | −0.9 [−43.4; +28.1] | −51.8 [−73.6; +5.3] | .212 |
| 5 < COD <10 µm, % | +3.1 [−8.94; +38.0] | +26.8 [−7.51; +104] | .485 |
| COD >10 µm, % | −14.3 [−60.5; +98.6] | +9.9 [−19.1; +33.1] | .530 |
| CapTor, A.U. | +0.9 [−2.6; +3.7] | +2.7 [−6.5; +10.7] | .912 |
| Quantitative characteristics | |||
| CD, cap/mm2 | +2.6 (8.8) | +17.3% (16.2) | .003 |
| Functional indexes | |||
| LC, µm | −6.1 (35.6) | +48.5 (34.7) | <.001 |
| Integrative data | |||
| At LT1 | |||
| PO, W | +3.4 (29.7) | +44.6 (20.1) | <.001 |
| O2, L/min | −4.2 [−6.3; +13.8] | +24.7 [+16.1; +39.5] | <.001 |
| TSI, % | −79.8 [−121.0; −17.0] | −41.8 [−161.0; +0.8] | .588 |
| At 40 W (women) or 60 W (men) | |||
| [lactate]b, mmol/L | +5.2 (25.6) | −18.4 (19.8) | .007 |
| RPE, A.U. | −33.3 [−66.7; +29.8] | −89.2 [−98.4; −75.0] | .003 |
Results are expressed as mean (SD) or median [IQR]. Bold results indicate statistically significant differences at P < .05.
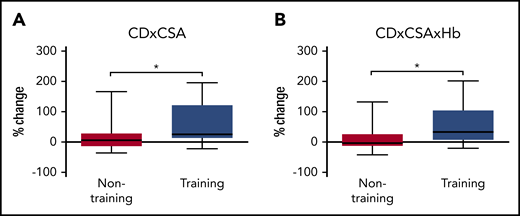
Effects of endurance exercise training on muscle microvascular functional indexes in training compared with nontraining patients. (A) Percentage change in CD × CSA in training and nontraining groups. CD × CSA increased in training patients compared with nontraining patients. (B) Percentage change in CD × CSA × Hb in training and nontraining groups. CD × CSA × Hb increased in training patients compared with nontraining patients. Statistically different between the 2 groups: *P < .05.
Effects of endurance exercise training on muscle microvascular functional indexes in training compared with nontraining patients. (A) Percentage change in CD × CSA in training and nontraining groups. CD × CSA increased in training patients compared with nontraining patients. (B) Percentage change in CD × CSA × Hb in training and nontraining groups. CD × CSA × Hb increased in training patients compared with nontraining patients. Statistically different between the 2 groups: *P < .05.
Effects of training on some functional and metabolic integrative parameters
Discussion
The present study is the first clinical randomized controlled trial evaluating the effects of an 8-week personalized moderate-intensity endurance exercise training program on skeletal muscle microvasculature characteristics in SCD patients without severe chronic complications. The main findings are that endurance exercise training did not induce changes in the morphology of capillaries (CP, CSA, COD, and CapTor) but was effective at (1) growing the capillary network (assessed by CD and CAF), (2) increasing indexes of the supply potential of blood and oxygen to training muscles (estimated by CD × CSA and CD × CSA × Hb, respectively), and (3) increasing functional indexes of exchange between microvessels and muscular tissue (LC and LC/PF ratio).
At baseline, the present study confirmed the capillary rarefaction, enlargement, and relative straightness previously reported in Cameroonian SCD patients compared with control healthy couterparts.10 While rarefaction restricts blood and oxygen supply to muscular tissue, enlargement and relative straightness contribute to reduce flow resistance and RBC transit time in microvessels in order to limit the associated local blood flow disturbances and facilitate passage of the less deformable HbS-containing erythrocytes through the capillary network. Thus, SCD-induced enlargement and relative straightness of capillaries contribute to alleviate, but not eliminate, the risk of erythrocyte entrapment in the microvasculature. Of note, capillary rarefaction was more pronounced in SCD patients involved in the present study than previously reported (CD: 195 [32] vs 270 [20] cap/mm2, respectively).10 Because capillary network is altered by age26 and physical deconditioning,27 the weakness of the capillary network of the present SCD patients may be explained by their older age (34 ± 10 vs 24 ± 5 years old, respectively) and less active lifestyle than in our previous study.10 Conversely, capillary enlargement (COD) and straightness (CapTor) were less pronounced in the present study than previously reported.10 The fact that only patients without complications were included in the present study may at least partly explain this difference. The discrepancy between studies may also relate to differences in medical care and mortality between the studied populations. Concerning medical care, it is important to note that half of our population was under treatment with HU,22 and one cannot exclude that the improvement of clinical profiles of patients by HU may reduce the muscular repercussions of SCD. However, further studies are necessary, since the effects of HU on muscle characteristics remain unknown to date (supplemental Table 1). Finally, considering that high COD and low CapTor are beneficial for hemodynamics in SCD,10 one cannot exclude that patients with high COD and low CapTor displayed a higher survival rate in Cameroon, so that patients with high COD and low CapTor were selectively included in our previous Cameroonian study.10
The morphological characteristics of the capillaries (CP, CSA, COD, and CapTor) remained unchanged in both groups. This lack of change is in accordance with the known low potential for endurance training to alter CP and CSA.19 These unchanged posttraining morphological characteristics do not exclude internal rearrangement of the capillary compartments. Indeed, despite unchanged CSA, Baum et al19 reported increases in pericyte and endothelial cell thickness and a decrease in basement membrane thickness in response to endurance training. As a whole, the lack of change in the morphological properties of the capillary network seems to indicate that the capacity of the RBCs to cross over the microvascular network is not altered by endurance training. Although CP, CSA, COD, and CapTor did not change, a few studies have demonstrated that chronic moderate-intensity physical activity enhances vascular function by improving nitric oxide bioavailability in SCD patients28 and decreasing both oxidative stress29 and endothelial activation30 in a mice model of SCD. From that point of view, it cannot be excluded that hemodynamics is improved after endurance training despite the lack of changes in the morphological properties of the capillary network. Further studies including direct assessments of hemodynamics are necessary.
In agreement with our original hypothesis, the present study highlighted beneficial effects of a moderate-intensity endurance exercise training program on growth of the skeletal muscle microvascular network of SCD patients. These findings are congruent with previous studies demonstrating the beneficial effects of endurance training on skeletal muscle capillarization in healthy and pathological populations.12-19 In the present study, the increased number of capillaries per square millimeter (CD) or in contact with a muscle fiber (CAF) in the training patients cannot be attributed to changes in fiber size, since PF was not altered. Consequently, the increases in CD and CAF can definitely be attributed to a training-induced angiogenesis. While the underlying mechanisms of the observed capillary growth are not known in the present case and beyond the scope of the present study, the shear stress induced by exercise-related increases in muscle blood flow may play a determinant role.31 However, because PF remained unchanged, the increase of the LC/PF ratio is mostly explained by the marked increment of LC. Because CapTor and COD, which both determine LC, were not modified by the training program, enhancements of LC and thus of the LC/PF index are mainly due to the increase in the number of capillaries per surface unit (CD) and in contact with a muscle fiber (CAF). Interestingly, the increases in CAF and LC/PF mainly took place in type I muscle fibers. This fiber-type specific response can be explained by the preferential recruitment of this type of fiber during moderate-intensity endurance exercise training as performed in the present study. While Charifi et al15 also observed a fiber-type–specific response to training in elderly men, the greater increase of LC/PF in type II muscle fibers (+69%) than in type I muscle fibers (+39%) they reported results from a different training program, especially the higher training intensity than in the present study. Collectively, the increases in CD, CAF, and LC/PF observed in the training patients clearly indicate (1) an increased surface area between capillaries and muscle fibers, and (2) a decreased diffusion distance, both of which are very beneficial for oxygen distribution to muscle tissue of SCD patients. In addition, functional indirect indexes used in the present study provide some interesting insights on the potential capacity of blood supply and oxygen delivery to skeletal muscle. The product CD × CSA, used to estimate the volume of blood that crosses a 10-µm-thick slice, increased in the training group. Because Hb concentration is a critical component of muscle oxygen supply, the previous product was affected by the degree of anemia. As a result, the product CD × CSA × Hb was proposed. An increase in CD × CSA × Hb was also observed in the training group compared with the nontraining group. Collectively, the increases in CD × CSA and CD × CSA × Hb observed in the training patients would support the idea of a better capacity for blood supply and oxygen delivery to training muscles. However, this latter inference must be taken with caution, since local blood flow and oxygen supply were not directly investigated/assessed in the present study. Only one indirect data (ie, TSI) of the present study would argue in favor of this possibility. At LT1, TSI remained unchanged and oxygen uptake increased. Because TSI is the balance between oxygen supply and consumption, these results suggest that oxygen supply was higher at LT1 after training. Further studies with more direct measures would be necessary to be able to conclude this point. Previous studies have underlined the paradox that increased cardiac output and increased blood flow to the microcirculation (to compensate anemia) coexist with decreased tissue oxygen saturation.32 This tissue oxygen supply-demand mismatch in patients with SCD32 is accompanied by arterialization of peripheral venous blood.32,33 The potentially beneficial effects of endurance training on the microcirculatory perfusion efficiency, oxygen supply-demand mismatch, and arterialization of peripheral venous blood in SCD remain to be investigated. Due to the clinical and biological benefits of HU treatment in SCD,1,34,35 the hypothesis that HU could increase muscular benefits in response to endurance training arises. In the present study, HU and non-HU patients adapted similarly to endurance training. Previous studies have reported higher HbF and lower HbS levels, larger anemia, better peripheral oxygen saturation, and both greater nitric oxide bioavailability and nitric oxide responsiveness in women than in men with SCD.36-39 These differences may modulate the exercise-related physiological responses between men and women37,40,41 and consequently raise the question of whether muscle characteristics of men may adapt differently than those of women in response to the same training program. In the present study, the microvascular characteristics responded similarly in men and women. Despite these results, the small number of patients investigated in the present study requires us to be cautious with our conclusions. Further studies on the effects of HU and sex on training-induced muscle adaptations in SCD are thus warranted.
The capillary growth observed in the training patients coincides with improvement of their physical capacity. More specifically, endurance training increased power output and oxygen uptake at LT1. Besides, the decreased blood lactate concentrations and rating of perceived exertion at a given power output clearly indicate that a given physical task was physiological and psychological less stressful after training. Based on previous22 and the present findings, a moderate-intensity endurance exercise training program has important microvascular and functional implications for SCD patients without severe chronic complications. The observed microvascular and functional adaptations may contribute to ameliorate the quality of life of SCD patients,42 further research is needed in a larger cohort of SCD patients to determine if a long-term moderate-intensity endurance training program can improve clinical outcomes in SCD.
In summary, the present study demonstrates for the first time that a moderate-intensity endurance exercise training program over 8 weeks improves skeletal muscle microvasculature and partly reverses the microvascular deficits previously observed in SCD patients. The microvascular benefits included a marked angiogenesis and an increase in functional exchange surface between capillaries and muscle fibers. The particular morphology of capillaries in SCD (low CapTor and high COD) remained unchanged in response to endurance exercise training, suggesting that the risk of RBC entrapment in the microvasculature is not augmented after training. The present study suggests that training-induced rearrangement of the microvascular network due to capillary growth may contribute to the concomitant improvement in the patients’ physical capacity.
For original data, please contact the corresponding author, Léonard Féasson.
The online version of this article contains a data supplement.
The publication costs of this article were defrayed in part by page charge payment. Therefore, and solely to indicate this fact, this article is hereby marked “advertisement” in accordance with 18 USC section 1734.
Acknowledgments
The authors thank John Temesi for editorial assistance and Marie-Pierre Blanc, Dominique Gouttefangeas, and Marion Ravelojaona (Myology Unit, Referent Center of Rare Neuromuscular Diseases, Euro-NmD, University Hospital of Saint-Etienne, France) for helpful technical assistance. This article was written on behalf of the EXDRE collaborative study group.
This work was supported in part by research funding from “Société française de cardiologie” and “l’association l’ar·mony.”
Authorship
Contribution: L.A.M., L.F., B.G., F.G., and P.B. designed and conducted this study; C.C.-G. and D.B. contributed to the histological technical assistance; T.R. analyzed tissue oxygenation; A.N.M. performed muscle analyses and wrote the first draft of the article; and all authors critically reviewed the draft and approved the final version for publication.
Conflict-of-interest disclosure: The authors declare no competing financial interests.
Correspondence: Léonard Féasson, Unité de Myologie, Bâtiment IRMIS, Campus Santé Innovations, Hôpital Nord, 42 055 CHU de St Etienne, Cedex 2, France; e-mail: leonard.feasson@univ-st-etienne.fr.

This feature is available to Subscribers Only
Sign In or Create an Account Close Modal