

In the column labeled “TACI short” in Figure 6A on page 1756, the lower cell in the image in the bottom row is incorrect; it is the same as the upper cell in the image in the second row of the same column. The corrected Figure 6 is shown below. The authors apologize for the error, which does not change the conclusions of the experiment. The error has been corrected in the online version of the article.
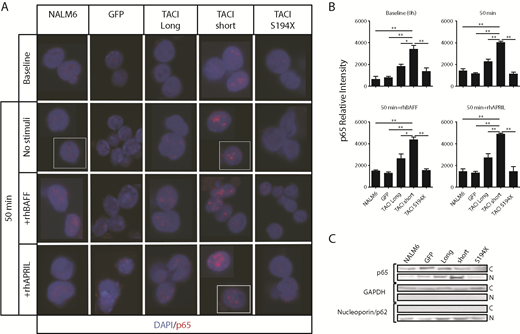
Differential NF-κB activation by TACI isoforms in human pre-B cells. (A) Confocal microscopy of isolated nuclei from NALM6 nontransduced cells, NALM6 GFP, NALM6 with TACI short or long isoforms, and nonsignaling TACI S194X mutant cells, cultured as in Figure 4 and stained for p65 (red); nuclei were counterstained with DAPI (blue). Images show white dividing lines for cells taken from the same field. Original magnification ×63. (B) Quantitative assessment of p65 nuclear translocation (relative to cell number), represented as p65 relative intensity. The mean percentage and standard error were calculated from 3 independent experiments; error bars represent standard error of the mean. *P < .05; **P < .01; 2-tailed unpaired Student t test. (C) Immunoblot analysis of p65 nuclear translocation after subcellular fractionation of resting cells after 6-hour starvation. (C: cytoplasmic fraction; N: nuclear fraction; GAPDH: cytoplasmic fraction loading and purification control; and Nucleoporin/p62: nuclear fraction loading and purification control). For quantitation of nuclear p65 levels, >200 cells were microscopically assessed and analyzed with ImageJ software.
Differential NF-κB activation by TACI isoforms in human pre-B cells. (A) Confocal microscopy of isolated nuclei from NALM6 nontransduced cells, NALM6 GFP, NALM6 with TACI short or long isoforms, and nonsignaling TACI S194X mutant cells, cultured as in Figure 4 and stained for p65 (red); nuclei were counterstained with DAPI (blue). Images show white dividing lines for cells taken from the same field. Original magnification ×63. (B) Quantitative assessment of p65 nuclear translocation (relative to cell number), represented as p65 relative intensity. The mean percentage and standard error were calculated from 3 independent experiments; error bars represent standard error of the mean. *P < .05; **P < .01; 2-tailed unpaired Student t test. (C) Immunoblot analysis of p65 nuclear translocation after subcellular fractionation of resting cells after 6-hour starvation. (C: cytoplasmic fraction; N: nuclear fraction; GAPDH: cytoplasmic fraction loading and purification control; and Nucleoporin/p62: nuclear fraction loading and purification control). For quantitation of nuclear p65 levels, >200 cells were microscopically assessed and analyzed with ImageJ software.

This feature is available to Subscribers Only
Sign In or Create an Account Close Modal