

Key Points
TfrcAlb-Cre mice exhibit low hepatocellular iron and develop mild hypoferremia and microcytosis due to inappropriate hepcidin expression.
Tfr1 is essential for fine-tuning hepcidin responses to hepatocellular iron load but is dispensable for basal iron supply to hepatocytes.

Abstract
Transferrin receptor 1 (Tfr1) mediates uptake of circulating transferrin-bound iron to developing erythroid cells and other cell types. Its critical physiological function is highlighted by the embryonic lethal phenotype of Tfr1-knockout (Tfrc−/−) mice and the pathologies of several tissue-specific knockouts. We generated TfrcAlb-Cre mice bearing hepatocyte-specific ablation of Tfr1 to explore implications in hepatocellular and systemic iron homeostasis. TfrcAlb-Cre mice are viable and do not display any apparent liver pathology. Nevertheless, their liver iron content (LIC) is lower compared with that of control Tfrcfl/fl littermates as a result of the reduced capacity of Tfr1-deficient hepatocytes to internalize iron from transferrin. Even though liver Hamp messenger RNA (mRNA) and serum hepcidin levels do not differ between TfrcAlb-Cre and Tfrcfl/fl mice, Hamp/LIC and hepcidin/LIC ratios are significantly higher in the former. Importantly, this is accompanied by modest hypoferremia and microcytosis, and it predisposes TfrcAlb-Cre mice to iron-deficiency anemia. TfrcAlb-Cre mice appropriately regulate Hamp expression following dietary iron manipulations or holo-transferrin injection. Holo-transferrin also triggers proper induction of Hamp mRNA, ferritin, and Tfr2 in primary TfrcAlb-Cre hepatocytes. We further show that these cells can acquire 59Fe from 59Fe-transferrin, presumably via Tfr2. We conclude that Tfr1 is redundant for basal hepatocellular iron supply but essential for fine-tuning hepcidin responses according to the iron load of hepatocytes. Our data are consistent with an inhibitory function of Tfr1 on iron signaling to hepcidin via its interaction with Hfe. Moreover, they highlight hepatocellular Tfr1 as a link between cellular and systemic iron-regulatory pathways.
Introduction
Iron is a critical cofactor for many biochemical activities. Most mammalian cells acquire iron from plasma transferrin, an iron carrier protein.1,2 Iron-loaded transferrin binds to transferrin receptor 1 (Tfr1) on the cell surface and delivers its cargo to the cytosol via endocytosis. Tfr1 is almost ubiquitously expressed in mammalian tissues and defines the cellular iron gate.3 Its levels are higher in proliferating cells with increased iron demand. Iron deficiency triggers transcriptional induction of Tfr1 via hypoxia-inducible factors and posttranscriptional stabilization of Tfr1 messenger RNA (mRNA) upon binding of iron-regulatory proteins (IRPs) to its iron-responsive elements.4
Tfr1 is essential for erythropoiesis, which consumes the vast majority of body iron.5 Thus, mice with pathologically reduced erythroid Tfr1 expression develop microcytic anemia.6-8 Moreover, Tfrc−/− mice exhibit early embryonic lethality due to defective erythroid and neuronal development.8 Cell-specific inactivation of Tfr1 in dopaminergic neurons,9 lymphocytes,10 enterocytes,11 skeletal muscles,12 or cardiomyocytes13 has been associated with severe pathologies. Interestingly, the critical homeostatic function of Tfr1 in intestinal epithelial cells is independent of iron uptake.11 Evidence for noncanonical functions of Tfr1 has also been obtained in other settings, such as cell survival14 or regulation of mitochondrial morphology.15
The liver stores excesses of body iron but also controls systemic iron homeostasis.16,17 Thus, hepatocytes produce and secrete hepcidin, a peptide hormone that limits iron efflux to the bloodstream.18 Hepcidin operates by binding to the iron exporter ferroportin in target cells, which promotes ferroportin internalization and degradation. Iron triggers transcriptional induction of hepcidin via BMP/SMAD (bone morphogenetic protein/small mothers against decapentaplegic) signaling. Genetic impairment of this pathway leads to hereditary hemochromatosis, an endocrine disorder of iron overload.19
The most common form of hereditary hemochromatosis is associated with mutations in HFE, an atypical major histocompatibility class 1 type molecule. Another form of the disease is caused by mutations in Tfr2, a Tfr1 homolog that is predominantly expressed in hepatocytes and erythroid cells. Tfr2 binds iron-loaded transferrin with 25-fold lower affinity compared with Tfr1 and is not considered an alternative iron entry point3 but rather an iron sensor that coordinately regulates hepcidin expression in hepatocytes and erythropoietin signaling in erythroid progenitors.20-22
HFE physically interacts with Tfr123 at the transferrin binding site,24 which reduces cellular iron uptake.25-27 Experiments in mouse models expressing Tfr1 mutants that prevent or promote the Hfe/Tfr1 interaction provided evidence that Tfr1 limits hepcidin induction by Hfe.28
Herein, we generated mice bearing hepatocyte-specific ablation of Tfr1 to characterize the role of this protein in hepatocellular and systemic iron metabolism.
Methods
Targeting of the murine Tfrc gene and generation of hepatocyte-specific Tfrc−/− mice
For conditional disruption of the murine Tfrc gene, we designed a targeting vector29 to flox (with loxP sites) a 4.1-kb region containing exons 3 and 4 (supplemental Figure 1A, available on the Blood Web site); sequences of the primers used for cloning are provided in supplemental Table 1A. A PGK-neo cassette was also introduced for antibiotic selection. Following transfection of the targeting vector into 129S6/SvEvTac embryonic stem cells, 1 positive clone (out of 500) with correct homologous recombination was identified (supplemental Figure 1B). The clone was expanded, and embryonic stem cells were microinjected into C57BL/6J blastocysts. Chimeric mice were obtained, and germline transmission of the floxed Tfrc allele was achieved by breeding. Subsequently, the Tfrcfl/fl mice were crossed with transgenic mice expressing the FLP recombinase strain to remove the PGK-neo cassette flanked by FRT sites. For disruption of Tfrc in hepatocytes, Tfrcfl/fl mice were crossed with Alb-Cre mice (Charles River Laboratories) expressing the Cre recombinase under control of the albumin promoter. The resulting heterozygous Tfrcwt/fl:Alb-Cre animals were crossed with Tfrcfl/fl mice to obtain homozygous Tfrcfl/fl:Alb-Cre progeny (TfrcAlb-Cre). Polymerase chain reaction (PCR) genotyping from tail genomic DNA was performed using a REDExtract-N-Amp kit (Sigma); the primers used are shown in supplemental Table 1B.
Animal housing
All mice were housed in macrolone cages (up to 5 mice per cage, 12-hour light-dark cycle: 7 am to 7 pm, 22 ± 1°C, 60% ± 5% humidity) and were allowed ad libitum access to chow and drinking water. The mice were fed a standard diet (SD; Teklad Global 18% protein 2918, containing 200 ppm iron) or, when indicated, an iron-deficient diet (IDD; TD.80396, containing 2-6 ppm iron)30 or high-iron diet (HID; TD.09521, containing 2% carbonyl iron).31 Where indicated, the mice received 3 intraperitoneal injections (1 per day) of phenylhydrazine (25 mg/kg) and were analyzed after 2 days of rest. All experiments were performed with TfrcAlb-Cre and Tfrcfl/fl littermates. Male and female mice were analyzed separately. At the end points, the animals were euthanized by CO2 inhalation. Experimental procedures were approved by the Animal Care Committee of McGill University (protocol 4966).
Isolation of primary murine hepatocytes
Primary hepatocytes were isolated from livers of Tfrcfl/fl and TfrcAlb-Cre mice (8-10 weeks old, 22-25 g), as described.32
Serum biochemistry
Blood was collected via cardiac puncture. Hemoglobin concentration, red blood cell count, and mean corpuscular volume (MCV) were determined with a scil Vet-ABC hematology analyzer. Serum was prepared by utilizing micro Z-gel tubes with clotting activator (Sarstedt) and was snap-frozen at −80°C. Serum iron, total iron-binding capacity (TIBC), and ferritin were measured on a Roche Hitachi 917 Chemistry Analyzer. Transferrin saturation was calculated from the ratio of serum iron and TIBC. Serum hepcidin was quantified using an enzyme-linked immunosorbent assay kit (HMC-001; Intrinsic LifeSciences).
Tissue iron quantification
Tissue nonheme iron was quantified using a ferrozine assay.33
Quantitative real-time PCR
Liver RNA was analyzed by quantitative real-time PCR (qPCR)31 ; primers are listed in supplemental Table 1C. Relative mRNA expression was calculated by the comparative Ct method. Data were normalized to ribosomal protein L19 (Rpl19) and reported as fold increases compared with values from control Tfrcfl/fl mice or hepatocytes.
Western blotting
Liver lysates were analyzed by western blotting31 with antibodies against Tfr1 (1:1000 diluted; Invitrogen), Tfr2 (1:1000 diluted; Alpha Diagnostics), ferritin (1:500 diluted; Novus), β-actin (1:2000 diluted; Sigma), phospho-(p)Smad5 (1:1000 diluted; Epitomics), Smad1, pStat3, or Stat3 (1:1000 diluted; Cell Signaling Technology).
Histology and immunohistochemistry
Liver specimens were fixed in 10% buffered formalin and embedded in paraffin. Tissue architecture was analyzed by staining with hematoxylin and eosin. Nonheme iron deposits were visualized by Perls staining. Expression of Tfr1 was detected by immunohistochemistry.34 OCT-frozen liver sections (30 μm) were used for intracellular localization of Tfr1 with EEA1 and Tfr2 with Rab7. Staining was performed with 1:300 diluted mouse Tfr1 (Invitrogen) and 1:200 diluted rabbit EEA1 (Cell Signaling Technology) antibodies or with 1:200 diluted rabbit Tfr2 (Alpha Diagnostics) and mouse Rab7 (Sigma) antibodies, respectively. Secondary antibodies (Chemicon) were labeled with Alexa Fluor 488 or Cy3. DAPI (1 μg/mL) was added together with the primary antibody. Immunofluorescence images were obtained using a Leica SP8 confocal microscope with a 63× NA 1.4 objective.
Transmission electron microscopy
Liver sections were prepared for ultrastructural studies and analyzed by transmission electron microscopy.35
59Fe-transferrin uptake
59FeCl3 (PerkinElmer) was used to load apo-transferrin.36 59Fe-transferrin was purified on a Zeba Spin Desalting Columns 7K MWCO (Thermo Fisher Scientific). Mice were injected intraperitoneally with 50 μL containing 1.5 × 10⁶ cpm (2.975 nmol) 59Fe-transferrin. At the end point, the animals were sacrificed, and blood was collected by cardiac puncture. Subsequently, residual blood was removed from tissues by perfusion with 20 mL of ice-cold phosphate buffered saline, and tissues were dissected and analyzed for 59Fe radioactivity in a gamma counter. In vitro, primary murine hepatocytes (∼3 × 10⁵) were incubated in 6-well plates with 5 μL (1.5 × 10⁵ cpm; 0.2975 nmol) of 59Fe-transferrin for 24 hours, and 59Fe uptake was analyzed as described.37
Statistical analysis
Statistical analysis was performed using Prism GraphPad software (version 7.0d). Pairwise comparisons were performed with the unpaired Student t test. Multiple groups were subjected to analysis of variance (ANOVA) with Bonferroni post hoc test comparison. A P value < .05 was considered statistically significant.
Results
TfrcAlb-Cre mice bear hepatocyte-specific ablation of Tfr1
Livers from TfrcAlb-Cre and Tfrcfl/fl mice were analyzed biochemically and histologically for Tfr1 expression. Tfr1 mRNA and protein levels were diminished in whole livers of TfrcAlb-Cre animals; there was no compensatory induction of Tfr2, but ferritin content was decreased (Figure 1A-B). The immunohistochemical data in Figure 1C-D show a complete absence of Tfr1 in TfrcAlb-Cre hepatocytes. As expected, control Tfrcfl/fl hepatocytes exhibit robust Tfr1 expression, with the Tfr1 signal predominating on the plasma membrane (Figure 1C) but also detectable in endosomes, where it colocalizes with the early endosome marker EEA1 (Figure 1D, arrowheads). Tfr1 expression is retained in nonparenchymal liver cells of TfrcAlb-Cre mice (Figure 1C, arrows), in line with the observed residual Tfr1 mRNA (Figure 1A) and protein (Figure 1B). These data demonstrate efficient disruption of Tfr1 in hepatocytes from TfrcAlb-Cre mice.

Efficient hepatocyte-specific ablation of Tfr1 in TfrcAlb-Cremice. Livers from 8-week-old female and male TfrcAlb-Cre mice and control Tfrcfl/fl littermates (n = 10 for each group) were used for biochemical and histological assessment of Tfr1 expression. (A) qPCR analysis of Tfr1 mRNA. Data are mean ± standard error of the mean. (B) Western blot analysis of Tfr1. (C) Immunohistochemical detection of Tfr1; arrows denote Tfr1 expression in nonparenchymal liver cells. Scale bars, 200 μm (upper panels), 100 μm (lower panels); original magnification ×10 and ×20. (D) Immunofluorescence detection of Tfr1 and the early endosome marker EEA1; colocalization is shown by the white arrowheads. Scale bar, 2 μm; original magnification ×63. Statistical analysis was done using 2-way ANOVA.
Efficient hepatocyte-specific ablation of Tfr1 in TfrcAlb-Cremice. Livers from 8-week-old female and male TfrcAlb-Cre mice and control Tfrcfl/fl littermates (n = 10 for each group) were used for biochemical and histological assessment of Tfr1 expression. (A) qPCR analysis of Tfr1 mRNA. Data are mean ± standard error of the mean. (B) Western blot analysis of Tfr1. (C) Immunohistochemical detection of Tfr1; arrows denote Tfr1 expression in nonparenchymal liver cells. Scale bars, 200 μm (upper panels), 100 μm (lower panels); original magnification ×10 and ×20. (D) Immunofluorescence detection of Tfr1 and the early endosome marker EEA1; colocalization is shown by the white arrowheads. Scale bar, 2 μm; original magnification ×63. Statistical analysis was done using 2-way ANOVA.
TfrcAlb-Cre mice develop modest hypoferremia and microcytosis associated with reduced LIC and inappropriate hepcidin expression
We assessed the physiological implications of hepatocellular Tfr1 deficiency in female and male TfrcAlb-Cre mice and control Tfrcfl/fl littermates. Hemoglobin (Figure 2A) and red blood cells (Figure 2B) appeared slightly reduced in TfrcAlb-Cre mice, but the values did not reach statistical significance. Nevertheless, TfrcAlb-Cre mice developed significant, albeit modest, microcytosis (Figure 2C), with a decrease in MCV reaching 4% in females (P < .001) and 3% in males (P < .05). Likewise, TfrcAlb-Cre mice exhibited significant hypoferremia, with ∼25% decreased (P < .001) serum iron (Figure 2D) and transferrin saturation (Figure 2F) in both sexes.
![Figure 2. TfrcAlb-Cre mice dysregulate hepcidin expression and develop mild hypoferremia and microcytosis. Eight-week-old female and male TfrcAlb-Cre mice and control Tfrcfl/fl littermates (n = 10 for each group) were euthanized. Blood was isolated by cardiac puncture and used to analyze hemoglobin (A), red blood cell count (B), and MCV (C). Sera were prepared for analysis of iron (D), TIBC (E), transferrin saturation (F), ferritin (G), and hepcidin (J). Livers were dissected and used to analyze LIC (H) and Hamp mRNA (I). Values for Hamp mRNA, serum hepcidin, and LIC were used to calculate Hamp/LIC (K) and hepcidin/LIC (L) ratios. All data are mean ± standard error of the mean. Statistically significant differences across genotypes are indicated by P values (or ns [nonsignificant]) and across sexes by ***P < .001, 2-way ANOVA.](https://ash.silverchair-cdn.com/ash/content_public/journal/blood/133/4/10.1182_blood-2018-05-850404/3/m_blood850404f2.png?Expires=1767725010&Signature=3mWZYQR33ajwQbHZa~e62JgsWH5szL6LspxNhj5LsJJeYXOTnktsq75VQjf8MxMLP6wbZb9xZS6MigS-wKmqlqY3yPlMoTMPKfZ28E69AoyscR4VlZWs0RwuaxqTWlniUbyPp8qgPefFx~3-It~hc4Lz46SVsGC3K39SXcCHYHG14Iu71XY0cmkkW5A5rUbc-aWOHR4i1pSrE50shqtrDN0gfE9URMeYyJSu7a1lFE-t0KSJTRqhsyizc5s9igT~U20xth23LldJdRqlW9XB3KlNu9jGAhRBjd-~mlHMqmKecDGfx2AANcIQbMTJJg5fWz6yljWbZRm3YBoTz2ME6A__&Key-Pair-Id=APKAIE5G5CRDK6RD3PGA)
TfrcAlb-Cremice dysregulate hepcidin expression and develop mild hypoferremia and microcytosis. Eight-week-old female and male TfrcAlb-Cre mice and control Tfrcfl/fl littermates (n = 10 for each group) were euthanized. Blood was isolated by cardiac puncture and used to analyze hemoglobin (A), red blood cell count (B), and MCV (C). Sera were prepared for analysis of iron (D), TIBC (E), transferrin saturation (F), ferritin (G), and hepcidin (J). Livers were dissected and used to analyze LIC (H) and Hamp mRNA (I). Values for Hamp mRNA, serum hepcidin, and LIC were used to calculate Hamp/LIC (K) and hepcidin/LIC (L) ratios. All data are mean ± standard error of the mean. Statistically significant differences across genotypes are indicated by P values (or ns [nonsignificant]) and across sexes by ***P < .001, 2-way ANOVA.
TfrcAlb-Cremice dysregulate hepcidin expression and develop mild hypoferremia and microcytosis. Eight-week-old female and male TfrcAlb-Cre mice and control Tfrcfl/fl littermates (n = 10 for each group) were euthanized. Blood was isolated by cardiac puncture and used to analyze hemoglobin (A), red blood cell count (B), and MCV (C). Sera were prepared for analysis of iron (D), TIBC (E), transferrin saturation (F), ferritin (G), and hepcidin (J). Livers were dissected and used to analyze LIC (H) and Hamp mRNA (I). Values for Hamp mRNA, serum hepcidin, and LIC were used to calculate Hamp/LIC (K) and hepcidin/LIC (L) ratios. All data are mean ± standard error of the mean. Statistically significant differences across genotypes are indicated by P values (or ns [nonsignificant]) and across sexes by ***P < .001, 2-way ANOVA.
Serum ferritin, a biomarker of LIC, was reduced by ∼20% (P < .05) in all TfrcAlb-Cre mice (Figure 2G). The decrease in LIC was more profound and reached ∼50% (P < .001) in TfrcAlb-Cre mice (Figure 2H); the overall LIC levels were lower in males of the same genotype, in agreement with earlier observations.38 Liver Hamp mRNA expression (Figure 2I) and serum hepcidin levels (Figure 2J) were lower in males, as previously described,38 but they did not differ among the genotypes. However, when normalized to LIC, Hamp mRNA (Figure 2K) and serum hepcidin (Figure 2L) were significantly elevated in TfrcAlb-Cre mice by ∼2.5-fold (P < .01) and ∼2-fold (P < .001), respectively. Thus, TfrcAlb-Cre mice present with reduced LIC and serum iron and, moreover, fail to adjust hepcidin expression accordingly.
Dysregulation of hepcidin predisposes TfrcAlb-Cre mice to iron-deficiency anemia
To compare responses to iron deficiency, 12-week-old TfrcAlb-Cre and Tfrcfl/fl mice were placed on an iron-deficient diet and analyzed after 12 weeks (Figure 3; dashed lines indicate values from sex- and age-matched control Tfrcfl/fl mice on an SD). This promoted a drastic reduction in serum iron and transferrin saturation in both genotypes, yet the values remained significantly lower (P < .01) in TfrcAlb-Cre mice (Figure 3A-C). Serum ferritin and LIC were likewise reduced but equalized among genotypes (Figure 3D-E). Hamp mRNA expression was undetectable in Tfrcfl/fl livers but persisted in TfrcAlb-Cre livers (Figure 3F-G). Under these experimental conditions, TfrcAlb-Cre mice, but not Tfrcfl/fl mice, developed anemia, which was reflected in significant drops in hemoglobin (17%; P < .05), hematocrit (18%; P < .05), and MCV (13%; P < .05) (Figure 3I-L). Young wild-type mice typically develop anemia within 4 to 7 weeks if placed on an iron-deficient diet directly after weaning30 ; thus, it appears that the older Tfrcfl/fl mice were protected by their higher iron stores. Considering that LIC was equalized between Tfrcfl/fl and TfrcAlb-Cre mice at the end point, these data suggest that hepcidin dysregulation due to hepatocellular Tfr1 ablation potentiates iron restriction in TfrcAlb-Cre mice and renders them susceptible to iron-deficiency anemia.

TfrcAlb-Cremice are predisposed to iron-deficiency anemia. Twelve-week-old male TfrcAlb-Cre mice and control Tfrcfl/fl littermates (n = 4-6 for each genotype) were placed on an IDD for 12 weeks. At the end point, the animals were euthanized. Blood was isolated by cardiac puncture and used for hematological analysis. Serum was prepared, and livers were dissected to analyze iron parameters. (A) Serum iron. (B) TIBC. (C) Transferrin saturation. (D) Serum ferritin. (E) LIC. (F) Liver Hamp mRNA. (G) Liver Hamp/LIC ratios. (H) Liver Tfr1 mRNA. (I) Hemoglobin. (J) Hematocrit. (K) Red blood cell count. (L) MCV. Data are mean ± standard error of the mean. Dashed lines indicate average values obtained from age-matched male C57BL/6 mice on an SD (n = 3). Statistical analysis was performed using the Student t test.
TfrcAlb-Cremice are predisposed to iron-deficiency anemia. Twelve-week-old male TfrcAlb-Cre mice and control Tfrcfl/fl littermates (n = 4-6 for each genotype) were placed on an IDD for 12 weeks. At the end point, the animals were euthanized. Blood was isolated by cardiac puncture and used for hematological analysis. Serum was prepared, and livers were dissected to analyze iron parameters. (A) Serum iron. (B) TIBC. (C) Transferrin saturation. (D) Serum ferritin. (E) LIC. (F) Liver Hamp mRNA. (G) Liver Hamp/LIC ratios. (H) Liver Tfr1 mRNA. (I) Hemoglobin. (J) Hematocrit. (K) Red blood cell count. (L) MCV. Data are mean ± standard error of the mean. Dashed lines indicate average values obtained from age-matched male C57BL/6 mice on an SD (n = 3). Statistical analysis was performed using the Student t test.
We also evaluated the responses of TfrcAlb-Cre and Tfrcfl/fl mice to phenylhydrazine, a drug that causes hemolytic anemia. Phenylhydrazine treatment led to significant reductions in serum iron, hemoglobin, hematocrit, red blood cells, MCV, and Hamp mRNA in both genotypes (supplemental Figure 2). Importantly, there was no significant difference in Hamp mRNA suppression between TfrcAlb-Cre and Tfrcfl/fl mice (supplemental Figure 2I), which promoted a similar increase in LIC (supplemental Figure 2J). Extramedullary erythropoiesis is another possible contributor to increased LIC in phenylhydrazine-treated animals. It is reflected in the robust Tfr1 mRNA induction in TfrcAlb-Cre and Tfrcfl/fl livers (supplemental Figure 2K), presumably due to the recruitment of erythropoietic cells.
Tfr1 deficiency reduces, but does not abrogate, uptake of transferrin-bound iron by hepatocytes
In light of the low LIC of TfrcAlb-Cre mice, we examined whether these animals can assimilate transferrin-bound iron in the liver. To this end, male TfrcAlb-Cre and Tfrcfl/fl mice were injected intraperitoneally with 59Fe-transferrin; 6 hours later, the mice were euthanized, and tissues were analyzed for 59Fe distribution. Compared with controls, TfrcAlb-Cre mice internalized ∼40% less 59Fe in the liver (P < .001) and accumulated ∼30% more 59Fe in the blood (Figure 4A). There was no difference in 59Fe uptake in the spleen, kidney, and heart. Similar results were obtained when the animals were previously placed on an iron-deficient diet for 4 weeks (supplemental Figure 3). These data indicate that hepatocellular Tfr1 ablation reduces, but does not abolish, the acquisition of transferrin-bound iron in the liver.
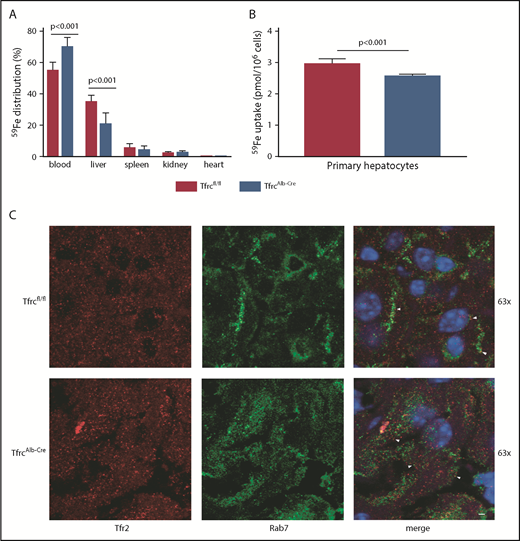
Tfr1 is not the main contributor to hepatocellular iron uptake. (A) Twelve-week-old male TfrcAlb-Cre mice and control Tfrcfl/fl littermates (n = 8 for each genotype) were injected intraperitoneally with 59Fe-transferrin. Six hours later, the animals were sacrificed. Blood was collected, and tissues were dissected following perfusion with phosphate buffered saline to remove residual blood. The distribution of 59Fe radioactivity was analyzed in a gamma counter. (B) Primary hepatocytes isolated from TfrcAlb-Cre mice and control Tfrcfl/fl mice were incubated with 59Fe-transferrin for 24 hours. Cell-associated radioactivity was measured in a gamma counter. Data in (A-B) are mean ± standard error of the mean. Statistical analysis was performed using 2-way ANOVA (A) and the Student t test (B). (C) Immunofluorescence detection of Tfr2 and the late endosome marker Rab7; colocalization is shown by the white arrowheads. Scale bar, 2 μm; original magnification ×63.
Tfr1 is not the main contributor to hepatocellular iron uptake. (A) Twelve-week-old male TfrcAlb-Cre mice and control Tfrcfl/fl littermates (n = 8 for each genotype) were injected intraperitoneally with 59Fe-transferrin. Six hours later, the animals were sacrificed. Blood was collected, and tissues were dissected following perfusion with phosphate buffered saline to remove residual blood. The distribution of 59Fe radioactivity was analyzed in a gamma counter. (B) Primary hepatocytes isolated from TfrcAlb-Cre mice and control Tfrcfl/fl mice were incubated with 59Fe-transferrin for 24 hours. Cell-associated radioactivity was measured in a gamma counter. Data in (A-B) are mean ± standard error of the mean. Statistical analysis was performed using 2-way ANOVA (A) and the Student t test (B). (C) Immunofluorescence detection of Tfr2 and the late endosome marker Rab7; colocalization is shown by the white arrowheads. Scale bar, 2 μm; original magnification ×63.
Next, primary hepatocytes from TfrcAlb-Cre and Tfrcfl/fl mice were incubated with 59Fe-transferrin and analyzed for 59Fe uptake after 24 hours. This led to 59Fe acquisition by wild-type and Tfr1-deficient hepatocytes, even though the latter exhibited ∼15% reduced capacity (Figure 4B). Our findings raise the possibility of a critical role for Tfr2 in hepatocellular iron supply. Supportive evidence is provided by the colocalization of Tfr2 with the late endosome marker Rab7 in livers of TfrcAlb-Cre and Tfrcfl/fl mice (Figure 4C, arrowheads).
Livers of TfrcAlb-Cre mice lack histopathological features
We investigated whether the reduced LIC in TfrcAlb-Cre mice was associated with altered tissue architecture. To enhance potential pathology, groups of male TfrcAlb-Cre and Tfrcfl/fl mice were previously fed an IDD or an HID for 4 weeks. However, histopathological analysis of livers (and spleens) did not reveal any abnormalities or differences between the genotypes, irrespective of iron content, whereas the distribution of visible iron deposits was similar between TfrcAlb-Cre and Tfrcfl/fl mice (supplemental Figure 4). Ultrastructural studies validated the lack of apparent pathology in livers of iron-deficient TfrcAlb-Cre mice (supplemental Figure 5), in spite of low LIC (supplemental Figure 7E). Thus, all hepatocytes displayed physiological architecture with appropriate content and morphology in mitochondria, lipid droplets, and glycogen granules.
TfrcAlb-Cre and Tfrcfl/fl mice had similar body weight, which was not affected by dietary iron manipulations (supplemental Figure 6A). Hepatocellular Tfr1 ablation did not significantly affect the weight of the liver, spleen, heart, or kidney (supplemental Figure 6B-E) or the iron content of the heart or kidney (supplemental Figure 6G-H). However, it led to significant (P < .05) decreases in LIC (supplemental Figure 7E) and splenic iron content (supplemental Figure 6F).
TfrcAlb-Cre mice exhibit appropriate responses to dietary iron challenges
Having established that TfrcAlb-Cre mice fail to adjust hepcidin expression to low LIC, we examined how they respond to further dietary iron manipulations (Figure 5). To analyze mid-term responses, male TfrcAlb-Cre and Tfrcfl/fl mice received an SD or an IDD for 5 days or an HID for 7 days. To analyze acute responses, the animals previously on an IDD were exposed to an HID for 3 or 6 hours. Conversely, the animals on an HID were switched to an IDD for 24 hours.
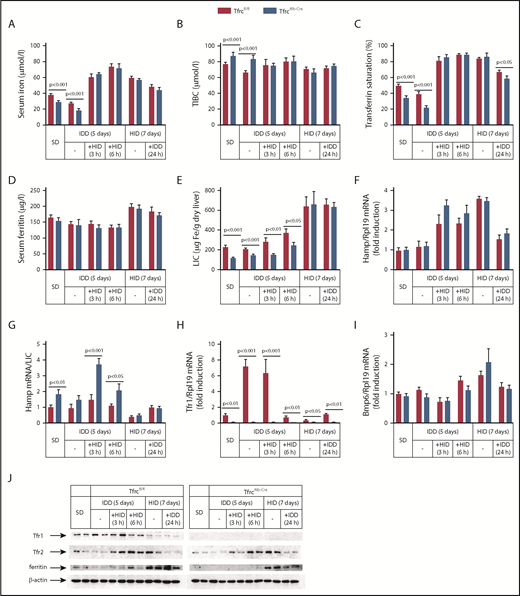
TfrcAlb-Cremice respond appropriately to dietary iron challenges. Eight-week-old male TfrcAlb-Cre mice and control Tfrcfl/fl littermates (n = 30 for each genotype; n = 5 for each treatment) were placed on an SD or an IDD for 5 days or an HID for 7 days. On the last day of the IDD, mice remained on this diet or were switched to an HID for 3 or 6 hours. On the last day of the HID, mice remained on this diet or were switched to an IDD for 24 hours. Sera were prepared for the analysis of iron (A), TIBC (B), transferrin saturation (C), and ferritin (D). Livers were dissected and used to analyze LIC (E), Hamp mRNA (F), Hamp/LIC ratios (G), Tfr1 mRNA (H), and Bmp6 mRNA (I). (J) Liver lysates were used for western blot analysis of Tfr1, Tfr2, ferritin, and β-actin. All data are mean ± standard error of the mean. Statistical analysis was performed using multiple t tests.
TfrcAlb-Cremice respond appropriately to dietary iron challenges. Eight-week-old male TfrcAlb-Cre mice and control Tfrcfl/fl littermates (n = 30 for each genotype; n = 5 for each treatment) were placed on an SD or an IDD for 5 days or an HID for 7 days. On the last day of the IDD, mice remained on this diet or were switched to an HID for 3 or 6 hours. On the last day of the HID, mice remained on this diet or were switched to an IDD for 24 hours. Sera were prepared for the analysis of iron (A), TIBC (B), transferrin saturation (C), and ferritin (D). Livers were dissected and used to analyze LIC (E), Hamp mRNA (F), Hamp/LIC ratios (G), Tfr1 mRNA (H), and Bmp6 mRNA (I). (J) Liver lysates were used for western blot analysis of Tfr1, Tfr2, ferritin, and β-actin. All data are mean ± standard error of the mean. Statistical analysis was performed using multiple t tests.
IDD intake for 5 days proportionally reduced serum iron (Figure 5A) and transferrin saturation (Figure 5C) in TfrcAlb-Cre and Tfrcfl/fl mice but did not significantly affect Hamp mRNA, LIC, and Hamp/LIC ratios (Figure 5E-G), presumably due to the relatively short time frame of the experiment. Nevertheless, liver Tfr1 mRNA was profoundly induced in Tfrcfl/fl mice under these conditions (Figure 5H), whereas Tfr1 protein levels were slightly elevated (Figure 5J). Interestingly, TfrcAlb-Cre mice appropriately increased serum iron (Figure 5A), transferrin saturation (Figure 5C), and Hamp mRNA (Figure 5F) following acute dietary iron loading by switching from an IDD to an HID, similar to Tfrcfl/fl controls. The Hamp mRNA response appeared more potent at the early time point (3 hours), as illustrated in the dramatically increased Hamp/LIC ratio of TfrcAlb-Cre mice, which was >2-fold higher compared with that of Tfrcfl/fl controls (Figure 5G). Notably, Tfr1 mRNA and protein levels were only suppressed after a 6-hour exposure of the animals to an HID (Figure 5H,J).
Likewise, TfrcAlb-Cre mice mounted appropriate responses to dietary iron loading. Thus, an HID for 7 days triggered proportional increases in serum iron (Figure 5A), transferrin saturation (Figure 5C), serum ferritin (Figure 5D), LIC (Figure 5E), Hamp mRNA (Figure 5F), and Bmp6 mRNA (Figure 5I) in TfrcAlb-Cre and Tfrcfl/fl mice. Conversely, the opposite responses were observed for serum iron, transferrin saturation, Hamp mRNA, and Bmp6 mRNA following the switch from an HID to an IDD for 24 hours, whereas, as expected,39 serum ferritin and LIC remained unaffected. It should be noted that iron loading was associated with similar induction of Tfr2 in both genotypes (Figure 5J), apparently due to the known Tfr2 stabilization by holo-transferrin.40,41 We conclude that hepatocellular Tfr1 deficiency does not impair the capacity of TfrcAlb-Cre mice to regulate hepcidin in response to dietary iron challenges. This conclusion is further validated by the proper regulation of hepcidin in TfrcAlb-Cre mice on prolonged IDD or HID regimens (supplemental Figure 7F).
TfrcAlb-Cre mice exhibit appropriate responses to holo-transferrin
Acute and chronic iron loading are thought to induce hepcidin by distinct mechanisms involving increased iron saturation of transferrin or iron-dependent secretion of Bmp6, respectively.39,42 We directly evaluated the responses of TfrcAlb-Cre mice to transferrin (Figure 6). Thus, female TfrcAlb-Cre and Tfrcfl/fl mice, previously fed an IDD for 5 days, were injected IV with apo- or holo-transferrin and euthanized after 5 hours. Holo-transferrin promoted a dramatic almost threefold increase in serum iron (Figure 6A) and transferrin saturation (Figure 6C) in both genotypes, without affecting serum ferritin (Figure 6D) or LIC (Figure 6E). Expectedly, TIBC was increased by apo- and holo-transferrin (Figure 6B, compare with Figure 2E). Importantly, holo-transferrin, but not apo-transferrin, triggered a modest (∼0.25-fold), but significant (P < .05), induction of Hamp mRNA (Figure 6F) that did not differ quantitatively between the genotypes. Hamp/LIC ratios remained significantly higher in TfrcAlb-Cre mice (Figure 6G). Five-hour treatment with apo- or holo-transferrin did not alter the expression of liver Tfr1 in Tfrcfl/fl mice (Figure 6H) or the expression of Bmp6 (Figure 6I) or Id1 (marker of Bmp/Smad signaling; Figure 6J) in either genotype. These results indicate that the hepcidin response to holo-transferrin is preserved in TfrcAlb-Cre mice.

TfrcAlb-Cremice respond appropriately to holo-transferrin. Eight-week-old female TfrcAlb-Cre mice and control Tfrcfl/fl littermates (n = 10 for each genotype; n = 5 for each treatment) were injected IV with 10 mg of human apo- or holo-transferrin. The animals were euthanized 5 hours later. Sera were prepared for analysis of iron (A), TIBC (B), transferrin saturation (C), and ferritin (D). Livers were dissected and used to analyze LIC (E), Hamp mRNA (F), Hamp/LIC ratios (G), Tfr1 mRNA (H), Bmp6 mRNA (I), and Id1 mRNA (J). All data are mean ± standard error of the mean. Statistically significant differences across genotypes are indicated by P values and across treatment (apo- vs holo-transferrin) by *P < .05 or ***P < .001, 2-way ANOVA.
TfrcAlb-Cremice respond appropriately to holo-transferrin. Eight-week-old female TfrcAlb-Cre mice and control Tfrcfl/fl littermates (n = 10 for each genotype; n = 5 for each treatment) were injected IV with 10 mg of human apo- or holo-transferrin. The animals were euthanized 5 hours later. Sera were prepared for analysis of iron (A), TIBC (B), transferrin saturation (C), and ferritin (D). Livers were dissected and used to analyze LIC (E), Hamp mRNA (F), Hamp/LIC ratios (G), Tfr1 mRNA (H), Bmp6 mRNA (I), and Id1 mRNA (J). All data are mean ± standard error of the mean. Statistically significant differences across genotypes are indicated by P values and across treatment (apo- vs holo-transferrin) by *P < .05 or ***P < .001, 2-way ANOVA.
Holo-transferrin promotes hepcidin induction in primary TfrcAlb-Cre hepatocytes
Holo-transferrin is known to induce Hamp mRNA in primary hepatocyte cultures.43 Therefore, we isolated primary hepatocytes from TfrcAlb-Cre and Tfrcfl/fl mice to examine whether hepatocellular Tfr1 deficiency affects Hamp mRNA induction by holo-transferrin in vitro. Administration of holo-transferrin triggered an ∼3-fold induction of Hamp mRNA in TfrcAlb-Cre and Tfrcfl/fl hepatocytes (Figure 7A), which was associated with increased Tfr2 expression (Figure 7B). Importantly, this treatment also stimulated the induction of ferritin in both genotypes, corroborating that holo-transferrin is an efficient iron source even for hepatocytes lacking Tfr1. As expected, apo-transferrin did not affect Hamp mRNA, Tfr2, or ferritin expression in control Tfrcfl/fl hepatocytes. Nevertheless, we noted that it induced Hamp mRNA and Tfr2 expression in TfrcAlb-Cre hepatocytes; the reason for this is unclear. Apo- and holo-transferrin did not affect pSmad5 levels in either genotype. pStat3 levels appeared slightly decreased in TfrcAlb-Cre livers, but Il6 mRNA did not differ significantly between the genotypes or in response to treatment (Figure 7C). These findings suggest that the lack of Tfr1 does not impair the capacity of hepatocytes to induce Hamp mRNA by holo-transferrin and validate that Tfr1-deficient hepatocytes can assimilate transferrin-bound iron.
![Figure 7. Holo-transferrin triggers induction of hepcidin, Tfr2, and ferritin in TfrcAlb-Cre and Tfrcfl/fl hepatocytes. Primary hepatocytes were isolated from livers of TfrcAlb-Cre mice and control Tfrcfl/fl mice. The cells were cultured in serum-free media and left untreated or treated overnight with 30 μM apo- or holo-transferrin. At the end point, the cells were harvested and used for preparation of RNA and protein lysates. (A) qPCR analysis of Hamp mRNA. (B) Western blot analysis of Tfr1, Tfr2, ferritin, β-actin, pSmad5, Smad1, pStat3, and Stat3. (C) qPCR analysis of Il6 mRNA. Data in (A) and (C) are mean ± standard error of the mean. Statistically significant differences across genotypes are indicated by P values (or ns [nonsignificant]) and across treatment (no treatment vs apo- or holo-transferrin) by ***P < .001, 2-way ANOVA.](https://ash.silverchair-cdn.com/ash/content_public/journal/blood/133/4/10.1182_blood-2018-05-850404/3/m_blood850404f7.png?Expires=1767725010&Signature=tUTTzsSMxSe9n3vl8EnSZj83fGO8h~U8TVYqU0Kd7mAXf9gP~brL8uPYRmG3MNg4bK20LJpcEhmrOUQ3-cDJrD8saOqLGLFBLUaYRcbc48xVPfI95yLvSErq01yY8f8FFJ8RMAc0ozWyjBAllUNqiqqye8HFIS99gC6gtGviVon1l4qcmZiy5ub77QXdOQ1dc6z0otV-y4Y6VPTITFUio-jh7lxHO44~tePnrXmUJwgFsCZN6gYxKze2qfmy96LXnmMwzgtNXN6O8hpbSEt7ox0MHq-tUIF90rmcoP8ixq1XqUJPKUMJY1QReEO8EcaCbVU7oElD0Zv-HH8QY~zT4w__&Key-Pair-Id=APKAIE5G5CRDK6RD3PGA)
Holo-transferrin triggers induction of hepcidin, Tfr2, and ferritin in TfrcAlb-Creand Tfrcfl/flhepatocytes. Primary hepatocytes were isolated from livers of TfrcAlb-Cre mice and control Tfrcfl/fl mice. The cells were cultured in serum-free media and left untreated or treated overnight with 30 μM apo- or holo-transferrin. At the end point, the cells were harvested and used for preparation of RNA and protein lysates. (A) qPCR analysis of Hamp mRNA. (B) Western blot analysis of Tfr1, Tfr2, ferritin, β-actin, pSmad5, Smad1, pStat3, and Stat3. (C) qPCR analysis of Il6 mRNA. Data in (A) and (C) are mean ± standard error of the mean. Statistically significant differences across genotypes are indicated by P values (or ns [nonsignificant]) and across treatment (no treatment vs apo- or holo-transferrin) by ***P < .001, 2-way ANOVA.
Holo-transferrin triggers induction of hepcidin, Tfr2, and ferritin in TfrcAlb-Creand Tfrcfl/flhepatocytes. Primary hepatocytes were isolated from livers of TfrcAlb-Cre mice and control Tfrcfl/fl mice. The cells were cultured in serum-free media and left untreated or treated overnight with 30 μM apo- or holo-transferrin. At the end point, the cells were harvested and used for preparation of RNA and protein lysates. (A) qPCR analysis of Hamp mRNA. (B) Western blot analysis of Tfr1, Tfr2, ferritin, β-actin, pSmad5, Smad1, pStat3, and Stat3. (C) qPCR analysis of Il6 mRNA. Data in (A) and (C) are mean ± standard error of the mean. Statistically significant differences across genotypes are indicated by P values (or ns [nonsignificant]) and across treatment (no treatment vs apo- or holo-transferrin) by ***P < .001, 2-way ANOVA.
Discussion
We show that TfrcAlb-Cre mice lack any Tfr1 expression in hepatocytes and present with ∼50% reduced LIC compared with control Tfrcfl/fl littermates, which is also reflected in lower serum and liver ferritin (Figures 1-2). However, this does not cause any apparent liver pathology, even under conditions of prolonged dietary iron manipulations. Thus, TfrcAlb-Cre mice exhibit physiological liver architecture (supplemental Figure 4) with normal ultrastructural morphology of hepatocytes (supplemental Figure 5). These data suggest that Tfr1 contributes to LIC but is redundant for the minimal hepatocellular iron supply that is required to maintain physiological functions. We speculate that Tfr1 may account for the buildup of an iron reservoir in hepatocytes, which can be mobilized for systemic iron needs under iron starvation.44 Nevertheless, the metabolic iron requirements of hepatocytes appear to be fully covered by Tfr1-independent mechanisms.
We explored whether Tfr1-deficient hepatocytes can acquire transferrin-bound iron or possibly depend on inorganic iron transporters, such as Zip14 or Dmt1.45,46 Injection of TfrcAlb-Cre mice with 59Fe-transferrin resulted in substantial internalization of 59Fe in the liver (Figure 4A; supplemental Figure 3). Considering that hepatocytes make up 70% to 85% of the liver’s mass, these data are consistent with 59Fe uptake by TfrcAlb-Cre hepatocytes. Direct evidence is provided by the in vitro 59Fe-transferrin–uptake experiment in cultured primary hepatocytes; the data in Figure 4B demonstrate that Tfr1-deficient hepatocytes indeed internalize transferrin-bound iron, yet somehow less efficiently. Corroborative evidence is provided by the induction of ferritin in primary TfrcAlb-Cre hepatocytes following treatment with holo-transferrin (Figure 7B), considering that cellular iron derepresses ferritin mRNA translation via inactivation of IRPs.4
Our data are consistent with an iron-uptake function of Tfr2 that is apparently not restricted to Tfr1-deficient hepatocytes. Thus, the detection of Tfr2 in endosomes from TfrcAlb-Cre and Tfrcfl/fl hepatocytes (Figure 4C), which exhibit only small differences in 59Fe uptake capacity (Figure 4B), raises the possibility of a contribution of this protein in canonical hepatocellular iron acquisition. This is in line with older findings reporting Tfr1-independent uptake of transferrin-bound iron in Huh7 hepatoma cells,47 as well as with a proposed Tfr2-mediated iron-delivery pathway from lysosomes to mitochondria in erythroid cells.48 Nonetheless, more work is required to clarify the iron-trafficking function of Tfr2 in hepatocytes, whereas the potential contribution of moonlighting receptors for transferrin49,50 cannot be formally excluded.
The main pathological features of TfrcAlb-Cre mice are modest hypoferremia and microcytosis (Figure 2). Moreover, the animals are sensitized to develop anemia following prolonged dietary iron restriction (Figure 3). These pathologies are caused by a failure to adjust hepcidin expression to low LIC, as illustrated by the supraphysiological Hamp/LIC and hepcidin/LIC ratios. The LIC controls hepcidin via iron-dependent secretion of Bmp6 from liver sinusoidal endothelial cells,51 which activates the Smad signaling cascade and leads to Hamp mRNA transcription in hepatocytes.18 Livers of TfrcAlb-Cre and Tfrcfl/fl mice express similar levels of Bmp6 mRNA (Figures 5I and 6I), excluding a defective paracrine response to LIC in the former.
Bmp/Smad signaling in hepatocytes is optimized with the aid of auxiliary factors, such as Hfe, Tfr2 and Hjv; global or hepatocyte-specific disruption of any of these proteins impairs hepcidin expression and causes hemochromatosis.18 The effects of Hfe inactivation are relatively mild. Thus, Hfe−/− mice express almost physiological Hamp mRNA levels but exhibit inappropriately low Hamp/LIC ratios.31 Because Hfe physically interacts with Tfr1,23 restraining its iron-signaling function,28 our data suggest that the high Hamp/LIC ratios in TfrcAlb-Cre mice are triggered by unrestricted Hfe activity. We propose that hepatocellular Tfr1 primarily exerts a systemic iron-regulatory function by fine-tuning Hfe-mediated iron signaling to hepcidin, according to the iron content of hepatocytes. Along these lines, in iron-deficient hepatocytes, Tfr1 will be induced transcriptionally by hypoxia-inducible factors and posttranscriptionally by IRPs to interact with Hfe and limit its contribution to Bmp/Smad signaling to hepcidin. Conversely, in iron-loaded hepatocytes, Tfr1 expression will be suppressed because inactive IRPs no longer protect the labile Tfr1 mRNA, and this will allow Hfe to exert its stimulatory effects on Bmp/Smad signaling to hepcidin. This model is supported by the normalization of Hamp/LIC ratios in TfrcAlb-Cre and control Tfrcfl/fl mice after feeding with an iron-rich diet, as a result of Tfr1 suppression in Tfrcfl/fl livers (Figure 5G; supplemental Figure 7G). Hence, Tfr1 provides a link between cellular and systemic iron-regulatory mechanisms.
TfrcAlb-Cre mice exhibit appropriate responses to acute, midterm, or chronic dietary iron challenges (Figure 5; supplemental Figure 7), as well as to injection of holo-transferrin (Figure 6). These results appear to exclude a role for hepatocellular Tfr1 as a direct iron sensor, contrary to Tfr2.52 Nevertheless, Tfr1 is an integral part of the IRP-governed iron-sensing system of hepatocytes, which eventually fine-tunes systemic iron regulation via hepcidin.
On a final note, our data suggest that the iron load of hepatocytes contributes to hepcidin regulation by adjusting Hamp mRNA to LIC via the Tfr1/Hfe interaction. Thus far, this is the only evidence for a direct effect of hepatocellular iron on signaling to hepcidin, because iron-regulated Bmp6 is derived from liver sinusoidal endothelial cells,51 whereas Tfr2 responds to circulating holo-transferrin.40,41,52 Clearly, Tfr1/Hfe do not play a central role in hepcidin regulation. Nevertheless, hepatocellular disruption of Tfr1 (this study) or Hfe53 leads to altered Hamp/LIC ratios, with pathological consequences ranging from hypoferremia and microcytosis to systemic iron overload, respectively.
The online version of this article contains a data supplement.
The publication costs of this article were defrayed in part by page charge payment. Therefore, and solely to indicate this fact, this article is hereby marked “advertisement” in accordance with 18 USC section 1734.
Acknowledgments
The authors thank Naciba Benlimame for technical assistance with immunohistochemistry and Allen Ehrlicher for use of the Leica SP8 confocal microscope.
This work was supported by grants from the Canadian Institutes of Health Research (MOP-86514) and the Canada Foundation for Innovation (Project 32749).
Authorship
Contribution: C.F., E.C., J.W., A.K., J.M., D.G.-S., and J.P. performed research and analyzed data; H.V. and P.P. analyzed data; and K.P. designed and supervised the study and wrote the manuscript.
Conflict-of-interest disclosure: The authors declare no competing financial interests.
Correspondence: Kostas Pantopoulos, 3755 Cote Ste-Catherine Rd, Montreal, QC H3T 1E2, Canada; e-mail: kostas.pantopoulos@mcgill.ca

This feature is available to Subscribers Only
Sign In or Create an Account Close Modal