

Key Points
Privately insured patients have improved OS among patients of all ages with FL.
Expanding access to care through insurance has the potential to improve FL outcomes.

Abstract
Follicular lymphoma (FL) is the second most common non-Hodgkin lymphoma and most common indolent non-Hodgkin lymphoma. Lower socioeconomic status is associated with poor outcomes in FL, suggesting that access to care is an important prognostic factor; however, the association between insurance status and FL survival has not been sufficiently examined. The National Cancer Database, a nationwide cancer registry, was used to evaluate 43 648 patients with FL diagnosed between 2004 and 2014. All analyses were performed on 2 cohorts segmented at age 65 years to account for changes in insurance status with Medicare eligibility. Cox proportional hazard models calculated hazard ratios (HRs) with confidence intervals (CIs) for the association between insurance status and overall survival (OS) controlling for the available sociodemographic and prognostic factors. Kaplan-Meier curves display outcomes by insurance status for patients covered by private insurance, no insurance, Medicaid, or Medicare. When compared with patients younger than age 65 years with private insurance, patients younger than age 65 years with no insurance (HR, 1.96; 95% CI, 1.69-2.28), with Medicaid (HR, 1.82; 95% CI, 1.57-2.12), and with Medicare (HR, 1.96; 95% CI, 1.71-2.24) had significantly worse OS after adjusting for sociodemographic and prognostic factors. Compared with patients age 65 years or older with private insurance, those with Medicare only (HR, 1.28; 95% CI, 1.17-1.4) had significantly worse OS. For adults with FL, expanding access to care through insurance has the potential to improve outcomes.
Introduction
Follicular lymphoma (FL) is the second most common non-Hodgkin lymphoma (NHL) overall and most common indolent NHL, with an estimated 14 000 diagnosed cases per year in the United States.1 Accounting for up to 20% of NHL cases globally, FL is a slow-growing tumor that often responds well to initial therapy.2 However, advanced-stage FL is an incurable disease characterized by frequent relapses, often with increasing aggressiveness, and the ability to transform into more aggressive lymphoid malignancies.3 The variable disease course and lack of cure has resulted in variable treatment strategies, without a standard of care. Overall survival (OS) in FL has improved with the incorporation of rituximab immunotherapy over the past decade.4,5 However, heterogeneity in FL outcomes persists. Relapse occurs in up to 20% of patients within the first 24 months of first-line treatment and confers a poor prognosis.6-8 To date, a limited number of prognostic parameters have been identified for predicting outcomes in FL.
The selection of cancer diagnostics and treatments may depend on a patient’s insurance status.9-11 Patients with no insurance or Medicaid, when compared with those with private insurance, are more likely to be diagnosed at an advanced stage for all cancers.9 Disparities in treatment and outcomes related to insurance status have been examined for some patients with aggressive NHL,12 but are less clear for FL and other indolent NHLs. For instance, NHL patients with Medicaid or no insurance are less likely to receive immunotherapy treatments such as rituximab, a therapy known to improve FL outcomes.13,14 In another study, older adolescents and young adults with lymphoma had a wider gap between the onset of cancer symptoms and diagnosis if they had Medicaid or no insurance than if they had private insurance.15 In other studies, patients without private insurance have been shown to have significantly worse outcomes for 2 aggressive lymphomas: diffuse large B-cell lymphoma and Hodgkin lymphoma.12,16
For patients with FL, lower neighborhood socioeconomic status (SES) is associated with substantially poorer survival, suggesting that access to care plays an important role in outcomes.17 The social determinants of FL prognosis remain unclear, and literature on the relationship between access to care and FL outcomes is scarce. We examined the relationship between insurance status and OS for FL in a national patient cohort.
Methods
Data source
Data were obtained from the National Cancer Database (NCDB), a nationwide, hospital-based cancer registry sponsored by the American Cancer Society and American College of Surgeons. The NCDB contains 34 million historical records, captures data for approximately 70% of newly diagnosed cancer cases across the Unites States, and obtains data from more than 1500 Commission on Cancer (CoC)–accredited facilities, beginning in 1989.18 Patients’ vital status and date of death are reported to the NCDB annually by the CoC facilities.19
Study population
Patients with FL were identified by using the International Classification of Diseases for Oncology, 3rd edition, histology codes 9690, 9691, 9695, and 9698, following the International Lymphoma Epidemiology Consortium (Interlymph) hierarchy of lymphoid neoplasms and the 2008 World Health Organization classification.20 Patients with FL were included in the study if they were age ≥18 years, were diagnosed with FL as their first primary tumor between 2004 and 2014, received all or part of their first course of treatment at the reporting facility, and were HIV-negative. Only HIV-negative patients were included in this study because of the significant confounding by HIV status on the relationship between insurance status and survival. Patients were excluded if insurance status was missing (n = 759), or the reporting facility was not CoC-accredited in the follow-up years (n = 4598), as were those who had government-sponsored insurance (Veterans Affairs and Indian/Public Health Services) (n = 497), because this category combines various heterogeneous populations in a small sample size (Figure 1).
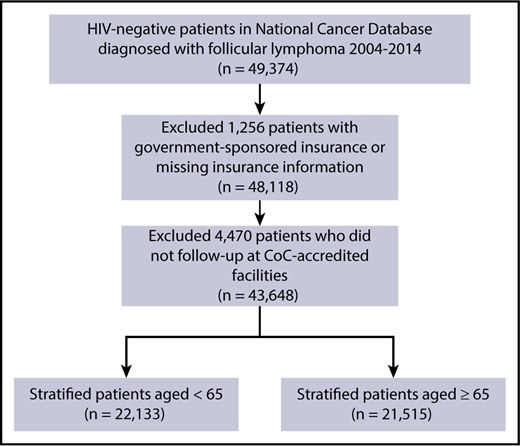
CONSORT diagram depicting FL case selection process. The total number of FL patients who met inclusion and exclusion criteria was 43 648. These patients were then stratified into 2 cohorts of patients age <65 and ≥65 years.
CONSORT diagram depicting FL case selection process. The total number of FL patients who met inclusion and exclusion criteria was 43 648. These patients were then stratified into 2 cohorts of patients age <65 and ≥65 years.
Study variables
Insurance status was defined as primary payer at the time of diagnosis and was grouped into the following categories: private insurance, no insurance, Medicaid, and Medicare. Race/ethnicity was classified as white, Hispanic, black, and other. Because the NCDB does not capture information on individual-level SES, we used ZIP code–level education, measured as proportion of adults without a high school diploma according to patient’s ZIP code of residence as a marker of SES.21,22 ZIP code–level education level was obtained from the 2012 American Community Survey and categorized into <7%, 7% to 12.9%, 13% to 20.9%, and >21% of adults without a high school diploma.23 Disease stage was defined according to the American Joint Committee on Cancer Cancer Staging Manual and sorted into early stage (I, II) and advanced stage (III, IV).24 A Charlson-Deyo comorbidity score was calculated on the basis of the patient’s preexisting medical conditions and comorbidities.25 Type and date of initial treatment were recorded. OS was calculated (in months) as time to event from the date of diagnosis through 31 December 2014, the date of death, or the date of last contact, whichever occurred first.
Statistical analysis
To compare the sociodemographic and clinical characteristics of the study cohort by insurance status, χ2 analysis was used. Because of the substantial change in the insurance landscape at age 65 years with Medicare eligibility, all analyses were performed on a cohort of patients age <65 years and separately on a cohort age ≥65 years. Because the Medicaid and uninsured patients age ≥65 years each consisted of <1% of the elderly population, they were removed from the analysis. Kaplan-Meier survival curves were drawn by insurance status, and log-rank tests were performed. Multivariable log-binomial models were generated to estimate risk ratios and 95% confidence intervals (CIs) while controlling for sociodemographic factors (sex, race, and education) to assess the relationship between insurance status and advanced-stage (III/IV vs I/II) disease, presence of B symptoms (yes vs no), comorbidities (yes vs no), initial treatment modality (systemic treatment including chemotherapy and/or immunotherapy vs no systemic treatment), and treatment within 1 month (yes vs no). Univariable and multivariable Cox proportional hazards models were fitted after confirming that the proportional hazards assumption was met for all independent variables. To examine the effect of prognostic factors (stage, B symptoms, comorbidity, time from diagnosis to treatment) on the survival disparity observed as a result of insurance status, models were fitted with variables added using forward selection and included if the significance criterion of 0.10 was met. The covariates considered for inclusion were sex, race, education level, presence of B symptoms, stage, comorbidity score, type of treatment, and time from diagnosis to treatment. Additional analyses were performed to (1) assess the impact of age on the relationship between insurance status and outcomes in the elderly cohort by generating Kaplan-Meier curves by insurance status and univariable and multivariable Cox regression models for subgroups of patients age ≥70 years and age ≥75 years, and (2) assess the impact of stage by generating Kaplan-Meier curves stratified by insurance status for early-stage and advanced-stage patients. All statistical analyses were performed using R version 3.3.2 software (R Project for Statistical Computing). The threshold for statistical significance was set at α = 0.05.
Results
We identified 43 648 patients diagnosed with FL between 2004 and 2014, of whom 47% had private insurance, 3% were uninsured, 4% had Medicaid, and 46% had Medicare (Table 1). Of the 22 133 FL patients age <65 years, 80% had private insurance, 6% had no insurance, 6% had Medicaid, and 8% had Medicare. Of the 21 515 patients age ≥65 years, 13% had private insurance and 86% had Medicare. Less than 1% of the patients age ≥65 years had Medicaid or had no insurance and were not included in the analyses for this cohort.
Descriptive characteristics for patients with FL age <65 and ≥65 years
| Characteristic | Patients age <65 years | Patients age ≥65 years | ||||||||
|---|---|---|---|---|---|---|---|---|---|---|
| Total | Private, % | No insurance, % | Medicaid, % | Medicare, % | P | Total | Private, % | Medicare, % | P | |
| Sex | ||||||||||
| Male | 11 108 | 50.8 | 53.1 | 44.7 | 46 | <.0001 | 9 727 | 51.6 | 45 | <.0001 |
| Female | 11 025 | 49.2 | 46.9 | 55.3 | 54 | 11 492 | 48.4 | 55 | ||
| Race/ethnicity | ||||||||||
| White | 17 325 | 81 | 61.7 | 60.4 | 78.5 | <.0001 | 18 121 | 82.3 | 85.9 | <.0001 |
| Hispanic | 1 460 | 4.8 | 19.1 | 18 | 5.9 | 594 | 4 | 2.6 | ||
| Black | 1 349 | 5 | 11.1 | 13 | 7.8 | 780 | 4.5 | 3.6 | ||
| Other | 1 849 | 8.5 | 7.5 | 8 | 7.3 | 1 616 | 8.6 | 7.5 | ||
| Unknown | 150 | 0.7 | 0.6 | 0.6 | 0.5 | 108 | 0.7 | 0.5 | ||
| Percent with no high school diploma | ||||||||||
| <7 | 6 247 | 31.6 | 15.8 | 11 | 17.8 | <.0001 | 5 784 | 30.6 | 26.7 | <.0001 |
| 7-12.9 | 7 420 | 34.6 | 26.3 | 29.9 | 31.3 | 7 450 | 34.6 | 35.2 | ||
| 13-20.9 | 5 137 | 21.9 | 27.8 | 29.1 | 28.3 | 5 106 | 21.7 | 24.4 | ||
| >21 | 3 080 | 10.7 | 29.2 | 29.2 | 21.6 | 2 622 | 11.8 | 12.4 | ||
| Unknown | 249 | 1.2 | 0.9 | 0.8 | 1 | 257 | 1.3 | 1.2 | ||
| B symptoms present | ||||||||||
| Yes | 4 139 | 16.6 | 31.2 | 28.7 | 21.6 | <.0001 | 3 206 | 14.2 | 15.3 | .0688 |
| No | 16 309 | 75.5 | 63.1 | 66 | 70.4 | 15 993 | 77.6 | 75 | ||
| Unknown | 1 685 | 7.9 | 5.7 | 5.4 | 8 | 2 020 | 8.3 | 9.7 | ||
| Stage | ||||||||||
| I/II | 8 574 | 40 | 29.5 | 30.7 | 40.1 | <.0001 | 9 105 | 43.8 | 42.8 | .0813 |
| III/IV | 11 675 | 51.7 | 61.7 | 61.1 | 49.9 | 9 904 | 44.6 | 47 | ||
| Unknown | 1 884 | 8.4 | 8.8 | 8.2 | 9.9 | 2 210 | 11.6 | 10.2 | ||
| Comorbidities | ||||||||||
| 0 | 19 152 | 88.6 | 84.9 | 79.4 | 73.1 | <.0001 | 16 422 | 80.1 | 77 | .0002 |
| 1 | 2 436 | 9.7 | 12.3 | 15.6 | 19.7 | 3 605 | 15.6 | 17.2 | ||
| ≥2 | 545 | 1.8 | 2.8 | 5 | 7.2 | 1 192 | 4.3 | 5.8 | ||
| Initial treatment | ||||||||||
| Systemic | 13 838 | 61 | 71.7 | 71.6 | 62.9 | <.0001 | 11 805 | 54.2 | 55.9 | .0959 |
| None | 7 629 | 35.7 | 26.9 | 25.6 | 35.5 | 8 890 | 43.3 | 41.7 | ||
| Days from diagnosis to treatment | ||||||||||
| 0-14 | 8 264 | 37.9 | 35.3 | 36.5 | 34 | .0002 | 7 439 | 34.2 | 35.2 | .0412 |
| 15-30 | 3 342 | 15.1 | 14.6 | 15.2 | 15.7 | 3 041 | 12.8 | 14.6 | ||
| >30 | 6 437 | 28.4 | 34.1 | 32.1 | 30.1 | 5 748 | 28.1 | 26.9 | ||
| Unknown | 4 090 | 18.7 | 16 | 16.2 | 20.2 | 4 991 | 24.9 | 23.3 | ||
Through 2014, 11 547 (26%) patients with FL had died. The median follow-up was 57.9 months in the cohort age <65 years and 42.8 months in the cohort age ≥65 years. For the cohort age <65 years, the median ages at diagnosis were 54, 52, 52, and 59 years for private insurance, no insurance, Medicaid, and Medicare, respectively, and was 54 years (interquartile range, 47-60 years) across all insurance types. For the cohort age ≥65 years, the median ages at diagnosis were 71 and 75 years for private insurance and Medicare, respectively, and 74 years (interquartile range, 69-80 years) across both insurance types. Patients with no insurance or Medicaid were more likely to be black or Hispanic, live in an area with mostly poorly educated people, have B symptoms, and be diagnosed at an advanced stage when compared with those with private insurance or Medicare (Table 1). Patients age <65 years who were uninsured or Medicaid-insured were more likely to present at an advanced stage, present with B symptoms, and have comorbidities after adjusting for sociodemographic factors (supplemental Table 1, available on the Blood Web site). Patients with Medicare who were age <65 years were more likely to have B symptoms and comorbidities (supplemental Table 1). Meanwhile, patients with Medicare who were age ≥65 years were significantly more likely to have comorbidities and receive treatment with systemic therapy than those privately insured (supplemental Table 2).
For FL patients age <65 years, OS was 92% at 3 years, 88% at 5 years, and 84% at 7 years. The OS rates for privately insured, uninsured, Medicaid-insured, and Medicare-insured patients age <65 years were 90%, 78%, 80%, and 78%, respectively, at 5 years (Kaplan-Meier curves shown in Figure 2). OS was significantly worse for uninsured, Medicaid-insured, and Medicare-insured patients age <65 years compared with those privately insured with hazard ratios (HRs) of 2.34 (95% CI, 2.06-2.65), 2.22 (95% CI, 1.96-2.51), and 2.45 (95% CI, 2.22-2.71), respectively. When adding sociodemographic, prognostic, and treatment factors to the model, the HRs remained significant for uninsured, Medicaid-insured, and Medicare-insured at 1.96 (95% CI, 1.69-2.28), 1.83 (95% CI, 1.57-2.12), and 1.96 (95% CI, 1.71-2.24), respectively (Table 2). Disease stage, presence of B symptoms, and comorbidities were significant predictors of FL survival in patients, which contributed to the survival disparities seen with insurance status.

OS by insurance status for FL patients age <65 years. OS for the cohort was 92% at 3 years, 88% at 5 years, and 84% at 7 years.
OS by insurance status for FL patients age <65 years. OS for the cohort was 92% at 3 years, 88% at 5 years, and 84% at 7 years.
Multivariable HRs for FL patients age <65 years
| HR (95% CI) | P | |
|---|---|---|
| Insurance status | ||
| Private insurance | 1.00 (ref) | |
| No insurance | 1.96 (1.69-2.28) | <.0001 |
| Medicaid | 1.83 (1.57-2.12) | <.0001 |
| Medicare | 1.96 (1.71-2.24) | <.0001 |
| Sex | ||
| Male | 1.00 (ref) | |
| Female | 0.78 (0.71-0.85) | <.0001 |
| Race/ethnicity | ||
| White | 1.00 (ref) | |
| Black | 0.98 (0.83-1.17) | .8462 |
| Hispanic | 0.72 (0.59-0.88) | .0014 |
| Other race | 0.95 (0.81-1.12) | .5616 |
| Unknown race | 1.01 (0.56-1.82) | .9828 |
| Percent with no high school diploma | ||
| <7 | 1.00 (ref) | |
| 7-12.9 | 1.19 (1.05-1.34) | .0051 |
| 13-20.9 | 1.4 (1.24-1.59) | <.0001 |
| >21 | 1.42 (1.22-1.64) | <.0001 |
| B symptoms | ||
| Not present | 1.00 (ref) | |
| Present | 1.35 (1.22-1.49) | <.0001 |
| Stage | ||
| I/II | 1.00 (ref) | |
| III/IV | 1.69 (1.52-1.87) | <.0001 |
| Comorbidity score | ||
| 0 | 1.00 (ref) | |
| 1 | 1.71 (1.52-1.93) | <.0001 |
| 2+ | 3.1 (2.61-3.69) | <.0001 |
| Initial treatment | ||
| Systemic | 1.00 (ref) | |
| None | 0.81 (0.71-0.92) | <.0001 |
| Days to treatment | ||
| 0-14 | 1.00 (ref) | |
| 15-30 | 0.82 (0.73-0.93) | .0012 |
| 30+ | 0.69 (0.62-0.76) | <.0001 |
ref, reference.
For FL patients age ≥65 years, OS was 73% at 3 years, 63% at 5 years, and 52% at 7 years. The OS rates for privately insured and Medicare-insured patients age ≥65 years were 69% and 62%, respectively, at 5 years (Kaplan-Meier curves shown in Figure 3). Medicare-insured patients age ≥65 years had significantly worse OS compared with those with private insurance with an HR of 1.33 (95% CI, 1.24-1.43). After controlling for sociodemographic and clinical factors, Medicare insurance remained significantly associated with worse OS with an HR of 1.28 (95% CI, 1.17-1.4) (Table 3).

OS by insurance status for FL patients age ≥65 years. OS for the cohort was 73% at 3 years, 63% at 5 years, and 52% at 7 years.
OS by insurance status for FL patients age ≥65 years. OS for the cohort was 73% at 3 years, 63% at 5 years, and 52% at 7 years.
Multivariable HRs for FL patients age ≥65 years
| HR (95% CI) | P | |
|---|---|---|
| Insurance status | ||
| Private insurance | 1.00 (ref) | |
| Medicare | 1.28 (1.17-1.4) | <.0001 |
| Sex | ||
| Male | 1.00 (ref) | |
| Female | 0.88 (0.83-0.93) | <.0001 |
| Race/ethnicity | ||
| White | 1.00 (ref) | |
| Black | 0.96 (0.83-1.11) | .5958 |
| Hispanic | 0.67 (0.55-0.82) | <.0001 |
| Other race | 1.02 (0.92-1.12) | .7651 |
| Unknown race | 1.44 (0.98-2.12) | .0627 |
| Percent with no high school diploma | ||
| <7 | 1.00 (ref) | |
| 7-12.9 | 1.03 (0.96-1.11) | .4219 |
| 13-20.9 | 1.09 (1.01-1.18) | .0279 |
| >21 | 1.19 (1.09-1.31) | .0002 |
| B symptoms | ||
| Not present | 1.00 (ref) | |
| Present | 1.38 (1.29-1.48) | <.0001 |
| Stage | ||
| I/II | 1.00 (ref) | |
| III/IV | 1.35 (1.27-1.43) | <.0001 |
| Comorbidity score | ||
| 0 | 1.00 (ref) | |
| 1 | 1.44 (1.35-1.55) | <.0001 |
| 2+ | 2.33 (2.11-2.57) | <.0001 |
| Initial treatment | ||
| Systemic | 1.00 (ref) | |
| None | 0.97 (0.9-1.04) | .3489 |
| Days to treatment | ||
| 0-14 | 1.00 (ref) | |
| 15-30 | 0.96 (0.89,1.04) | .3173 |
| 30+ | 0.84 (0.78-0.89) | <.0001 |
Discussion
To the best of our knowledge, this is the first US nationwide investigation into the relationship between insurance status and OS for patients with FL as well as the first to examine this relationship in an indolent lymphoma. We found that adults age <65 years who were uninsured, had Medicaid, or had Medicare had inferior survival in comparison with those with private insurance. Similarly, among patients age ≥65 years with FL, those with Medicare had significantly worse OS compared with privately insured patients. Patients who were uninsured or had Medicaid more commonly had poorer SES, advanced stage, B symptoms, and multiple comorbidities, likely contributing to the observed survival difference. These associations persisted when controlling for the known and available sociodemographic and prognostic factors. The findings of the study indicate that improving access to affordable quality health care may reduce disparities in survival for those currently lacking coverage.
In our additional analyses, private insurance remained a significant predictor of improved OS relative to no insurance, Medicaid, and Medicare when stratified by early and advanced stage for patients age <65 years (supplemental Figure 2) and for patients age ≥65 years (supplemental Figure 3). These results suggest that although stage is an important factor in how insurance status relates to FL survival, stage does not fully explain the disparate outcomes, and lead-time bias is unlikely to be the sole source for this difference. Meanwhile, insurance status remained a significant predictor of worse OS for Medicare patients in the cohort age ≥70 years by log-rank test and univariable and multivariable Cox regression models, and in the elderly cohort age ≥75 years by log-rank test and univariable Cox regression model. It is possible that the multivariable Cox regression model did not meet significance criteria in the cohort age ≥75 years because of a reduced sample size. These results suggest that although age is an important factor that influences outcomes within the elderly cohort, insurance status is an independent predictor of outcomes for elderly patients.
For FL patients age <65 years, Medicare survival mirrors that of uninsured and Medicaid-insured patients. Medicare patients age <65 years, were much more likely to have comorbidities that contribute to the observed worse outcomes. This arises because young patients can receive Medicare if they qualify for Social Security Disability Insurance or have end stage renal disease and are receiving dialysis or had a kidney transplant. Thus, patients insured by Medicare age ≥65 years had a less pronounced risk of having comorbidities, although they continued to have poorer prognosis compared with the elderly who are insured privately.
Our results showed that patients with Medicaid, Medicare, or no insurance age <65 years were more likely to have a delay in treatment and were more likely to receive systemic therapy than their privately insured counterparts; however, these associations were not found in the elderly cohort. For both cohorts, a delay in treatment and treatment other than systemic therapy were associated with improved survival. This observed improved outcome is likely the result of those patients having less severe disease at diagnosis. Unlike many other malignancies, systemic therapy and prompt treatment are not required or recommended for many patients with FL who are asymptomatic at diagnosis and do not have evidence of any of the Groupe d’Etude des Lymphomes Folliculaires (GELF) criteria.26 These factors include any nodal or extranodal tumor mass with a diameter ≥7 cm, involvement of ≥3 nodal sites each with a diameter ≥3 cm, B symptoms, splenomegaly, pleural effusions or ascites, Eastern Cooperative Oncology Group performance status >1, or lactate dehydrogenase or β2-microglobulin above normal levels. Unfortunately, complete assessment of GELF criteria for initiation of therapy is not possible in this data set. Large clinical data sets that include these criteria are needed to understand the interactions between clinical and social determinants on cancer outcomes.
Given the heterogeneity of outcomes and treatment options for FL, establishing factors that affect prognosis has been a central research focus. The most widely adopted FL risk stratification model has been FL International Prognostic Index, which includes age, stage, hemoglobin level, number of nodal areas, and serum lactate dehydrogenase levels.27 Lack of biological information in our registry data set prevented us from incorporating some of these data into our study. However, our results confirmed the importance of advanced stage and B symptoms as predictors of worse OS.27,28 Our study also contributes new information on prognostic factors with comorbidity score ≥1 as a significant, independent predictor of worse OS. In addition to the factors currently used in the FL International Prognostic Index, insurance status and comorbidity score should be evaluated for inclusion in future FL prognostic models.
Significant heterogeneity exists in the first-line management of FL. Commonly used options include watchful waiting, radiotherapy, single-agent chemotherapy, immunotherapy, and chemoimmunotherapy. Initial treatment decisions often rely upon patient age, performance status, stage, and goals of care.29 Several studies have shown improved clinical course for FL in the rituximab era; however, watchful waiting remains a viable option for many.30-35 Those who opted for watchful waiting in our analysis showed improved outcomes compared with those who received systemic treatment, which suggests that watchful waiting can be useful for the appropriately selected FL patient. Future randomized trials are essential to better identify the ideal patients for watchful waiting. Meanwhile, prior studies using the NCDB showed that patients without private insurance and those with low SES and black race are less likely to be the recipients of treatment with chemoimmunotherapy.13 This could be an important driver of the observed disparities in outcomes relative to insurance status, and one that is likely to grow as expensive therapies such as idelalisib, ibrutinib, and obinutuzumab continue to grow in use.36-39
This study has several limitations. First, because the study uses a retrospective database, we were unable to control for all possible confounders. Some potential confounders, such as individual-level SES, health literacy, or adherence to follow-up, were not collected in the NCDB. State of residence was not provided in the NCDB Participant User Files; thus, we were unable to examine how the variability in state-run Medicaid programs had an impact on outcomes in FL. Furthermore, we were unable to assess the impact of immunotherapy treatment over the time period because rituximab, an immunotherapy shown to have significant survival benefit in FL, was collected as chemotherapy rather than immunotherapy until 2013. Second, since insurance status was recorded only as primary payer at the time of diagnosis, it was not possible to account for dual insurance coverage or changes in insurance status over time. For instance, patients older than age 65 years recorded as having private insurance were likely to have private coverage supplementing insurance with Medicare. Third, it is possible that the facilities available to patients with low SES or no insurance may not provide detailed diagnoses using the World Health Organization classification, which would confound the results. Finally, the results may not be fully generalizable to the US population because all data came from CoC-accredited hospitals, which may underrepresent the most disadvantaged patients.
Despite these limitations, the study has several strengths, including the large sample size, consistent vital status reporting, and inclusion of crucial factors that affect FL survival. Such factors include B symptoms, comorbidities, time to treatment, and HIV status.
Patients without health insurance, or with inadequate health insurance, may experience substantial barriers to quality care in the form of access, cost, or administration, which would contribute to further health inequality.40 The Affordable Care Act passed in 2010 has improved patient access to care with more adults connecting to the health care system, obtaining a regular source of care, and being able to afford the care they require.41,42 Coverage expansion has been associated with earlier oncologic diagnosis and timelier oncologic care.43,44 The expansion of Medicaid has been successful in improving mortality, with the largest improvement in health care–amenable conditions such as cancer.45 Although insurance through Medicaid can be associated with improved outcomes compared with no insurance, the benefits of Medicaid may be falsely lowered because of uninsured patients waiting until they qualified for Medicaid to see a physician about their cancer symptoms.46 This is suggested by the significantly increased likelihood of Medicaid patients presenting in an advanced stage. It is also worth noting that Medicaid insurance still confers a worse OS for FL than private insurance, although this effect may be somewhat exaggerated. Health care policy should be based on evidence and, for patients with FL, improving access to care for those who are unable to afford private insurance has the potential to substantially improve outcomes.47
In conclusion, our study finds that insurance status contributes to survival disparities in FL. Future studies on outcomes in FL should include insurance status as an important predictor. Further research on prognosis for FL should examine the impact of public policy, such as the passage of the Affordable Care Act, on FL outcomes, and should examine other factors that influence access to care, such as individual-level SES, regular primary care visits, access to prescription medications, and care affordability.
The online version of this article contains a data supplement.
The publication costs of this article were defrayed in part by page charge payment. Therefore, and solely to indicate this fact, this article is hereby marked “advertisement” in accordance with 18 USC section 1734.
Acknowledgments
This work was supported in part by the Winship Research Informatics and Biostatistics and Bioinformatics Shared Resources of Winship Cancer Institute of Emory University; by National Institutes of Health (NIH), National Cancer Institute award no. P30CA138292 and grant no. K24CA208132 (C.R.F.); and by NIH, National Center for Advancing Translational Sciences award no. UL1TR000454.
The content is solely the responsibility of the authors and does not necessarily represent the official views of the National Institutes of Health.
Authorship
Contribution: J.S.G. performed data analysis; and J.S.G., L.J.N., X.H., A.J., E.W., and C.R.F. were involved in study conception and design, data interpretation, and manuscript preparation.
Conflict-of-interest disclosure: C.R.F. received consultancy fees from AbbVie, Spectrum, Celgene, Optum Rx, Seattle Genetics, Gilead Sciences, and Bayer; and research funding from AbbVie, Acerta, Celgene, Gilead Sciences, Infinity Pharmaceuticals, Janssen Pharmaceuticals, Millennium Pharmaceuticals/Takeda, Spectrum, Onyx Pharmaceuticals, Pharmacyclics, the Burroughs Wellcome Fund, the V Foundation, and the National Institutes of Health. The remaining authors declare no competing financial interests.
Correspondence: Christopher R. Flowers, Department of Hematology and Oncology, Winship Cancer Institute, Emory University, 1365 Clifton Rd, Building B, Suite 4300, Atlanta, GA 30322; e-mail: crflowe@emory.edu.
