Subjects:
Free Research Articles
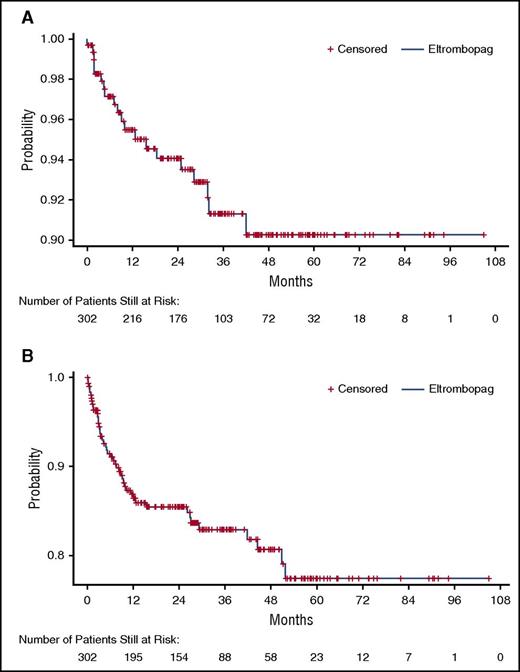
On page 2534 in the 7 December 2017 issue, in Figure 4A-B the y-axes read, “Probability, %.” They should read, “Probability.” The corrected figure is shown below. The errors have been corrected in the online version, which now differs from the print version.
Figure 4.
Kaplan-Meier time-to-first event curves for TEE and HBLA. (A) TEEs. (B) HBLAs. Patients still at risk do not include patients who already experienced the event in question or patients who withdrew from the study.
Figure 4.
Kaplan-Meier time-to-first event curves for TEE and HBLA. (A) TEEs. (B) HBLAs. Patients still at risk do not include patients who already experienced the event in question or patients who withdrew from the study.
© 2018 by The American Society of Hematology
2018


This feature is available to Subscribers Only
Sign In or Create an Account Close Modal