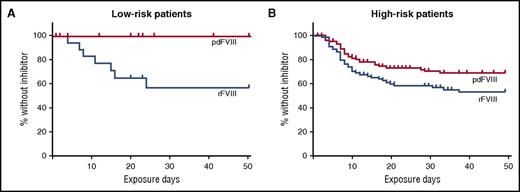
In the figure on page 1689 in the 12 October 2017 issue, “% with inhibitor” should read “% without inhibitor” in both panels. The corrected figure is shown below. The errors have been corrected in the online version, which now differs from the print version.
Kaplan-Meier curves show the cumulative incidence of being without an inhibitor by treatment type in patients with F8 DNA variants that put them at low risk (A) or high risk (B) of developing a factor VIII inhibitor. This figure has been adapted from Figure 1 in the article by Rosendaal et al that begins on page 1757.
Kaplan-Meier curves show the cumulative incidence of being without an inhibitor by treatment type in patients with F8 DNA variants that put them at low risk (A) or high risk (B) of developing a factor VIII inhibitor. This figure has been adapted from Figure 1 in the article by Rosendaal et al that begins on page 1757.


This feature is available to Subscribers Only
Sign In or Create an Account Close Modal