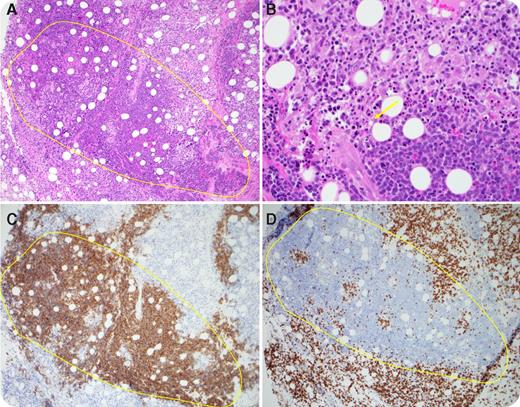
A 5-year-old girl with relapsed/refractory B lymphoblastic leukemia was treated with T cells expressing a chimeric antigen receptor (CART) targeting CD19. Preinfusion, the bone marrow was 90% involved and a computed tomography scan demonstrated extensive thoracic/abdominal/pelvic lymphadenopathy. The patient developed cytokine release syndrome (CRS) 3 days after infusion. Eight days after infusion, a soft-tissue mass involving the right eyelid and periorbital region developed. Although CRS resolved by day 11, this mass increased in size until day 18, when a biopsy was performed to determine the etiology.
Hematoxylin and eosin–stained sections (panel A; original magnification ×100) show sheets of large atypical blasts (bounded by yellow line) surrounded by a lymphohistiocytic infiltrate. Apoptosis and debris is noted at the tumor–T-cell interface (panel B, arrow; original magnification ×400) consistent with cell death. CD19 immunostain (panel C, brown; original magnification ×100) highlights B lymphoblasts, whereas CD8 immunostain (panel D, brown; original magnification ×100) highlights surrounding T cells. The mass regressed shortly after biopsy without further intervention. A subsequent bone marrow biopsy demonstrated morphologic remission. These findings are consistent with delayed but active tumor cell killing by CART cells.
For additional images, visit the ASH IMAGE BANK, a reference and teaching tool that is continually updated with new atlas and case study images. For more information visit http://imagebank.hematology.org.


This feature is available to Subscribers Only
Sign In or Create an Account Close Modal