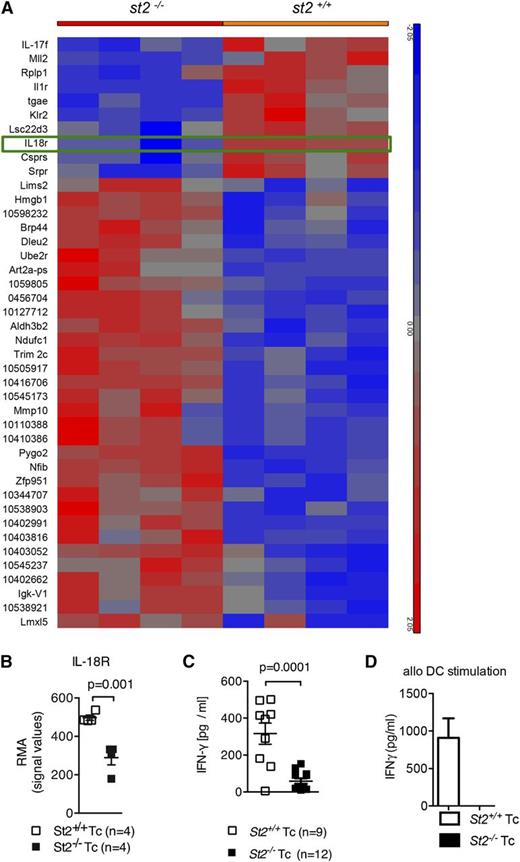
In Figure 5 on page 3189 in the 14 May 2015 issue, the labels at the top of panel A are transposed. The corrected Figure 5 is shown below. The error has been corrected in the online version, which now differs from the print version.
Upregulation of IL-18R and IFN-γ production in response to alloantigen is reduced in st2−/− T cells. (A-B) Gene expression was quantified in WT and st2−/− T cells on the RNA level by microarray analysis. WT or st2−/− T cells were exposed to allogeneic irradiated DC for 48 hours. The tile display for the most significantly regulated genes expressed by RMA signal values of 4 individual samples in each group is shown at the RNA level. (C) The values of individual mice for serum IFN-γ is shown on day 8 after allo-HCT. The experiment was performed twice and the data were pooled. (D) WT and st2−/− CD4+/CD8+ T cells stimulated with allo–BM-DCs (2:1 ratio). ELISA for IFN-γ was performed after 24 hours of exposure. The experiment was performed twice with similar results.
Upregulation of IL-18R and IFN-γ production in response to alloantigen is reduced in st2−/− T cells. (A-B) Gene expression was quantified in WT and st2−/− T cells on the RNA level by microarray analysis. WT or st2−/− T cells were exposed to allogeneic irradiated DC for 48 hours. The tile display for the most significantly regulated genes expressed by RMA signal values of 4 individual samples in each group is shown at the RNA level. (C) The values of individual mice for serum IFN-γ is shown on day 8 after allo-HCT. The experiment was performed twice and the data were pooled. (D) WT and st2−/− CD4+/CD8+ T cells stimulated with allo–BM-DCs (2:1 ratio). ELISA for IFN-γ was performed after 24 hours of exposure. The experiment was performed twice with similar results.


This feature is available to Subscribers Only
Sign In or Create an Account Close Modal