Abstract

Background: High dose melphalan [HDM] followed by AHCT is widely used in pts with MM as upfront and salvage therapy. The safety and efficacy of AHCT in patients with RI is controversial and results in an inconsistent arbitrary cutoff for creatinine clearance for performing AHCT. Herein we compare the outcomes of MM pts with various degrees of RI who received AHCT.
Methods: Patients from US/Canada who underwent AHCT for MM and reported to the CIBMTR between 2008 and 2013 and had a reported creatinine at AHCT were included in this study (N =1492). Pts were grouped by GFR using the MDRD equation at AHCT as Normal/Mild [>60 ml/min], moderate and Severe RI [<30]. Multivariate analysis of non-relapse mortality (NRM), relapse/progression (rel), progression-free survival (PFS) and overall (OS) was performed using the Cox proportional hazard regression model and RI was considered the main variable.
Results: Of the total cohort, 1240 pts had normal/mild, 185 pts had moderate and 67 pts had severe RI. 35 pts were on dialysis prior to ASCT. Majority of pts with severe RI had Karnofsky <90% (55%) compared to moderate (41%) and normal/mild (40%). Light chain MM was more frequent in severe RI (55%) compared to 30% (moderate) and 18% (normal/mild). There was no difference in high-risk chromosomal versus non-high risk abnormalities between the 3 groups. Induction chemotherapies included non-lenalidomide based treatments in 39% of normal/mild, 51% of moderate and 72% of severe, RI and ≥2 lines of chemotherapy in 20% normal/mild, 22% moderate and 45% severe RI. Pre-transplant disease status was similar with ≥VGPR in 49% normal/mild,, 49% moderate and 50% severe RI. Median time from diagnosis to ASCT was <6 months in 38% of normal/mild., 36% of moderate and 25% of pts with severe RI. HDM dose was 200mg/m2 in 92% pts with normal/mild, 75% pts with moderate and 33% pts with severe RI.
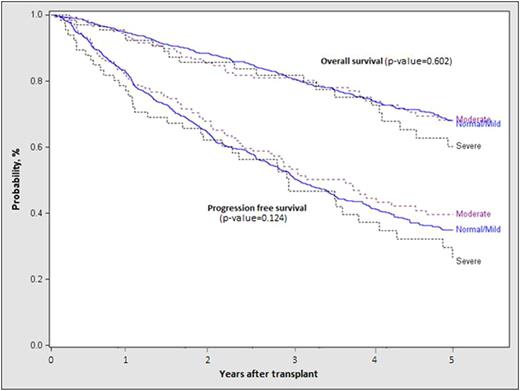
Median [range] inpatient hospital stay was 14 days [1-90] in pts with normal/mild, 16[3-77] in pts with moderate and 17[4-70] in pts with severe RI. Time to neutrophil and platelet engraftment, NRM, rel, PFS and OS were not statistically different between the groups. On multivariate analysis, IgA subtype, ISS stage III at diagnosis, lack of planned post-transplant therapy post-AHCT, 2 or more lines of pre-AHCT therapy [2+] were associated with lower PFS and OS (Table 1). IgA or light chain subtypes, ISS Stage III, ≥2 lines of chemotherapy, sensitivity to therapy and lack of planned post-transplant therapy were significant for higher rel. 30 of 35 pts [85%] with severe RI achieved dialysis independence. The probability of PFS at 5 years for pts with normal, mod and severe RI was 35% [95% CI, 31-38%], 40% [31-49] and 27% [15-40%] respectively (p=0.42). The probability of OS at 5 years for pts with normal, mod and severe RI was 68% [95% CI, 65-71%], 68% [60-76] and 60% [46-74%] respectively (p=0.69)(Figure 1). For pts with moderate RI, probability of PFS at 5 years for pts receiving Mel 140 mg/m2 was 18% [95% CI, 6-35%] and for pts receiving Mel 200 mg/m2 was 46% [36-57] (p=0.009); probability of OS at 5 years for pts receiving Mel 140 mg/m2 was 67% [95% CI, 51-82%] and for pts receiving Mel 200 mg/m2 was 68% [58-78] (p=0.52). For pts with severe RI, probability of PFS at 5 years for pts receiving Mel 140 mg/m2 was 25% [95% CI,11-41%] and for pts receiving Mel 200 mg/m2 was 32% [11-58] (p=0.37); probability of OS at 5 years for pts receiving Mel 140 mg/m2 was 63% [95% CI, 46-80%] and for pts receiving Mel 200 mg/m2 was 55% [31-77] (p=0.65). Relapse was the primary cause of death in pts with normal/mild (81%), moderate (73%) and severe RI (73%).
Conclusions: HDM with AHCT using melphalan is safe and effective in pts with MM with RI at transplant. A significant proportion of pts achieved dialysis independence with treatment. Improved PFS was noted among pts with moderate RI receiving Mel 200 mg/m2 compared to Mel 140 mg/m2. Post-transplant maintenance treatment was associated with improved outcomes.
Multivariate Analysis of outcomes
Kaplan-Meier survival curve of PFS and OS of pts with Normal/mild, moderate and severe renal insufficiency
Kaplan-Meier survival curve of PFS and OS of pts with Normal/mild, moderate and severe renal insufficiency
No relevant conflicts of interest to declare.
Author notes
Asterisk with author names denotes non-ASH members.

This icon denotes a clinically relevant abstract


This feature is available to Subscribers Only
Sign In or Create an Account Close Modal