Abstract
Background:
A commercially available gene expression profiling (GEP) model is an important risk stratification method in multiple myeloma. GEP is helpful in dividing myeloma into low and high risk based on a pre-determined threshold, however, the value of sequential GEP testing on patients receiving sequential anti-myeloma therapies has yet to be fully determined.
Methods:
Fifty four myeloma patients at Moffitt Cancer Center underwent two sequential GEPs based a dedicated 70-gene panel using an Affymetrixmicroarray platform (MyPRSTM) from bone marrow aspirate samples during the course of their disease. Myeloma was characterized based on the risk classification (cutoff of score 45.2), risk score (0-100), differences in the score/classification, and molecular subtyping. Pearson correlation analysis was performed to correlate GEP scores at two time points. Overall survival (OS) was estimated using the Kaplan-Meier method from the time of first GEP analysis and OS curves were compared using the log-rank test. Multivariate Cox proportional hazards regression models were built for OS.
Results:
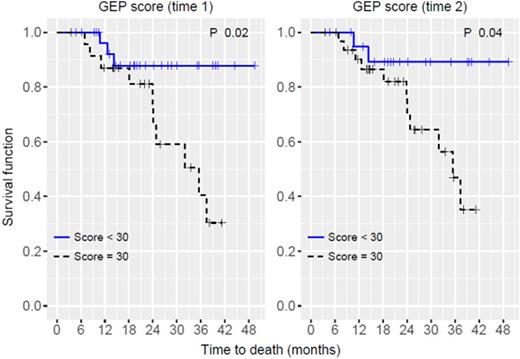
Majority were male (67%) and hadDurie-Salmon stage 2 or 3 disease (83%).Immunophenotypeswere IgG (56%), IgA (22%) and light chain (20%). At first GEP testing (Time 1), 20% (11/54) were high risk and the median score was 28.6 (range, 10.8-66.5) with frequency of molecular subtypes being cycle family (CD) 1&2 28%,hyperdiploidy(HY) 24%, low bone disease (LB) 22%, proliferation (PR) 17%, and MMSET associated (MS) 9%. There were no MAF associated cases in this cohort. At second GEP testing (Time 2), 28% (15/54) were high risk with a median score of 33.5 (range, 11.4-96.3). Pearson correlation coefficient for the GEP scores of Times 1 & 2 was r=0.77 (p<0.001). Risk group for eight patients (15%) changed with 6 moving from low to high risk and 2 with high to low risk. Molecular subtype for 18 patients (33%) changed with most frequent pattern being LB to PR (n=5) followed by PR to LB (n=3). Median OS for the entire group was 21.4 months. In this cohort, there were no statistical differences in OS based on risk stratification at Time 1 (p=0.187, log-rank), change in risk stratification (p=0.131), and molecular subtypes at Time 1 (p=0.09). When this cohort of patients was re-categorized based on the median GEP score (28.58), OS was significantly worse for those with scores higher than the median (n=27 (50%), p<0.001). With a new cutoff value of 30, patients with a GEP score≥ 30 had inferior OS either based on first GEP (Time 1; n=24 (44%), p=0.02; Figure 1) or second (Time 2; n=33 (61%), p=0.04; Figure 2). With the cutoff value of 30 as a new threshold, patients who had high scores for both Times 1 and 2 (n=24) had worse OS compared to those with both low scores (n=21) and those moved from low to high scores (n=9: p=0.017). When patients with GEP score differences between Times 1 and 2 of more than 1 standard deviation (n=4 moving from low to high with a total n=12) were compared to the rest, there were no statistical differences in OS (p=0.296). In multivariate analyses using the GEP score, score difference, molecular subtype and risk classification, GEP score was the only significant predictive factor for inferior OS (hazard ratio 1.1, 95% confidence interval:1.03-1.18, p=0.006).
Conclusions:
Serial GEP analysis on myeloma patients demonstrates longitudinal changes in risk scores, molecular subtyping and risk classification suggesting clonal evolution or modifications of overall transcribed genetic signature with systemic therapy. GEP risk score may potentially provide graded risk assessment rather than dichotomous categorization as different risk threshold may be found based on observation of a new cutoff value predictive of OS. Further analysis of gene expression patterns is ongoing to elucidate risk stratification based on molecular signatures and to elucidate potential treatment associated profiles.
Nishihori:Novartis: Research Funding; Signal Genetics: Research Funding. Baz:Novartis: Research Funding; Millennium: Research Funding; Merck: Research Funding; Celgene: Membership on an entity's Board of Directors or advisory committees; Signal Genetics: Research Funding; Karyopharm: Research Funding; Bristol-Myers Squibb: Research Funding. Van Laar:Signal Genetics, Inc.: Employment. Bender:Signal Genetics, Inc.: Employment. Alsina:Takeda/Millennium: Research Funding; Novartis: Research Funding; Signal Genetics: Consultancy; Amgen/Onyx: Consultancy, Speakers Bureau. Shain:Takeda/Millennium: Membership on an entity's Board of Directors or advisory committees, Speakers Bureau; Signal Genetics: Research Funding; Amgen/Onyx: Membership on an entity's Board of Directors or advisory committees, Speakers Bureau; Celgene: Membership on an entity's Board of Directors or advisory committees, Research Funding, Speakers Bureau; Novartis: Speakers Bureau.
Author notes
Asterisk with author names denotes non-ASH members.


This feature is available to Subscribers Only
Sign In or Create an Account Close Modal