Abstract
Introduction: Overall survival after allogeneic hematopoietic cell transplantation (HCT) is dependent on multiple patient, transplant and donor related factors. The national marrow donor program publishes survival outcomes from transplant centers focusing on the first year after allogeneic HCT. The first 12 months post allogeneic HCT carry a high risk of morbidity and mortality as well as a high risk of disease relapse. Many centers use the publically available one year data to advise patients on transplant risks and overall survival. The survival outcomes and the factors that affect these outcomes among allogeneic recipients who are alive and disease free at one year after HCT are not reported. The availability of such information will be of importance to council patients during their first anniversary visit and to identify the subgroup of survivals carrying a higher risk for later morbidity and mortality.
Methods: We analyzed the outcomes of 667 consecutive adult patients at our center who received a first allogeneic transplant between 2005 and 2015. Patients were excluded from this analysis if they had less than one year of follow up (n=54), if died or had relapse of their disease (n=224) prior to the first year post-transplant. Patient characteristics and outcome parameters were extracted from our institutional database where they had been prospectively entered. Kaplan-Meier estimates of overall survival (OS) and disease-free survival (DFS) were calculated and the cumulative incidence method with competing risks was used to calculate rates of non-relapse mortality (NRM) and relapse. Cumulative incidences of acute and chronic GVHD were estimated with death being treated as the competing risk. Cox proportional hazards models, were developed using OS and relapse as endpoints and other parameters as covariates. All survival estimates were reported beyond the 1 year timeframe. GVHD was prospectively documented using established criteria including NIH consensus criteria for chronic GVHD and rates calculated using the cumulative incidence method. All patients were transplanted in the outpatient setting with hospital admissions for complications that could not be handled outpatient.
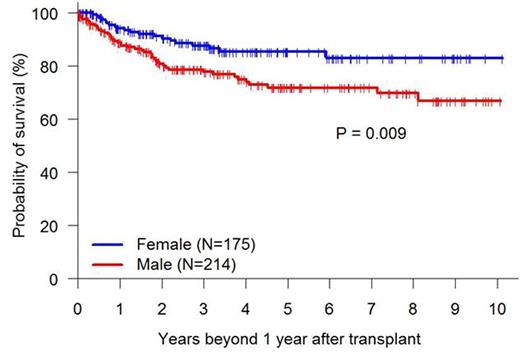
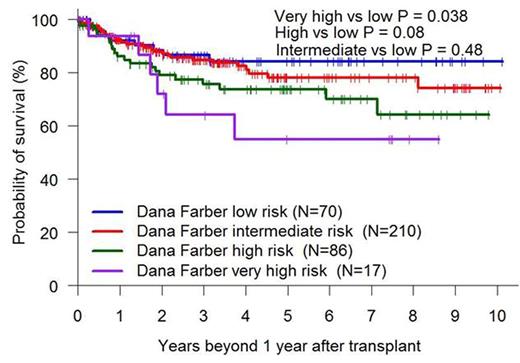
Results: A total of 389 patients were included in the final analysis with a median age of 51 (19-75) years. Patients' characteristics were as follows: male (55%), race (white 77%, black 19%), disease ( AML 34%, ALL 15%, MDS/MPD 23%, NHL 24%), donor type ( MRD 37%, MUD 39%, haplo 24%), conditioning intensity (RIC 74%, myeloablative 53%), cell source ( bone marrow 19%), HCT comorbidity index >=3 (35%) and disease risk index DRI (high/very high 26%, intermediate 24%). The survival estimates at one and three years beyond the first year after transplant were Overall survival 91% and 82%, disease free survival 86% and 78%, transplant related mortality 7% and 12% and relapse of 7% and 10%. After adjusting for age, sex, race, diagnosis, cell source, CMV serostatus, disease risk index, transplant conditioning regimen, donor type, acute and chronic GVHD before 1 year and other significant factors, the cox model on mortality showed that male gender (HR 1.87, p=0.02), need of immunosuppression at 1 year (HR 2.17, p=0.006), and year of transplant (HR 0.62, p=0.026 for patients transplanted in 2013-2015 versus 2005-2009) were associated with higher mortality rate (fig 1). Cox model on relapse showed that male gender (HR 2.09, p=0.036), high/very high DRI (HR 26.40, p=0.002) to be associated with higher relapse whereas developing acute 2-4 GVHD (HR 0.32, p=0.011) or chronic GVHD (HR 0.33, p=0.001) in the first year after HCT was associated with lower relapse rates.
Conclusion: patients who are alive and without relapse at one year post allogeneic HCT have an excellent long term survival and very low chance of disease relapse. A subset of patients with high/very high DRI remain at significant risk of later relapse and should be followed more closely with long term strategies to prevent delayed relapses.
Kaplan-Meier Overall Survival Graphs by Gender, DRI and Year of Transplant
No relevant conflicts of interest to declare.
Author notes
Asterisk with author names denotes non-ASH members.


This feature is available to Subscribers Only
Sign In or Create an Account Close Modal