Abstract
Background:
Gene expression profiling (GEP) is increasingly being integrated into clinical practice for prognostication of multiple myeloma. MyPRSTM utilizes the 70-gene panel with survival data derived from cohorts of myeloma patients treated under intensive clinical trial regimens including tandem transplants. We aim to validate and expand the prognostic impact of GEP characterization of myeloma in patients treated with various anti-myeloma therapies at a single academic center.
Methods:
MyPRSTM GEP analysison bone marrow aspirate sampleswas performed on 417 multiple myeloma patients atMoffitt Cancer Center who had bone marrow examination at different phases in the course of their disease. Myeloma risk prognostication was conducted based on the risk classification (cutoff of score 45.2), risk score (0-100), and molecular subtyping. Trend (Jonckheere-Terpstra) test was performed to evaluate the associations of GEP scores and molecular subtypes. Overall survival (OS) was estimated using the Kaplan-Meier method from the time of GEP analysis and OS curves were compared using the log-rank test. Multivariate Cox proportional hazards regression models were built for OS.
Results:
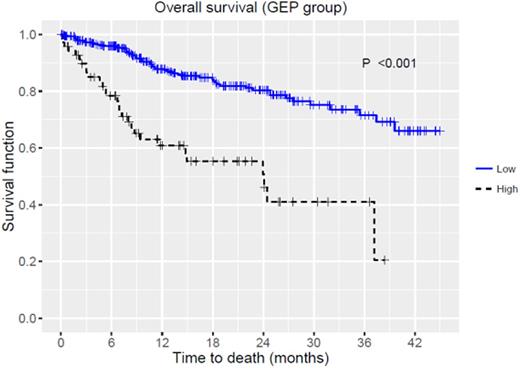
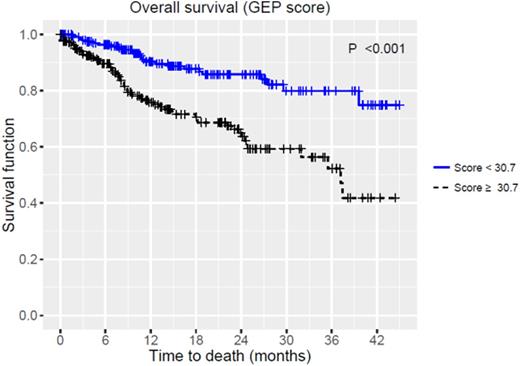
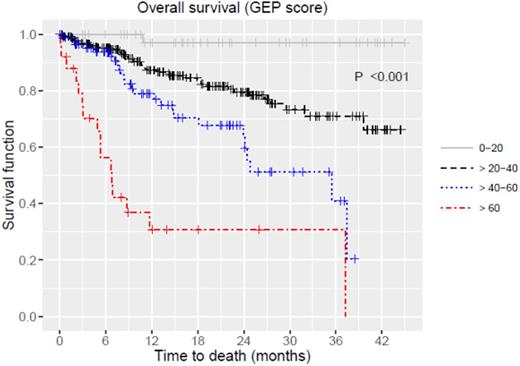
Median age was 62 (range, 21-86), majority of patients were male (57.6%) and 71 patients (17%) had high-risk disease based on GEP with a median score of 30.7 (range, 8.7-99.4). Median time from myeloma diagnosis to GEP was 15.8 (range, 0.1-370.1) months. Molecular subtypes werehyperdiploidy(HY) 25.2%, cycle family (CD)-2 21.1%, low bone disease (LB) 17.5%, proliferation (PR) 13.4%, MMSET associated (MS) 9.8%, MAF associated (MF) 7.7%, and CD-1 5.1%. There was an increasing trend of higher GEP scores among various molecular subtypes from CD to PR (p<0.001). OS estimates for all patients were 75% (95%CI: 70-81%) at 2 years. OS was significantly inferior in patients with high-risk by GEP, 51% (95%CI: 69-37%) vs. 80% (95%CI: 86-75%) at 2 years regardless of disease status (Figure 1, p<0.001). Molecular subtypes predicted OS (p<0.001). When MF, MS and PR subtypes were combined, they had inferior OS compared to others (p<0.001): 67% (95%CI: 58-77%) vs. 90% (95%CI: 87-94%), 53% (95%CI: 43-66%) vs. 85% (95%CI: 80-90%), and 43% (95%CI: 31-60%) vs. 76% (68%-85%) at 1, 2 and 3 years, respectively. When patients were re-classified based on the median GEP score of 30.69, OS was significantly worse for those with GEP scores higher than the median (n=209, p<0.001, Figure 2). When patients were divided into 4 categories ([1] scores 0-20, 20-40, 40-60, 60-100, or [2] quartiles), both were predictive of distinct survival groups (p<0.001 for both, Figure 2). In multivariate analyses fitting the models with GEP score, GEP risk groups and molecular subtypes, GEP score (hazard ratio (HR) 1.05, 95%CI: 1.04-1.07, p<0.001) and GEP risk group (HR 2.39, 95%CI: 1.45-3.95, p<0.001) were the independent predictors of inferior OS.
Conclusions:
Analysis of GEP in myeloma patients irrespective of disease status treated at a single academic institution validates the prognostic significance based on 70-gene GEP score, risk groups and molecular subtyping. Although less robust, GEP risk re-classification with a new threshold value based on the median also demonstrates prognostic significance. Interestingly, parsing of the GEP-70 score by separating patients into different GEP score groups (either in 20-point increments or quartiles) results in distinct groups with distinct survival characteristics suggesting powerful prognostic value of GEP analysis. To this end, a higher GEP score was associated with a worse prognostic score even within the same GEP risk classification. These data indicate the potential for the development of a new risk classification based on GEP score into 4 risk groups. Increased numbers of patients will be required to validate the potential of these score-based risk classifications. In conclusion, our data demonstrate that GEP score remains a powerful prognostic tool regardless of the disease setting.
Nishihori:Signal Genetics: Research Funding; Novartis: Research Funding. Baz:Novartis: Research Funding; Takeda/Millennium: Research Funding; Signal Genetics: Research Funding; Karyopharm: Research Funding; Celgene: Honoraria, Membership on an entity's Board of Directors or advisory committees, Research Funding; Bristol-Myers Squibb: Research Funding; Merck: Research Funding. Van Laar:Signal Genetics, Inc.: Employment. Bender:Signal Genetics, Inc.: Employment. Alsina:Signal Genetics: Consultancy; Novartis: Research Funding; Takeda/Millennium: Research Funding; Amgen/Onyx: Consultancy, Speakers Bureau. Shain:Novartis: Speakers Bureau; Amgen/Onyx: Membership on an entity's Board of Directors or advisory committees, Speakers Bureau; Takeda/Millennium: Membership on an entity's Board of Directors or advisory committees, Speakers Bureau; Signal Genetics: Research Funding; Celgene: Membership on an entity's Board of Directors or advisory committees, Research Funding, Speakers Bureau.
Author notes
Asterisk with author names denotes non-ASH members.


This feature is available to Subscribers Only
Sign In or Create an Account Close Modal