Abstract
Background:
Hematopoietic stem cell (HSC) gene therapy is a new treatment paradigm that can potentially provide lifelong protection against HIV-1 infection. The basic principle is to genetically modify a patient's own HSC such that the progeny, including CD4+T cells and macrophages, are resistant to HIV-1. Given the expected low levels of the anti-HIV gene-marked cells in clinical studies, it is critical to understand how the vast number of HSC, each bearing a unique phenotype, and their mature progeny contribute to maintaining homeostatic regulation in HIV gene therapy settings. We have recently published novel and detailed insights about the long-term behavior patterns of individual HSC followed for 4 to 12 years post-transplant in our nonhuman primate (NHP) model of lentiviral gene therapy, revealing for the first time in primates the precise time point of HSC repopulation and the functional heterogeneity of HSCs (Kim, Cell Stem Cell, 2014; Goyal, BMC Biology, 2015). Consistent clonal behavior patterns have been observed in human gene therapy (Biasco, Cell Stem Cell, 2016), demonstrating the clinical relevance of our data. Here, in order to develop a systems-level understanding of HSC clonal dynamics in anti-HIV therapy settings requiring efficient immune recovery from T lymphopenia, we further analyzed HSC clonal repopulation after T-cell depletion in one of our NHP animals. Our study generated systems-level datasets useful for understanding the parameters of T-cell repopulation and homeostatic regulation in anti-HIV therapy, as well as other therapies requiring efficient immune recovery from disease- or treatment-induced T lymphopenia.
Subjects and Methods:
The HSC clonal behaviors in animal 95E132 have been well characterized for 16 years post-transplant. At the 16-year time point, this animal was treated with 8 doses (25 ug/kg/dose) of an anti-CD3e immunotoxin over 4 days. Hematopoietic recovery after T-cell depletion was monitored by a complete blood count, multi-color flow cytometry analysis, TCRv_ spectratyping, and a high-throughput lentiviral-tagging assay (Kim, Journal of Virology, 2010). HSC subtypes and their clonal behaviors were determined based on the clonal profiling of blood lineages, including CD4, CD8, CD20, CD14, and CD18 cells, over time.
Results:
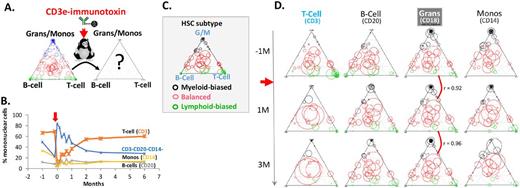
The peripheral CD3+ T cells recovered in 2-3 months (Fig. 1B). Cytotoxic (CD8+) T-cell recovery was faster than that of T-helper cells. Effector and memory T cells expanded promptly after T-cell depletion, whereas the na•ve T cells had not recovered more than one year after CD3e-immunotoxin treatment. Clonal profiling analysis revealed a few dominant clones in the recovered T-cell compartment, while showing no notable clonal fluctuation in the CD18+ granulocytes over time (Fig. 1C-D). TCRv_ spectratyping showed a skewed T-cell receptor repertoire even a year after immunotoxin treatment.
Conclusion:
Our data can bolster our understanding of hematopoietic regulation in patients recovering from T lymphopenia. The data showed skewed a T-cell receptor repertoire and clonal dominance in the recovered T-cells after immunotoxin treatment in an aged animal, suggesting that T-cell recovery had occurred primarily as a result of peripheral T-cell expansion. A systems-level, clonal dynamics study of this extreme form of homeostatic regulation provides unique opportunities to identify and characterize the regenerative pathways, as well as the obstacles, that emerge in the process of restoring homeostasis after disease- or treatment-induced T-cell depletion.
A. Hematopoietic recovery after CD3e-immunotoxin treatment (red arrow) was assessed at the clonal level. B. CD3+ T cells were effectively ablated by immunotoxin treatment. The T-cell percentage rebounded to the normal range by 2-3 months. C. A ternary diagram showing Myeloid-biased (black circles), Balanced (red circles), and Lymphoid-biased (green circles) HSC subtype clones. The relative position of a circle in the diagram indicates the lineage output potential toward G/M (granulocyte/monocyte), B-cell, and T-cell. The size of a circle indicates the relative frequency of a clone. D. The relative frequencies of the HSC clones in T-cell, B-cell, Granulocytes, and monocytes are shown at 1 month before (-1M), 1 month (1M) and 3 month (3M) immunotoxin treatment. The individual clones (circles) are located at the identical positions in C.
A. Hematopoietic recovery after CD3e-immunotoxin treatment (red arrow) was assessed at the clonal level. B. CD3+ T cells were effectively ablated by immunotoxin treatment. The T-cell percentage rebounded to the normal range by 2-3 months. C. A ternary diagram showing Myeloid-biased (black circles), Balanced (red circles), and Lymphoid-biased (green circles) HSC subtype clones. The relative position of a circle in the diagram indicates the lineage output potential toward G/M (granulocyte/monocyte), B-cell, and T-cell. The size of a circle indicates the relative frequency of a clone. D. The relative frequencies of the HSC clones in T-cell, B-cell, Granulocytes, and monocytes are shown at 1 month before (-1M), 1 month (1M) and 3 month (3M) immunotoxin treatment. The individual clones (circles) are located at the identical positions in C.
Dunbar:GSK/Novartis: Research Funding. Chen:Calimmune: Membership on an entity's Board of Directors or advisory committees.
Author notes
Asterisk with author names denotes non-ASH members.


This feature is available to Subscribers Only
Sign In or Create an Account Close Modal