Abstract
Background: Value is defined as health outcomes achieved per dollar spent. While risk-stratified AL HCT survival estimates are made possible by the Stem Cell Therapeutic Outcomes Database (SCTOD), an assessment of healthcare value is not possible as they do not include cost adjustments based upon clinical risk. We report a risk-based cost analysis, modeled on AL pts undergoing HCT at our institution that can potentially serve as a simple, statistically significant risk-based comparison tool.
Methods: All AL pts who underwent HCT at City of Hope between 1/1/2010 and 12/31/2014 were included. Detailed data were captured from multiple electronic record sources in our database. Total direct costs were assessed for each pt from 14 days prior to 100 days post HCT. Categorical data were tested for associations by Chi-square; continuous data that were normally distributed were tested by T-test, while non-normal data were tested by Wilcoxon rank sum test. Univariate and multivariable logistic regression models were used to identify predictors associated with HCT costs ≥ median and ≥ 80th percentile. Univariate and multivariable Cox proportional hazards regression were used to identify predictors of overall survival (OS). All p-values were 2-sided with alpha level of 0.05.
Results: This analysis included 389 pts (AML 352; ALL 37); median age was 52.5 years (yr) [range 1-74; 107 (27.5%) age ≥ 60]; 48% were female. At the time of HCT 204 (52%) were in 1st complete remission [CR], 87 (22%) in 1st relapse (rel)/2nd CR, and 98 (25%) >2nd CR/Induction Failure [IF]; ECOG performance status was ≥1 in 29.5% and Sorrer comorbidity score ≥1 in 56%. 214 (55%) and 175 (45%) received myeloablative (MAC) or reduced intensity (RIC) conditioning regimen, respectively; 231 (59%) had matched unrelated donor [MUD] or mismatched related donor (MRD) HCT. Graft-versus-host prophylactic (GVHD) regimen consisted of tacrolimus/sirolimus for 80% pts. 207 pts were enrolled on a therapeutic intervention trials and 121 had Medicare and/or Medicaid (Medi-Cal) as payer.
Median follow-up was 12.9 months. The estimated 1- yr unadjusted OS for the entire group post-HCT was 71% (95% CI 66%-75%), 80% (74%-85%) for pts in 1st CR, 68% (57%-77%) for pts in 1st rel/2nd CR, and 56% (45%-65%) for pts >2nd CR/ IF. OS was similar for sibling matched and MUD/MRD transplants (1-yr OS 73% vs. 70%).
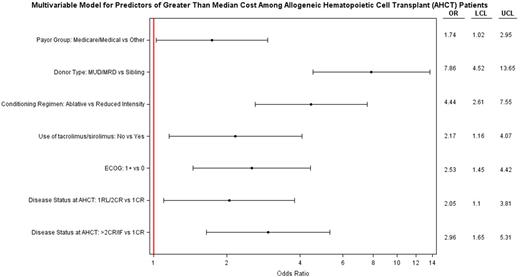
In a multivariable analyses, disease status, MUD/MRD donor, MAC regimen, GVHD prophylaxis other than tacrolimus/sirolimus, ECOG ≥1, and Medicare and/or Medicaid as payer significantly predicted for cost ≥ median (Figure1A). Using Akaike Information Criterion (AIC) scores, donor type and disease status at HCT were found to be more informative variables with regard to higher cost of HCT.
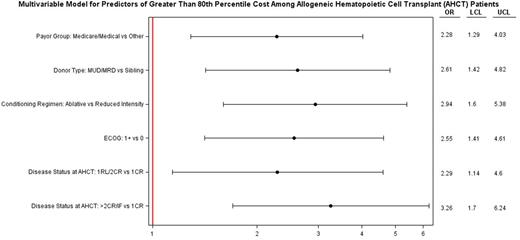
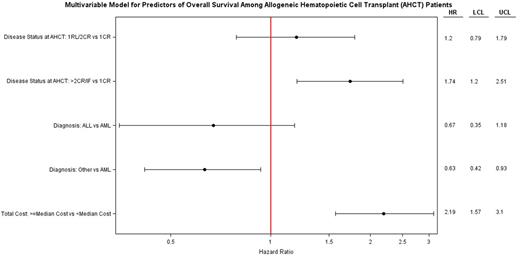
Disease status, MUD/MRD, MAC regimen, Medicare and/or Medicaid as payer and ECOG ≥1 also significantly predicted cost ≥ 80th percentile (Figure1B). In a multivariable analysis for OS (Figure 1C) , only >2nd CR/IF and HCT cost exceeding median had significantly higher hazard of death. Of note, despite reaching statistical significance in univariate analysis age, cytogenetics, treatment on protocol, and Sorrer score lost significance in adjusted higher costs and OS multivariable models.
Conclusions: Our data suggest that: 1. Higher levels of care complexity drive higher costs, 2. Patients with more advanced disease status and inferior performance status have higher costs, 3. Statistically significant drivers of higher care costs are predictable prior to HCT. These risk factors are easily abstractable from medical records and provide prospective, equitably comparisons of risk-based costs between transplant centers. These data compliment the outcomes data available from the SCTOD and may enable providers and payers to make meaningful value comparisons between transplant centers. They may also help establish alternative models for payer contracting that include consideration of clinical risk-stratification. Of note, given the favorable survival outcomes of pts with higher cost-risk features (i.e., advanced disease status at HCT and MUD/MRD), the higher care costs associated with effective care of higher complexity pts are justified. While validation of this model is necessary using large payer or multi-institutional databases, we propose that similar clinical-economic models can be created for pts with other blood cancers requiring high complexity care.
Forman:Mustang Therpapeutics: Other: Construct licensed by City of Hope.
Author notes
Asterisk with author names denotes non-ASH members.


This feature is available to Subscribers Only
Sign In or Create an Account Close Modal