Abstract
Introduction
Acute myeloid leukemia (AML) with hyperleukocytosis (HL), commonly defined as white blood cell (WBC) counts >100,000/uL, are intuitively thought as a unique group with dismal prognosis. However, comprehensive studies regarding the clinical characteristics, genetic alterations in this group of patients are limited, and the role of hematopoietic stem cell transplantation (HSCT) is controversial.
Method
A cohort of 755 de novo AML patients diagnosed from 1994 to 2011 who had cryopreserved cells for analysis were enrolled. The mutation status of 18 genes was determined by Sanger sequencing and/or next generation sequencing (NGS). We compared cytogenetics and relevant mutations in these genes between AML patients with and without HL, and exposed their prognostic implications.
Results
The median age was 54 (range 15-94). 101 (13.4%) patients had HL. HL was associated with younger age (median age 47 vs. 54, P=0.022), higher peripheral blast percentage (77.6% vs. 39%, P<0.0001), and higher lactate dehydrogenase levels (1921.5 U/L vs. 778 U/L, P<0.0001). HL was correlated with French-American-British (FAB) M1, M4 or M5 subtypes, but inversely with M2 or M3 subtypes. The HL patients had more frequently AML with intermediate-risk cytogenetics (85.4 vs. 63.6%, P< 0.0001), but less commonly good-risk (9.3 vs. 21.7%, P=0.004) or poor-risk cytogenetic AML (5.2 vs. 14.6%, P=0.01). Specifically, HL occurred less frequently in core-binding factor AML, or complex karyotype. The most common molecular event in the patients with HL was FLT3/ITD (38.9%), followed by NPM1 (28.7%), CEBPA (26%), NRAS (20.9%), and TET2 (19.4%) mutations. The HL patients had significantly higher incidences of NPM1 (28.7% vs. 18.2%, P=0.013), FLT3/ITD(38.9% vs. 19.1%, P<0.0001), CEBPA (26% vs. 11.1%, P<0.0001), and TET2 (19.4% vs. 9.9%, P=0.006) mutations. In contrast, HL was mutually exclusive with KRAS mutations.
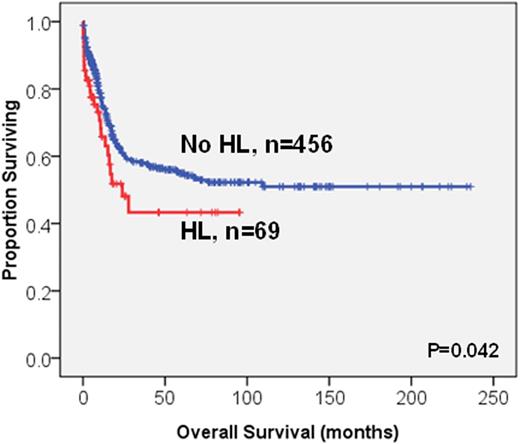
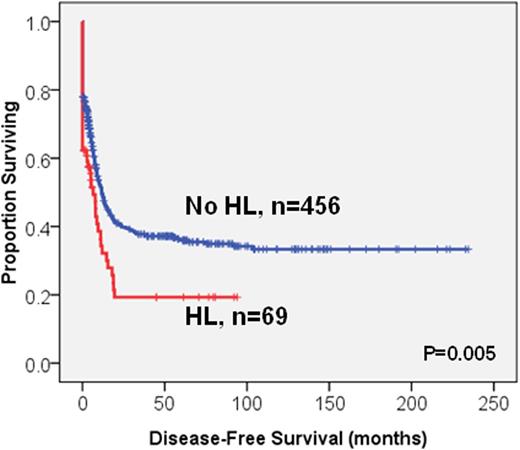
Survival analysis was performed on the 525 patients who received standard intensive chemotherapy; among whom 69 patients had HL. The HL patients had lower complete remission (CR) rates compared to those without (63.8% vs. 78.2%, P=0.009). Further, the HL patients had significantly poorer overall survival (OS) and disease-free survival (DFS) than those without (median 24 months vs. not reached (NR), P=0.042; 6.5 vs. 11.8 months, P=0.005, respectively, Figure 1). Older age, poor-risk cytogenetics, RUNX1, TP53 and WT1 mutations were other poor prognostic factors for OS (median, 18.1 months vs. NR, P<0.0001; 8.5 months vs. NR, P<0.0001; 18 months vs. NR, P=0.001; 5.9 months vs. NR, P<0.0001; 14.0 months vs. NR, P=0.006, respectively) and DFS (median, 7.7 vs. 15.2 months, P=0.005; 0 vs. 12,2 months, P<0.0001; 5.2 vs. 12 months, P=0.001; 0 vs. 11.8 months, P<0.0001; 6.5 vs. 12 months, P=0.001, respectively). NPM1+/FLT3-ITD-, and biallelic CEBPA mutations were favourable prognostic factors for both OS and DFS. In the multivariate Cox proportional hazards regression analysis, HL was still an independent poor prognosis factor for OS and DFS (RR, 1.67; 95% CI, 1.15-2.43, P=0.007 and RR, 1.58; 95% CI, 1.12-2.25, P=0.010, respectively). Intriguingly, among the HL patients, those with HSCT had longer OS than those without (58.2 vs 10.7 months, P=0.004, Figure 2). Among the 172 patients receiving allogeneic HSCT, the poor prognostic impact of HL on OS and DFS was lost (P=0.832 and P=0.678, respectively). HSCT could ameliorate the poor survival impact of HL.
Conclusion
The HL patients represented 13.4% of our AML cohort and showed distinct clinic features and genetic alterations compared to those without HL. HL was an independent poor prognosis factor irrespective of cytogenetics change or mutation status, and the HL patients may potentially benefit from HSCT.
The Kaplan-Meier survival curves for OS (A) and DFS (B) stratified by hyperleukocytosis (HL) or not in the 525 AML patients who received standard intensive chemotherapy
(A)
(B)
The Kaplan-Meier survival curves for OS (A) and DFS (B) stratified by hyperleukocytosis (HL) or not in the 525 AML patients who received standard intensive chemotherapy
(A)
(B)
The Kaplan-Meier survival curves for OS stratified by HSCT or not in the 69 HL patients who received standard intensive chemotherapy
The Kaplan-Meier survival curves for OS stratified by HSCT or not in the 69 HL patients who received standard intensive chemotherapy
No relevant conflicts of interest to declare.
Author notes
Asterisk with author names denotes non-ASH members.


This feature is available to Subscribers Only
Sign In or Create an Account Close Modal