Abstract
Simonsen & al 2016
Detailed characterization of sparse cancer subpopulations and single cells by next generation sequencing (NGS) modalities is rapidly gaining momentum, possibly yielding valuable information for personalized therapy. On the other hand, exome sequencing generally displays low coverage compared to targeted panels, target bias and broader allele frequency spectrums in contrast to whole genome sequencing (WGS). While single cell resolution is the ultimately feat for characterization of discrete subclonal contribution to leukemogenesis it is clear that allelic dropout generally occurs with high frequency, when performing whole genome amplification (WGA) and sequencing of single cells.
Here, we hypothesized that detailed genomic profiling can be resolved from a minimal number of leukemic cells following WGA. We aimed to determine the cell number threshold by conventional laboratory analyses, and to elucidate what resolution to expect from whole exome sequencing (WES) at relatively low coverage.
Methods
6 single cells from the OCI-AML3 cell line were extracted manually by micromanipulation under a dissection microscope using a fine glass pipette, along with triplets of 2, 5 and 10 cells for microsatellite genotyping, along with serial dilutions to approximately 25 and 50 cells. Analysis encompassed 21 short tandem repeat loci, of which 18 are heterozygous in this cell line. Also, fragment analysis of NPM1W288fs mutation and qPCR of the DNMT3AR882Cmutation were performed after WGA (REPLI-g Single Cell Kit, Qiagen, Hilden, DE).
For sequencing micromanipulated 5-cell assays were manually prepared, including samples with 25 and 50 cells as described above. Doublet samples underwent WGA and WES (Aros Applied, Eurofins, Aarhus, DK). Library preparation was performed by the vendor using Nextera Rapid Capture 37Mb kit (Illumina, San Diego, CA, USA). The six samples were whole exome sequenced aiming at a theoretical depth of 90x and data processed in parallel with Genome Analysis ToolKit (GATK 3.6, Broad institute, Cambridge, MA, USA) and CLC Biomedical Workbench 2 (Qiagen, Aarhus, DK). Copy number variations were resolved by chromosomal variant allele frequency (read depth threshold > 39) assessment and kernel density estimation.
Results
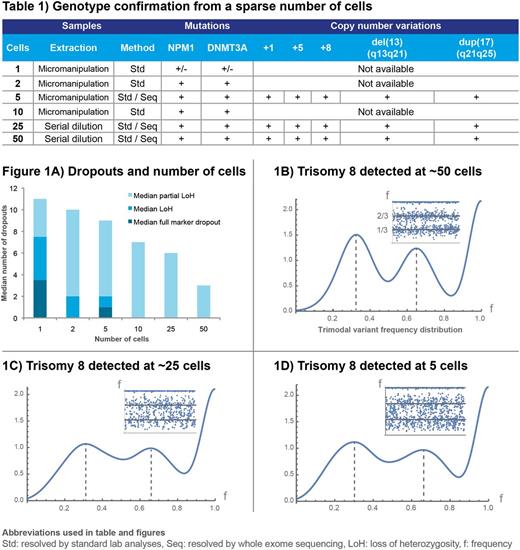
DNA yield from the WGA was approximately 35μg. NPM1 and DNMT3A mutations were detected by fragment analysis and qPCR, respectively. Microsatellite genotyping of single cells showed recurrent allele dropout compared to 2, 5 and 10 cells etc. The positive correlation between quality and cell number using microsatellite genotyping is shown in Fig. 1A. Detection of DNMT3AR882Cmutation was consistent from 2 cells and up.
A mean of 9.4x10⁷ reads was achieved (8.3-12.7x10⁷) from exome sequencing with 99.3% of the sequences mapped to human reference genome GRCh37. NPM1 type A somatic mutation with insertion of tetranucleotide TCTG, leading to known somatic frameshift p.W288fs and somatic DNMT3AR882C, were detected in all sequenced subsets with 16 of 44 to 19 of 43 reads, respectively, and mean allele frequency of 41.5% (25.9-75%) and 44.5% (31.3-57.1%). All OCI-AML3 cell line copy number variations (CNVs) were confirmed (Table 1), although very noisy distributions were observed in samples with 5 cells (Fig. 1B-D). Additional lesions were also found, possibly acquired in culture or revealing inadequate characterization of the cell line, adding NRASQ61L, +7q, del(1p) and del(19q). As the latter deletions have not been described by conventional cytogenetics, these may be copy-neutral loss of heterozygosity (LoH).
Discussion & conclusion
This study fills a gap in evaluating the feasibility of detecting somatic mutation and CNVs from extremely small amount of biological material, quantitatively and qualitatively. By choosing a very low number of cells from a well-characterized leukemia cell line we have simulated genomic profiling of a small subpopulation contributing to a more detailed picture of the cell biology. In perspective, this approach is applicable in direct combination with flow cytometry and for minimal residual disease characterization.
No relevant conflicts of interest to declare.
Author notes
Asterisk with author names denotes non-ASH members.


This feature is available to Subscribers Only
Sign In or Create an Account Close Modal