Abstract
Introduction: Risk stratification in acute promyelocytic leukemia (APL) is based on clinical parameters, namely leukocyte and platelet counts at initial diagnosis as combined in the Sanz Score. However, during the last years the influence of additional molecular genetic markers on prognosis of APL patients has been postulated. In 2015 we published the results of a molecular risk score integrating expression data of the genes brain and acute leukemia, cytoplasmic (BAALC), ets' related gene (ERG) and Wilms' Tumor 1 (WT1) with strong independent influence on outcome and relapse risk of APL patients treated in the German AMLCG studies (Hecht et al., Leuk Res 2015). The aim of our study was to validate our data in an independent patient cohort.
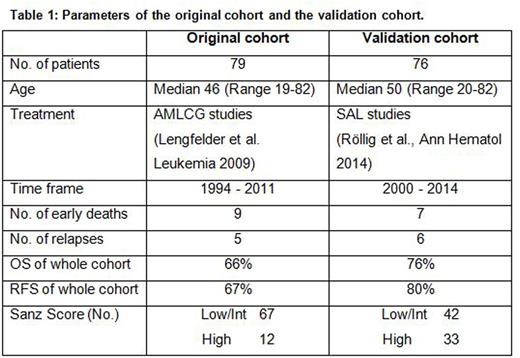
Methods: In cooperation with the German SAL (Study Alliance Leukemia) group we obtained a validation set of samples of mononuclear cells derived from the bone marrow of 76 patients with confirmed diagnosis of APL prior to therapy. The validation cohort consisted of 37 female and 39 male patients with a median age of 50 years (range 20-82 years; Table 1). Patients were diagnosed and treated between 2000 and 2014 mostly with an ATRA plus Idarubicin based induction therapy followed by Sanz score-dependent consolidation and maintenance chemotherapy. RNA was extracted using the AllPrep DNA/RNA Mini Kit and cDNA was synthesized using 500µg of RNA with a QuantiTect Reverse Transcription Kit (both Qiagen, Hilden, Germany). Expression levels of BAALC, ERG and WT1 were then analyzed using quantitative real-time RT-PCR with the same conditions and primers as used in the original test cohort and the same calibrator cDNA from cell lines was used for the analysis. The following gene expression levels were defined as negative risk factors in preceding studies: BAALC expression ≥25th percentile (BAALChigh), ERG expression ≥75th percentile (ERGhigh) and WT1 expression ≤25th percentile or ≥75th percentile (WT1low or high). The integrative risk score was calculated as described before: For the presence of one of the mentioned risk factors, one scoring point was assigned to a respective patient, i.e. a maximum of 3 points (one point for BAALChigh, ERGhigh and WT1low or high, respectively) and a minimum of 0 points (i.e. presenting with none of the aforementioned risk factors). Overall survival (OS), relapse free survival (RFS) and cumulative incidence of relapse (CIR) were calculated using the Kaplan-Meier method.
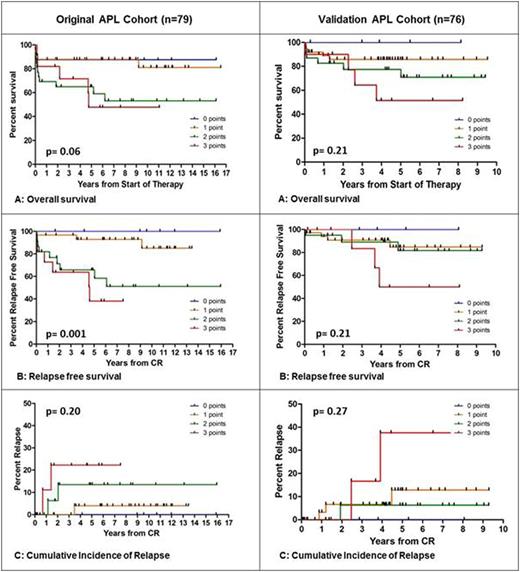
Results: The expression of the three genes BAALC, ERG and WT1 compared to healthy controls were exactly the same as in the original cohort. Application of the molecular risk score on APL patients of the validation cohort clearly discriminated patients according to their risk comparable to the original APL cohort (Figure 1). Patients with 0 points had a very good prognosis with no deaths or relapses, whereas patients with 3 points (i.e. concurrent presence of all three risk factors) had a very poor outcome with an OS of 51%, a RFS of 50% and a CIR of 38%. The differences between patients with 1 and 2 points were less pronounced in the validation cohort. However, the statistical analyses in the validation cohort did not yield significance. As the main reason we assume that the validation cohort altogether showed a significantly improved OS and RFS compared to the original cohort which was treated a decade earlier, so differences between the subgroups could not be that pronounced. For both cohorts stratification by the Sanz Score did not show significant differences in outcome (analysis for RFS p=0.46 in original cohort and p=0.44 in validation cohort).
Conclusion: A validated molecular-based integrative risk score was able to define subgroups of APL patients with different outcome independently of the Sanz score. The validation of the strong influence of the combination of molecular risk factors is particularly interesting as the new analyses of the three genes BAALC, ERG and WT1 separately did not confirm the strong results of the single analyses of each gene. The discrimination of patients according to the risk score is evident though. This argues for their integration in future studies.
Comparison of the original cohort and the validation cohort. Discrimination by the integrative risk score (0-3points) for OS, RFS and CIR.
Comparison of the original cohort and the validation cohort. Discrimination by the integrative risk score (0-3points) for OS, RFS and CIR.
No relevant conflicts of interest to declare.
Author notes
Asterisk with author names denotes non-ASH members.


This feature is available to Subscribers Only
Sign In or Create an Account Close Modal