

Key Points
BCR clustering and B-cell spreading were decreased in WAS memory B cells.
CD19-Btk–mediated signaling was decreased, and FcγRIIB-SHIP–mediated signaling was increased in WAS memory B cells.
Abstract
Wiskott-Aldrich syndrome (WAS) pediatric patients exhibit a deficiency in humoral immune memory. However, the mechanism by which Wiskott-Aldrich syndrome protein (WASP) regulates the differentiation and activation of memory B cells remains elusive. Here we examine the early activation events of memory B cells from the peripheral blood mononuclear cells of WAS patients and age-matched healthy controls (HCs) using total internal reflection fluorescence microscopy. In response to stimulation through the B-cell receptor (BCR), memory B cells from HCs showed significantly higher magnitudes of BCR clustering and cell spreading than naive B cells from the same individuals. This was associated with increases in CD19 recruitment to the BCR and the activation of its downstream signaling molecule Btk and decreases in FcγRIIB recruitment and the activation of its downstream molecule Src homology 2-containing inositol 5′ phosphatase (SHIP). However, these enhanced signaling activities mediated by CD19 and Btk are blocked in memory B cells from WAS patients, whereas the activation of FcγRIIB and SHIP was increased. Although the expression levels of CD19, Btk, and FcγRIIB did not change between CD27− and CD27+ B cells of HCs, the protein and mRNA levels of CD19 but not Btk and FcγRIIB were significantly reduced in both CD27− and CD27+ B cells of WAS patients, compared with those of HCs. Overall, our study suggests that WASP is required for memory B-cell activation, promoting the activation by positive regulating CD19 transcription and CD19 recruitment to the BCR.
Introduction
B-cell receptor (BCR) signaling is indispensable for B cells to exert immunological functions.1 Antigen stimulation promotes the aggregation of BCRs and subsequent activation of downstream signaling molecules, such as Lyn, Syk, Btk, and PLCγ2.2,3 Most antigens that B cells encounter in vivo are membrane-associated antigens (mAgs) and are presented by follicular dendritic cells,4 dendritic cells,5,6 and macrophages.7,8 mAgs are more competent in triggering B-cell activation than soluble antigens.9 Antigens presented on lipid bilayers have been commonly used as a model system to mimic mAgs in vitro. The early events of B-cell activation stimulated by mAgs in vitro have been well characterized with the development of advanced imaging techniques.10-12 The formation of BCR microclusters is essential for the initiation of BCR signaling. Surface BCRs are organized with tight but inhibitory nanoscale oligomers before activation. Antigen stimulation can drive the coalescence of nanoclusters into microclusters.13,14 BCR clustering and B-cell spreading are regulated by BCR signaling. B cells lacking any of signaling molecules, CD19, PLCγ2, Vav, or Rac, are defective in BCR clustering and B-cell spreading.15-17 The cytoplasmic domain of CD19 associating with Lyn can mediate the activation of phosphatidylinositol 3-kinase (PI3K) upon phosphorylation.18,19 The recruitment of Btk to the plasma membrane and its activation requires Src family protein kinases and PI3K activation.20-24 CD19 knockout (KO) B cells are significantly defective in BCR signaling, B-cell spreading, and BCR microcluster formation.16 In our previous studies, we have reported that the Tec kinase, Btk, is critical for the activation of the actin regulator–Wiskott-Aldrich syndrome protein (WASP), B-cell spreading, and BCR clustering.25
Memory B cells are a subpopulation of B cells formed in germinal centers (GCs) after infection and are critical to mount a robust secondary immune response.26,27 Most of naive follicular B cells differentiate into plasma cells after clonal expansion, and a small fraction persists as dormant memory B cells after having gone through GC reaction.28 CD27, a membrane protein belonging to the tumor necrosis family receptor, is considered to be the marker of human memory B cells and is associated with somatic mutations in immunoglobulin variable genes.29-31 The BCR clustering and pSyk accumulation in the interface between the B cells and lipid bilayer are increased in immunoglobulin G+ (IgG+) B cells compared with IgM+ cells.32 Mechanistically, the intrinsic property of cytoplasmic tail of IgG1 could enhance the oligomerization, microclustering, and initiation level of BCR signaling in contrast to that of IgM in response to mAgs.33,34 Although it is known that Wiskott-Aldrich syndrome (WAS) patients exhibit defective memory B-cell responses, no data are published on early activation events in WAS memory B cells to date.
WAS pediatric patients exhibit decreased immature B cells in the bone marrow and increased T1 cells in the periphery.35 WAS memory B cells proliferate slowly in vivo, show reduced somatic hypermutation, and preferentially use autoimmune genes.35 Ex vivo, B cells from WAS patients show defective motility, migration, adhesion, and morphological changes.36 In contrast, WASP KO mice do not have developmental defects in the bone marrow, but instead show significantly reduced marginal zone and B1a B cells in the periphery, which has been associated with impaired integrin function.37 WASP KO mice mount a reduced response to T-cell independent and T-cell dependent antigens.36 B cells from WASP KO mice are hyperresponsive to BCR and TLR signals in vitro, which leads to the cell intrinsic autoimmunity.38 Both mouse and human WASP+ B cells show selective advantage in vivo.37 The underlying molecular mechanism linking BCR signaling to the defective B-cell functions in WAS patients is unknown.
In this study, we investigated the early activation of WAS memory B cells and found the noncompetent activation upon mAg stimulation. First, we demonstrate that, unlike in healthy controls (HCs), WAS memory B cells fail to mount increased B-cell activation compared with naive B cells. Furthermore, we examined the molecular mechanism and found WAS memory B cells have severe disruption of the CD19-Btk–mediated signaling and increased accumulation of FcγRIIB–Src homology 2-containing inositol 5′ phosphatase (SHIP)–mediated negative signaling. Finally, we suggest that WASP can positively regulate CD19 transcription. Our study has provided a novel mechanism to explain why WAS patients exhibit defective memory B-cell responses.
Materials and methods
Patients and control subjects
From 2014 to 2015, a total of 15 Chinese patients with WAS mutations from 15 unrelated Chinese families were enrolled in the present study. The diagnosis of WAS was made based on clinical signs and symptoms, WAS mutations, and WASP expression measured by flow cytometry analysis, as previously described.39 Healthy control subjects consisted of 15 age-matched subjects (average age). Signed consent from all the children’s parents was obtained under the approval of the Ethics Committee of the Children’s Hospital of Chongqing Medical University.
Luciferase assay
The promoter region of cd19 was amplified according to the designed primers (5′-agtcgctagcaggtgtaaaataaggtcagagcctgg, 3′-agtc aagctt ggtagccaggctccctgg) and cloned into pGL3-basic vector, named pGL3-CD19. Transfected together were 0.45 μg pGL3-CD19 with 0.45 μg pcDNA3.1-WASP and 0.045 μg internal control plasmid-pRL-TKB into 293 cells with 70% confluence in a 24-well plate by using TransIT-293 transfection reagent (Mirus Bio Corporation). After 24 hours of transfection, cells were lysed, and luciferase assay was performed by using firefly luciferase reporter gene assay kit (Beyotime).
Phosflow
Enriched B cells from peripheral blood mononuclear cells (PBMCs) were incubated with monobiotinylated Fab′ fragment of anti-human IgG+M (mB-Fab′-anti-Ig) plus streptavidin at 37°C for varying lengths of time. Cells were fixed with Phosflow Lyse/Fix buffer, followed by permeabilization with Phosflow Perm buffer III (BD Biosciences) and staining with the following antibodies: PE-anti-Erk (T202/Y204, BD Biosciences) and PE-anti-Btk (Y551, BD Biosciences).
Preparation of antigen-tethered planar lipid bilayers and monobiotinylated Fab′ Ab and model antigens
Antigens presented on lipid bilayers have been set up according to previous published protocols.40
Total internal reflection fluorescence microscopy
Images were acquired according to the previous protocol.40
Statistical analysis
Statistical significance was assessed using the Mann-Whitney U test by Prism software (GraphPad Software). The P values were determined in comparison with HCs naive or memory B cells (*P < .01).
Results
Clinical features in patients with WAS
From April 2014 to June 2015, a total of 15 patients diagnosed in our center enrolled in our study. The median age at sample collection for both HCs and WAS patients was 1 year (range, 0.25–6 years and 0.1–5.5 years, respectively); the difference in age between the 2 groups was not significant (Mann-Whitney U test). The clinical characteristics of the patients are shown in Table 1. Among the 15 patients (P1-15), 3 had a score of 2 (X- linked thrombocytopenia) and 3 had a score of 5A, as they had developed an autoimmune disease. No malignancies were found in our cohort. WASP expression was absent in 11/15 (73%) patients (P1-4, P6-7, P9, P11, and P13-15). A decreased level of WASP was detected in 2 patients (P10 and P12). Two patients (P5 and P8) exhibited reduced WASP expression in a fraction of PBMCs, and no WASP expression in the remaining PBMCs due to the reverse mutation.
Clinical characteristics of 15 WAS patients
| Patient ID | Age at sample collection | Clinical score | Protein expression | Exon location | WAS gene mutation | Codon change or predicted splicing abnormality | Auto antibody | B-cell number ×108/L |
|---|---|---|---|---|---|---|---|---|
| P1 | 2 y, 1 mo | 5A | Absent | Exon 4 | 431 G>A | E133K | Present | 4.523 |
| P2 | 3 y, 4 mo | 2 | Absent | Exon 2 | 201 C>T | A56V | Absent | 2.394 |
| P3 | 1 y, 2 mo | 3 | Absent | Exon 1 | 71 C>T | R13X | Absent | 8.75 |
| P4 | 5 y, 6 mo | 4 | Absent | Exon 7 | 665 C>T | R211X | Absent | 4.678 |
| P5 | 3 y, 6 mo | 3 | Double peak | Exon 1 | 71 C>T | R13X | Absent | 3.682 |
| P6 | 4 y, 2 mo | 3 | Absent | Exon 10 | 1092 del C | P353fsX444 | Absent | 1.44 |
| P7 | 4 y, 5 mo | 3 | Absent | Exon 4 | 431 G>A | E133K | Absent | 3.567 |
| P8 | 7 mo | 3 | Double peak | Exon 7 | 665 C>T | R211X | Absent | 9.112 |
| P9 | 2 y | 5A | Absent | Exon 1-2 fragment deletion | 1412 C>T | P460S | Present | 4.2 |
| P10 | 4 y, 9 mo | 2 | Decreased | Exon 2 | 257 G>A | V75M | Absent | 6.495 |
| P11 | 3 mo | 4 | Absent | Exon 10 | 995 C>T | R321X | Absent | 2.052 |
| P12 | 1 mo | 3 | Decreased | Exon 1 | 125 G>A | E31K | Absent | 4.563 |
| P13 | 1 y, 9 mo | 5A | Absent | Intron 8 | IVS8+2 ins T | Present | 6.2128 | |
| P14 | 1 y, 5 mo | 3 | Absent | Intron 8 | IVS8+1 G>A | Absent | 6.28 | |
| P15 | 6 mo | 2 | Absent | Exon 10 | 1268-1269 ins CC | P413fsX445 | Absent | 2.3835 |
BCR clustering and B-cell spreading are reduced in WAS memory B cells
To determine the effect of WASP deficiency on the early activation of PBMCs, we examined the BCR clustering and B-cell spreading in HCs and WAS patients’ B cells upon stimulation with mAgs by total internal reflection fluorescence microscopy (TIRFM). Memory B cells were distinguished from naive B cells by CD27 staining. In HCs, the contact area between naive B cells and the antigen-containing lipid bilayer increased for 5 minutes after initial contact and started to contract afterward (Figure 1A,E). In HCs memory B cells, the contact area changes had a similar dynamic trend as that of HCs naive B cells but the contact area was significantly increased compared with that of HCs naive B cells (Figure 1A,C,E; supplemental Figure 1A, available on the Blood Web site). The contact area of WAS naive B cells behaved similarly as HCs naive B cells (Figure 1A-B,E; supplemental Figure 1A). Surprisingly, the contact area of WAS memory B cells was significantly decreased compared with that of HCs memory B cells, showing no increase in the contact area compared with WAS naive B cells (Figure 1A-E; supplemental Figure 1A). For BCR clustering determined by mean fluoroscence intensity (MFI), the MFI in the contact area of HCs naive B cells area gradually increased and reached a plateau at 5 minutes (Figure 1A,F). The MFI in the contact zone of HCs memory B cells was significantly increased compared with that of HCs naive B cells (Figure 1A,C,F; supplemental Figure 1B). However, the MFI in the contact zone of WAS memory B cells was drastically decreased compared with that of HCs memory B cells and remained similar to the BCR clustering level of WAS naive B cells (Figure 1B-D,F; supplemental Figure 1B). In order to exclude the effect of WASP deficiency on the BCR intensity, we examined the BCR intensity by using CD79α antibody, and no difference was found between HCs and WAS patients (Figure 1G). Collectively, these results suggest that WASP deficiency fails to promote the increase of BCR clustering and B-cell spreading from naive B cells to memory B cells.
![B-cell spreading and BCR clustering were reduced in WAS memory B cells. (A-D) TIRFM and interference reflection microscopy (IRM) analysis of PBMCs (P1-12) that were incubated with membrane-tethered Fab′–anti-Ig, HCs naive B cells (A), WAS naive B cells (B), HCs memory B cell (C), and WAS memory B cells (D). Shown are representative images from 1, 3, 5, and 7 minutes. Bar, 2.5 µm. The average values (±standard deviation [SD]) of the MFI of Fab′–anti-Ig in the B-cell contact zone (E) and of the B-cell contact area (F) were determined using TIRFM and IRM images from >300 individual cells of 3 individual experiments. (G) Flow cytometry analysis of the MFI of CD79α in naive or memory B cells of HCs and WAS patients (P1-12). *P < .01, compared with HCs naive B cells.](https://ash.silverchair-cdn.com/ash/content_public/journal/blood/128/13/10.1182_blood-2016-03-703579/6/m_1723f1.png?Expires=1769775934&Signature=T8Vtodbctj-qpTseP4Lhz8xKXnbad9EGY~9IjxRVwv9e7UDQ6pnTKoBjzD5GW8IXa1iYnTJSNFTYyyZGp1eu8LxHpg~3jSaPR-x1OLvfTg~H6A1ITR0CbWn99FLu8Xj1eG6wSLKJnzoqAlahM9qW2NiSILcEli7rEvE9n14vIBG8dzXH5v8xDTZt5nEzsz75fNHHoIBxbjKOMUgYpuCFe0zWgg1ffHpBIw1t6KkmlvdaAoz8HMIGb6Ny04gUMGmI8grbuNX8WSfSA0crQYI8p2clfZPkUHw6eOXNEh0I5vSLJXNC3zhzdWrYdxN2gZOZI7ysWlBmZqyRmum~h2yRZQ__&Key-Pair-Id=APKAIE5G5CRDK6RD3PGA)
B-cell spreading and BCR clustering were reduced in WAS memory B cells. (A-D) TIRFM and interference reflection microscopy (IRM) analysis of PBMCs (P1-12) that were incubated with membrane-tethered Fab′–anti-Ig, HCs naive B cells (A), WAS naive B cells (B), HCs memory B cell (C), and WAS memory B cells (D). Shown are representative images from 1, 3, 5, and 7 minutes. Bar, 2.5 µm. The average values (±standard deviation [SD]) of the MFI of Fab′–anti-Ig in the B-cell contact zone (E) and of the B-cell contact area (F) were determined using TIRFM and IRM images from >300 individual cells of 3 individual experiments. (G) Flow cytometry analysis of the MFI of CD79α in naive or memory B cells of HCs and WAS patients (P1-12). *P < .01, compared with HCs naive B cells.
B-cell spreading and BCR clustering were reduced in WAS memory B cells. (A-D) TIRFM and interference reflection microscopy (IRM) analysis of PBMCs (P1-12) that were incubated with membrane-tethered Fab′–anti-Ig, HCs naive B cells (A), WAS naive B cells (B), HCs memory B cell (C), and WAS memory B cells (D). Shown are representative images from 1, 3, 5, and 7 minutes. Bar, 2.5 µm. The average values (±standard deviation [SD]) of the MFI of Fab′–anti-Ig in the B-cell contact zone (E) and of the B-cell contact area (F) were determined using TIRFM and IRM images from >300 individual cells of 3 individual experiments. (G) Flow cytometry analysis of the MFI of CD79α in naive or memory B cells of HCs and WAS patients (P1-12). *P < .01, compared with HCs naive B cells.
Activated Btk recruitment is decreased in the contact zone of WAS memory B cells
BCR clustering and B-cell spreading augment the activation of BCR signaling. In order to determine the effect of WASP deficiency on the signalosome recruitment of PBMCs upon mAg stimulation, we examined the total level of BCR signaling– protein tyrosine phosphorylation (pY), and the phosphorylation of key positive and negative upstream signaling molecules, Btk and SHIP-1, by using antibodies for their phosphorylated forms. In HCs naive B cells, the recruitment of pY peaked at 3 minutes and decreased by 7 minutes (Figure 2A,E). In HCs memory B cells, pY also peaked at 3 minutes and decreased by 7 minutes, but the level in the contact zone was significantly increased compared with that of HCs naive B cells (Figure 2A-B,E; supplemental Figure 1C). However, the levels of pY in the contact zone of either WAS naive or memory B cells were similar to each other and significantly decreased compared with that of HC naive or memory B cells, respectively (Figure 2A-E; supplemental Figure 1C). Corresponding to the activation of pY, the activation of Btk in HCs naive or memory B cells was also significantly higher than that of pBtk in WAS naive or memory B cells (Figure 2A-D,F; supplemental Figure 1D). In order to further confirm the effect of WASP deficiency on the BCR signaling of naive and memory B cells, we determined the phosphorylated levels of Erk and Btk in B cells upon stimulation with soluble antigens by using phosflow. Similarly, the levels of pErk (Figure 2G) and pBtk (Figure 2H) were enhanced in HC memory B cells and reduced in WAS naive or memory B cells. These results imply that the expression of WASP in PBMCs promotes the increase of recruitment of BCR signalosomes from naive B cells to memory B cells. The absence of WASP abolishes the boost of signaling from naive cells to memory B cells. In addition, Pearson correlation coefficient was used to analyze the spatiotemporal relationship between BCR and pY as well as pBtk. Generally, BCR stimulation increased the colocalization between BCR and pY as well as pBtk at a specific time point for PBMCs (Figure 2I). At 3 minutes, the correlation coefficient between BCR and pY as well as pBtk in HCs memory B cells was significantly higher than that of HCs naive B cells (Figure 2A-B,I). The correlation coefficient between BCR and pY as well as pBtk in HCs naive or memory B cells was increased compared with that of WAS naive or memory B cells (Figure 2A-D,I). At 5 minutes, the correlation coefficient between BCR and pY as well as pBtk in WAS naive or memory B cells was significantly lower than that of HCs naive or memory B cells, respectively (Figure 2A-D,I). At 7 minutes, not only the correlation coefficient between BCR and pY as well as pBtk in WAS naive or memory B cells was significantly lower than that of HCs naive or memory B cells, respectively, but also the correlation coefficient between BCR and pY as well as pBtk in HCs naive B cells was significantly higher than that of HCs memory B cells (Figure 2I). Surprisingly, the staining pattern of pY or pBtk in both WAS naive and memory B cells at 7 minutes redistributed to the outer edge of BCR cluster, unlike the high colocalization of pY or pBtk with BCR in HCs naive and memory B cells, and this phenomenon was more obvious in WAS memory B cells (Figure 2A-D). All together, these results suggest that WASP deficiency in memory B cells not only blocks the boost of signaling level but also alters the spatiotemporal relationship of BCR signaling molecules with BCRs.
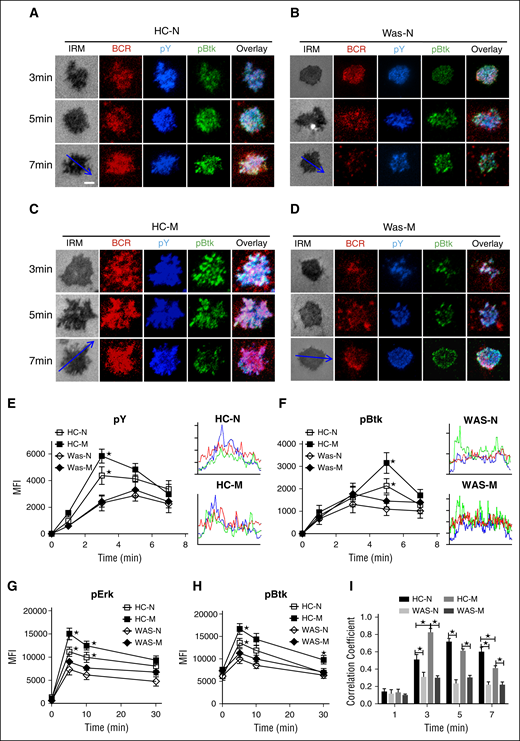
The recruitment of pY and pBtk were reduced in WAS memory B cells. (A-D) TIRFM and IRM analysis of pY and pBtk staining in the contact zone of HCs and WAS (P1-12) naive and memory B cells incubated with membrane-tethered Fab′–anti-Ig. Shown are representative images (A-D) and the MFI (±SD) of pY (E) and pBtk (F) in the B-cell contact zone from 3 independent experiments. Bars, 2.5 µm. *P < .01, compared with WAS naive B cells. Enriched B cells from HCs or WAS (P5-15) PBMCs were incubated with soluble antigens for varying lengths of time, fixed, permeabilized, and then stained with antiphosphorylated Erk (G) and Btk (H) antibody. The colocalization coefficients between BCR and pY and pBtk staining were determined using NIS-Elements AR 3.2 software. Shown are the colocalization coefficients (±SD) (I) from ∼50 individual cells of 3 independent experiments. Bars, 2.5 µm. *P < .01, compared with WAS naive or memory B cells.
The recruitment of pY and pBtk were reduced in WAS memory B cells. (A-D) TIRFM and IRM analysis of pY and pBtk staining in the contact zone of HCs and WAS (P1-12) naive and memory B cells incubated with membrane-tethered Fab′–anti-Ig. Shown are representative images (A-D) and the MFI (±SD) of pY (E) and pBtk (F) in the B-cell contact zone from 3 independent experiments. Bars, 2.5 µm. *P < .01, compared with WAS naive B cells. Enriched B cells from HCs or WAS (P5-15) PBMCs were incubated with soluble antigens for varying lengths of time, fixed, permeabilized, and then stained with antiphosphorylated Erk (G) and Btk (H) antibody. The colocalization coefficients between BCR and pY and pBtk staining were determined using NIS-Elements AR 3.2 software. Shown are the colocalization coefficients (±SD) (I) from ∼50 individual cells of 3 independent experiments. Bars, 2.5 µm. *P < .01, compared with WAS naive or memory B cells.
Recruitment of phosphorylated CD19 (pCD19) is decreased in the contact zone of WAS memory B cells
Because the upstream signaling molecule of Btk is CD19, we determined the effect of WASP deficiency on the recruitment of activated CD19 by using the specific antibodies for pCD19 and visualized them with TIRFM. In HCs naive B cells, the level of pCD19 in the contact zone increased until 5 minutes and decreased afterward (Figure 3A,E). In HCs memory B cells, the level of pCD19 in the contact zone also peaked at 5 minutes and was significantly higher than that of HCs naive B cells (Figure 3A,C,E; supplemental Figure 1E). Interestingly, the level of pCD19 in the contact zone of WAS naive or memory B cells was nearly the same and dramatically decreased compared with that of HCs naive or memory B cells (Figure 3A-E; supplemental Figure 1E). Following the analysis of the activation level of CD19, the spatiotemporal distribution of pCD19 with BCR was analyzed as well. The colocalization between BCR and pCD19 at 3, 5 and 7 minutes in HCs PBMCs was significantly higher than that of WAS PBMCs in both naive and memory B cells (Figure 3A-D,F). At 3 minutes, the colocalization between BCR and pCD19 in HCs memory B cells was significantly higher than that of HCs naive B cells (Figure 3A,C,F). These results suggest that the reduced CD19 recruitment in the contact zone of WAS memory B cells causes the decrease of the recruitment of Btk.
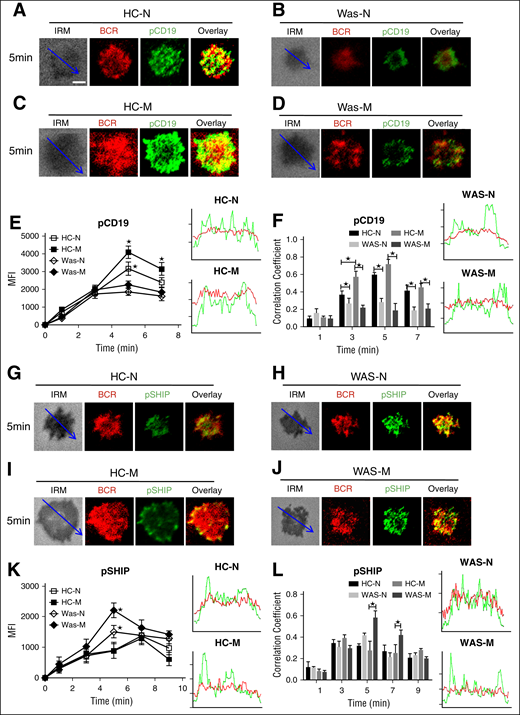
The recruitment of pCD19 was decreased in WAS memory B cells, but the recruitment of phosphorylated SHIP (pSHIP) was increased in WAS memory B cells. (A-D) TIRFM and IRM analysis of pCD19 staining in the contact zone of HCs and WAS (P1-12) memory and naive B cells incubated with membrane-tethered Fab′–anti-Ig. The colocalization coefficients between BCR and pCD19 staining were determined using NIS-Elements AR 3.2 (F). Shown are representative images (A-D) and the average MFI (E) or colocalization coefficients (F) (±SD) from ∼50 individual cells of 3 independent experiments. (G-J) TIRFM and IRM analysis of pSHIP staining in the contact zone of HCs and WAS (P1-12) naive and memory B cells incubated with membrane-tethered Fab′–anti-Ig. Shown are representative images (G-J) and the MFI (±SD) of pSHIP (K) in the B-cell contact zone from 3 independent experiments. TIRFM analysis of the spatial relationship of BCR with pSHIP (G-J) in the contact zone of B cells incubated with membrane-tethered Fab′–anti-Ig. The colocalization coefficients between BCR and pSHIP staining were determined using NIS-Elements AR 3.2 software (L). Bars, 2.5 µm. *P < .01, compared with WAS naive or memory B cells.
The recruitment of pCD19 was decreased in WAS memory B cells, but the recruitment of phosphorylated SHIP (pSHIP) was increased in WAS memory B cells. (A-D) TIRFM and IRM analysis of pCD19 staining in the contact zone of HCs and WAS (P1-12) memory and naive B cells incubated with membrane-tethered Fab′–anti-Ig. The colocalization coefficients between BCR and pCD19 staining were determined using NIS-Elements AR 3.2 (F). Shown are representative images (A-D) and the average MFI (E) or colocalization coefficients (F) (±SD) from ∼50 individual cells of 3 independent experiments. (G-J) TIRFM and IRM analysis of pSHIP staining in the contact zone of HCs and WAS (P1-12) naive and memory B cells incubated with membrane-tethered Fab′–anti-Ig. Shown are representative images (G-J) and the MFI (±SD) of pSHIP (K) in the B-cell contact zone from 3 independent experiments. TIRFM analysis of the spatial relationship of BCR with pSHIP (G-J) in the contact zone of B cells incubated with membrane-tethered Fab′–anti-Ig. The colocalization coefficients between BCR and pSHIP staining were determined using NIS-Elements AR 3.2 software (L). Bars, 2.5 µm. *P < .01, compared with WAS naive or memory B cells.
Recruitment of activated SHIP and FcγRIIB was increased in the contact zone of memory B cells
SHIP is the negative regulator of BCR signaling; thus, we investigated whether the recruitment of activated SHIP to the contact zone of memory B cells would have the opposite kinetics compared with that of Btk. The recruitment of pSHIP to the contact zone of HCs naive and memory B cells was on the same level and peaked at 7 minutes (Figure 3G,I,K; supplemental Figure 1F), but the recruitment of pSHIP to the contact zone of WAS naive or memory B cells peaked at 5 minutes and was significantly higher than that of HCs naive and memory B cells (Figure 3G-K; supplemental Figure 1F). For the colocalization between BCR and pSHIP, there were not significant changes for all the time points examined between HCs and WAS naive or memory B cells except for the increased correlation coefficient in WAS memory B cells compared with HCs memory B cells at 5 and 7 minutes (Figure 3G-J,L). FcγRIIB (CD32) colligation increases the recruitment of pSHIP to the plasma membrane.41 Therefore, we determined the recruitment of FcγRIIB to the contact zone in HCs and WAS memory and naive B cells. The MFI of FcγRIIB in the contact zone of HCs naives peaked at 5 minutes (Figure 4A,E), and the levels of FcγRIIB in the contact zone of HCs memory B cells were significantly decreased compared with that of HCs naive B cells (Figure 4A,C,E; supplemental Figure 1G). There was no difference for the recruitment of FcγRIIB in the contact zone between HCs and WAS naive B cells (Figure 4A-B,E; supplemental Figure 1G). WAS memory B cells had the highest recruitment of FcγRIIB to the contact zone compared with all others (Figure 4A-E; supplemental Figure 1G). Colocalization assays showed the correlation coefficient of FcγRIIB with BCR was increased in WAS memory B cells compared with that of HCs memory B cells at 5 minutes and 7 minutes (Figure 4A-D,F). Taken together, these results suggest that WAS memory B cells fail to respond to mAg stimulation via recruiting higher levels of FcγRIIB-SHIP–mediated negative signaling.
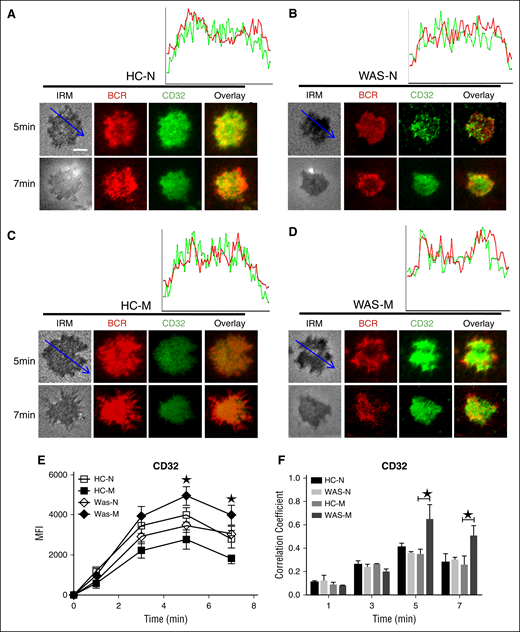
The recruitment of FcγRIIB was increased in WAS memory. (A-D) TIRFM and IRM analysis of FcγRIIB staining in the contact zone of HCs and WAS patient (P1-12) memory and naive B cells incubated with membrane-tethered Fab′–anti-Ig. The colocalization coefficients between BCR and FcγRIIB staining were determined using NIS-Elements AR 3.2 software (F). Shown are representative images (A-D) and the average MFI (E) or colocalization coefficients (F) (±SD) from ∼300 individual cells of 3 independent experiments. Bars, 2.5 µm. *P < .01, compared with WAS naive or memory B cells.
The recruitment of FcγRIIB was increased in WAS memory. (A-D) TIRFM and IRM analysis of FcγRIIB staining in the contact zone of HCs and WAS patient (P1-12) memory and naive B cells incubated with membrane-tethered Fab′–anti-Ig. The colocalization coefficients between BCR and FcγRIIB staining were determined using NIS-Elements AR 3.2 software (F). Shown are representative images (A-D) and the average MFI (E) or colocalization coefficients (F) (±SD) from ∼300 individual cells of 3 independent experiments. Bars, 2.5 µm. *P < .01, compared with WAS naive or memory B cells.
WASP positively regulates the CD19 transcription
In order to determine which step WASP regulates the BCR signaling, we examined the protein expression of CD19, CD81, FcγRIIB, and Btk in naive and memory B cells of HCs and WAS patients by flow cytometry. We found the total level of CD19 in HCs naive B cells was equal to the level of that of HCs memory B cells and significantly higher than that of WAS naive or memory B cells (Figure 5A,D). However, we did not observe any difference of CD81, FcγRIIB, and Btk between HCs and WAS naive or memory B cells (Figure 5B-D). Furthermore, we checked the mRNA level of cd19, fcγrIIb, and btk with real-time polymerase chain reaction by using specific primers. Surprisingly, the mRNA level of cd19 was significantly decreased in WAS naive or memory B cells compared with that of HCs naive or memory B cells (Figure 5E). We also did not observe any changes for fcγrIIb and btk on the mRNA levels (Figure 5E). In order to determine whether the upregulation of B cell activation marker is coincident with the B-cell activation process, we examined the MFI of CD69 and CD80 in B cells upon stimulation with soluble antigens with varying lengths of time. The increase of CD69 and CD80 expression was significantly higher in HCs memory B cells and lower in WAS naive or memory B cells than in HCs naive B cells (Figure 5F-I). Furthermore, we tested whether WASP affects CD19 transcription in vitro by using luciferase assay. We transfected 293 cells with pGL3 vector carrying CD19 promoter together with pcDNA3.1 or pcDNA3.1-WASP as well as internal control-pRL-TKB. The fluorescence signal of 293 cells transfected with pGL3-CD19 and pcDNA3.1-WASP (pGL3-CD19+WASP) was significantly higher than that of pGL3-CD19 and pcDNA3.1 (pGL3-CD19) (Figure 5J). Overall, these results suggest that WASP can positively regulate the CD19 transcription.
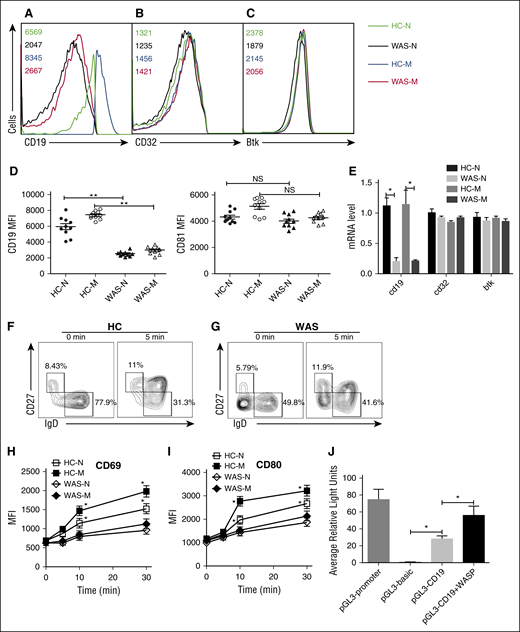
WASP positively regulates the CD19 transcription. HCs and WAS naive and memory B cells were distinguished by IgD and CD27 staining. Surface staining of CD19 (A) and FcγRIIB (B) and intracellular staining of Btk (C) in naive or memory B cells. The quantification of MFI of CD19 and CD81 in naive or memory B cells from HCs or WAS patients (P4-P13) (D). HCs and WAS naive and memory B cells were sorted by CD19, CD27, and IgD staining, and sorted cells were lysed for mRNA extraction. Real-time polymerase chain reaction was performed by using primers specific for cd19, cd32, and btk (E). Enriched B cells from HCs (F) and WAS (P3-P15) (G) PBMCs were stimulated with soluble antigens for varying lengths of time, fixed, and stained with anti-CD69 and CD80 antibody for flow cytometry. The quantification of MFI of CD69 (H) and CD80 (I) in naive or memory B cells from HCs or WAS patients. 293 cells in 24-well plates were transfected with 0.45 μg pGL3-CD19, 0.45 μg pcDNA3.1or pcDNA3.1-WASP, and 0.045 μg pRL-TKB (internal control) for 24 hours following with luciferase reporter assay, pGL3-promoter, and pGL3-basic used as positive and negative controls (J).
WASP positively regulates the CD19 transcription. HCs and WAS naive and memory B cells were distinguished by IgD and CD27 staining. Surface staining of CD19 (A) and FcγRIIB (B) and intracellular staining of Btk (C) in naive or memory B cells. The quantification of MFI of CD19 and CD81 in naive or memory B cells from HCs or WAS patients (P4-P13) (D). HCs and WAS naive and memory B cells were sorted by CD19, CD27, and IgD staining, and sorted cells were lysed for mRNA extraction. Real-time polymerase chain reaction was performed by using primers specific for cd19, cd32, and btk (E). Enriched B cells from HCs (F) and WAS (P3-P15) (G) PBMCs were stimulated with soluble antigens for varying lengths of time, fixed, and stained with anti-CD69 and CD80 antibody for flow cytometry. The quantification of MFI of CD69 (H) and CD80 (I) in naive or memory B cells from HCs or WAS patients. 293 cells in 24-well plates were transfected with 0.45 μg pGL3-CD19, 0.45 μg pcDNA3.1or pcDNA3.1-WASP, and 0.045 μg pRL-TKB (internal control) for 24 hours following with luciferase reporter assay, pGL3-promoter, and pGL3-basic used as positive and negative controls (J).
HCs memory B cells increase the B-cell spreading via increasing actin cytoskeleton recruitment
The actin cytoskeleton has been shown to be involved in B-cell spreading. We distinguished the actin recruitment between HCs naive and memory B cells by using phalloidin staining. The recruitment of F-actin peaked at 5 minutes in HCs naive B cells and the recruitment of F-actin peaked at 3 minutes in the contact zone of HCs memory B cells and was significantly higher than that of HCs naive B cells (Figure 6A,C,E; supplemental Figure 1H). As one of the key actin nucleation factors, WASP is critical for the actin polymerization. We still can detect the recruitment of F-actin in the contact zone of WAS naive or memory B cells because other actin nucleation factors such as neural-WASP could compensate the lost function of WASP.40 We did not find any difference of the recruitment of F-actin between WAS naive and memory B cells (Figure 6B,D-E; supplemental Figure 1H). The recruitment of F-actin in the contact zone of WAS patients memory or naive B cells was significantly lower than that of HCs naive or memory B cells (Figure 6A-E; supplemental Figure 1H). The colocalization assay found the correlation coefficient of BCR with F-actin in HCs naive or memory B cells was significantly higher than that of WAS naive or memory B cells (Figure 6A-D,F). We also examined the basal levels of F-actin in WAS naive or memory B cells by flow cytometry, and the basal levels of F-actin were significantly higher in HCs memory B cells and lower in WAS memory or naive B cells than in HCs naive B cells (Figure 6G). These results suggest that the increased spreading of memory B cells relies on the increased actin accumulation in the contact zone.
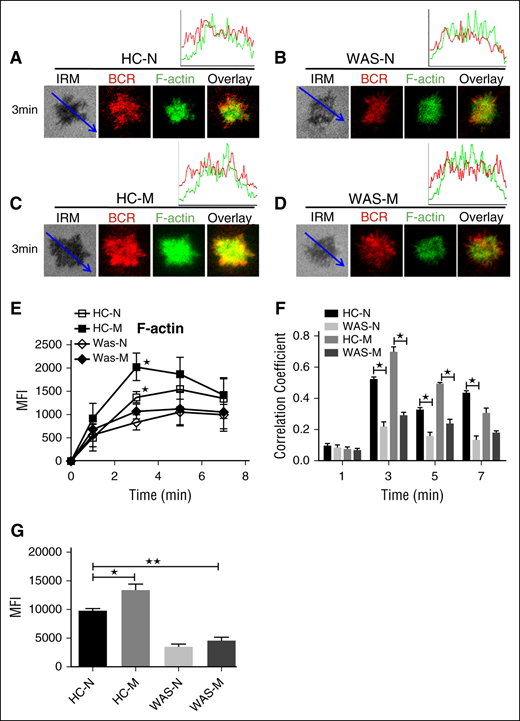
F-actin recruitment was increased in HCs memory B cells. (A-D) TIRFM and IRM analysis of phalloidin staining in the contact zone of HCs and WAS (P1-12) naive and memory B cells incubated with membrane-tethered Fab′–anti-Ig. TIRFM analysis of the spatial relationship of BCR with F-actin (A-D) in the contact zone of splenic B cells incubated with membrane-tethered Fab′–anti-Ig. The colocalization coefficients between BCR and F-actin staining were determined using NIS-Elements AR 3.2 software (F). The quantification of MFI of the basal level of F-actin in naive or memory B cells from HCs or WAS (P1-12) patients by flow cytometry (G). Shown are representative images (A-D), and the average MFI (E) or colocalization coefficients (F) (±SD) from ∼50 individual cells of 3 independent experiments. Bars, 2.5 µm. *P < .01, compared with WAS naive or memory B cells.
F-actin recruitment was increased in HCs memory B cells. (A-D) TIRFM and IRM analysis of phalloidin staining in the contact zone of HCs and WAS (P1-12) naive and memory B cells incubated with membrane-tethered Fab′–anti-Ig. TIRFM analysis of the spatial relationship of BCR with F-actin (A-D) in the contact zone of splenic B cells incubated with membrane-tethered Fab′–anti-Ig. The colocalization coefficients between BCR and F-actin staining were determined using NIS-Elements AR 3.2 software (F). The quantification of MFI of the basal level of F-actin in naive or memory B cells from HCs or WAS (P1-12) patients by flow cytometry (G). Shown are representative images (A-D), and the average MFI (E) or colocalization coefficients (F) (±SD) from ∼50 individual cells of 3 independent experiments. Bars, 2.5 µm. *P < .01, compared with WAS naive or memory B cells.
Discussion
WASP is expressed in all hematopoietic lineages, including B, T, and natural killer cells, dendritic cells, neutrophils, and other myeloid-derived populations.37 WAS is an X-linked immunodeficiency disorder characterized by recurrent infections, microthrombocytopenia, and eczema. Furthermore, WAS is correlated with an increased incidence of autoimmune disease and hematologic malignancies, especially B-cell lymphomas.42 Therefore, it is emergent and critical to clarify its function in the immune system. It has been well established that in WAS patients, B-cell-dependent humoral response is disrupted.35,37,38 However, the underlying molecular mechanism is still unknown, especially for the memory B cells, of which there is little knowledge about their activation.
In this study, we have focused on the early activation of memory B cells from 15 WAS patients. We found the BCR clustering and B-cell spreading were significantly reduced in WAS memory B cells compared with that of HCs memory B cells. Surprisingly, the magnitude of BCR clustering and B-cell spreading in WAS patient memory B cells was as low as that of WAS patient naive B cells, unlike the dramatic boost up of HCs memory B cells from HCs naive B cells. We found the recruitment of CD19 and Btk was significantly decreased in WAS patient memory B cells, but the negative signaling molecules, FcγRIIB and SHIP, were dramatically increased in WAS memory B cells. Furthermore, we found the transcriptional level of cd19 was decreased in WAS memory B cells. This study is the first report on the transcriptional regulation of WASP on cd19, which sheds light on the regulatory role of WASP on the specific and key gene of B cells, cd19. Therefore, our study has revealed a new molecular mechanism that WAS memory B cells fail to have a vigorous immunological response.
WASP is an actin nucleation factor, and its main function is to promote actin polymerization. Previous research showed that actin reorganization releases BCR nanoclusters, which can interact with CD19 held in place by the tetraspanin network.13 WASP-interacting protein deficiency fails to promote CD19 coreceptor activation and subsequent PI3K signaling.43 Our study found that the cd19 transcription was reduced in WAS memory and naive B cells. Although luciferase assay has shown that WASP can affect cd19 transcription in vitro, WASP lacks a DNA binding domain. Therefore, it is hard to speculate that WASP drives cd19 transcription directly, and the detail molecular mechanism of how WASP regulates the cd19 transcription is unclear. WASP has been found to be involved in the transcriptional events. Nuclear-WASP in TH1 gene activation is dissociated with its cytoplasmic role in actin polymerization,44 the shutdown of sumoylation converts nuclear-WASP from a transcriptional coactivator to a corepressor of nuclear factor–κB response genes.45 The open conformation of WASP regulates its nuclear localization and plays requisite roles in regulating gene transcription that would contribute to the outcome in the nucleus of myeloid cells.46 CD19-deficient patients have impaired calcium flux upon stimulation, normal CD81 expression, and poor antibody response to rabies vaccination.47 Autoreactive antibodies have also been found in CD19-deficient patients,47,48 like WAS patients. However, CD19-deficient patients have decreased memory B cells,47 unlike the WAS patients, who have normal memory B cells.35
Overall, our study presents a novel BCR signaling regulation mechanism in WAS memory B cells. The unbalanced positive and negative BCR signaling makes the stimulation of memory B cells incomplete. Briefly, the reduced cd19 gene transcriptional levels lead to the reduced CD19-Btk recruitment to the BCR cluster, causing a decreased magnitude of the activation of memory B cells. The finding of this signaling regulation in WAS memory B cells would provide therapeutic design for the treatment of WAS.
The online version of this article contains a data supplement.
The publication costs of this article were defrayed in part by page charge payment. Therefore, and solely to indicate this fact, this article is hereby marked “advertisement” in accordance with 18 USC section 1734.
Acknowledgments
This work was supported by Natural Science Foundation of China (31500709) and Public Welfare Scientific Research Project of China (201402012).
Authorship
Contributions: X.B. carried out the initial analyses and drafted the initial manuscript; X.B., Y.Z., L.H., L.N., J.W., W.L., H.J., R.D., L.Z., and Z.Z. performed the microscopic and flow cytometry assay; H.M. designed the primers and reviewed and revised the manuscript. W.S., X.Z., and C.L. conceptualized and designed the study and reviewed and revised the manuscript. All authors approved the final manuscript as submitted and agree to be accountable for all aspects of the work.
Conflict-of-interest disclosures: The authors declare no competing financial interests.
Correspondence: Chaohong Liu, Department of Pathogen Biology, School of Basic Medicine, Huazhong University of Science and Technology, Wuhan 430030, China; e-mail: chaohongliu80@126.com; Xiaodong Zhao, Chongqing Key Laboratory of Child Infection and Immunity, Children’s Hospital of Chongqing Medical University, No. 136, Zhongshan 2nd Rd, Yuzhong District, Chongqing 400014, China; e-mail: zhaoxd530@aliyun.com; and Wenxia Song, Department of Cell Biology and Molecular Genetics, University of Maryland, College Park, MD 20742; e-mail: wenxsong@umd.edu.
