Abstract
Background: In order to gain an insight into LPI in iron metabolism microenvironment in MDS.
Materials and Methods: We performed ELISA, quantitative RT-PCR, flow cytometry, MRI T2* assays to test LPI, iron biochemical parameters and LIC among 22 MDS patients.
Results: LPI has a statistical difference (P<0.001 by ANOVA), which decreased gradually, among three groups, while no difference was found in ASF (P=0.086 by ANOVA). After DFO treatment, serum hepcidin expression increased from 301.26±59.78¦Ìg/L to 340.33±49.78¦Ìg/L (P=0.032), while hepcidin/ASF was up-regulated gradually from 0.16±0.08 to 0.22±0.03 (P=0.045). APAF-1 expression (P=0.047) and erythroid apoptosis rate (P=0.009) decreased significantly, respectively. No statistical difference was found in EPO (P=0.247) and GDF15 expression (P=0.172). LIC dropped from 9.83±4.84mg/g dry weight to 6.28±4.01mg/g dry weight (P<0.001). No significant difference was found in cardiac T2* (P=0.594). LPI has a closer connection to LIC than ASF (r=0.739, P<0.001 vs. r=0.321, P=0.034). (Figure1)
Conclusion: LPI seems to be a real-time indicator which reflects body iron loading status instantaneously. Despite the limited knowledge available on LPI speciation in different types and degrees of IO, LPI measurements can be and are in fact used for identifying systemic IO and for initiating/adjusting chelation regimens.
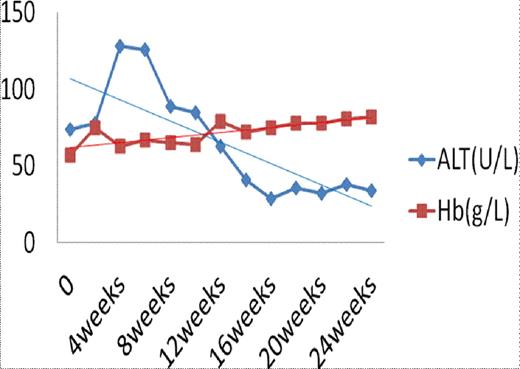
Before DFO treatment, a patient had an abnormal liver function. Along with iron chelation therapy, his LPI decreased rapidly. Meanwhile, his ALT dropped and his hemoglobin increased gradually. Furthmore, his LIC decreased after receiving DFO treatment.
Lane a: LIC was 9.97mg/g dry weight on week 0.
Lane b: LIC was 5.81mg/g dry weight on week 26.
No relevant conflicts of interest to declare.
Author notes
Asterisk with author names denotes non-ASH members.


This feature is available to Subscribers Only
Sign In or Create an Account Close Modal