Abstract
Background: Peripheral T-cell lymphomas (PTCL) are an uncommon heterogenous subset of non-Hodgkin lymphomas for which allogeneic hematopoietic stem cell transplantation (HSCT) is often recommended in the relapsed/refractory setting.
Methods: We analyzed overall (OS) and progression-free survival (PFS) in all adults with PTCL who were transplanted 3/2001-12/2014.
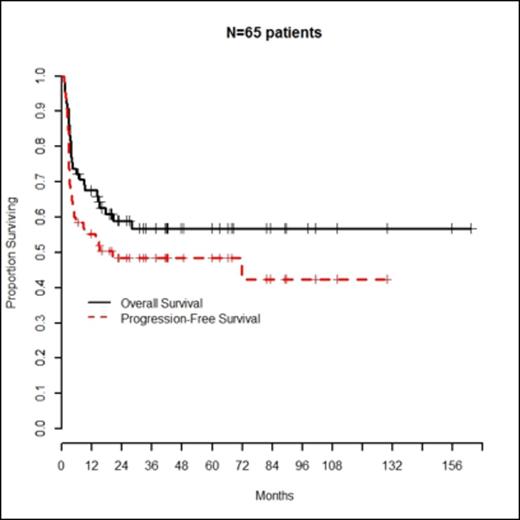
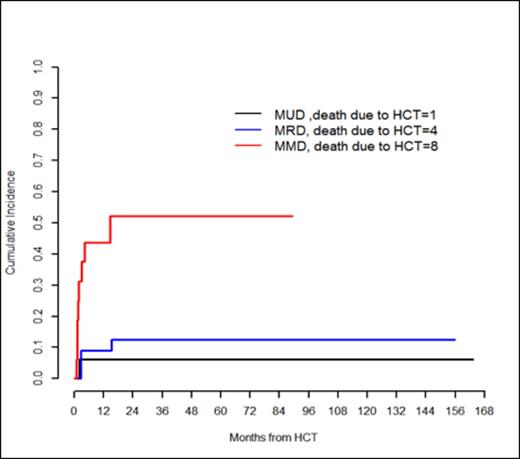
Results: Patient characteristics are shown in the Table. 65 patients (pts) identified (median age 50.3 years, range 18-70) had a median number of prior treatment regimens of 3 (range 1-8), 42 (65%) were in complete remission (CR) at HSCT (24 in 1st and 18 in > 1st) and 15 in partial remission (PR), 10 (15%) pts had a prior autologous transplant, and the median hematopoietic cell transplant comorbidity index (HCT-CI) score was 2 (range 0-8). Conditioning was myeloablative (MA) in 23, reduced intensity (RIC) in 22, and non-myeloablative (NMA) in 20 pts. Grafts were matched sibling (n=33), mismatched sibling (n=1) matched unrelated donor (MUD) (n=16), mismatched unrelated donor (n=7) or cord blood (n=8). The median day to neutrophil engraftment was 12 (range 9-29), 12 (range 11-23), and 10 (range 8-21) for MA, RIC and NMA respectively. Seventeen (26%) pts had grade II-IV day +100 acute graft-versus-host disease (GvHD) (7 grade II, 7 grade III, 3 grade IV). Eighteen pts (28%) had chronic GvHD. Twenty-one pts have relapsed to date at a median of 3.25 months (range 1.81-71.79). With a median follow-up period for survivors of 41.7 months (range, 6.4-163 months), the OS and PFS rate were 59% and 48% at 2 years (Figure 1). All deaths occurred within 36 months of HSCT. Of 27 pts who have died, 14 died of lymphoma and 13died of HSCT complications. The rate of transplant related mortality (TRM) at 1 year was 17% (95%CI: 7.7-26.1). Causes of death included graft failure (n=1), GvHD (n=7), infection (n=1), pulmonary complications (n=2), cardiac arrhythmia (n=1) and veno-occlusive disease (n=1). There were no differences in TRM according to recipient age, HCT-CI, Karnofsky performance status (KPS), number of prior regimens, prior radiation, receipt of a prior autologous transplant, disease status prior to HSCT or conditioning intensity (all p-values NS). PFS was not affected by disease status prior to HSCT. Degree of HLA-match was significantly associated with TRM (p<0.0001). For pts who underwent matched unrelated, matched related or mismatched donor HSCT, cumulative mortality at 6 months was 6%, 9% and 44%, respectively (Figure 2). Seven of 21 pts who relapsed survive to date, median of 63 months post relapse (range 12-153 months) after treatment with chemotherapy only (n = 2), donor lymphocyte infusion (DLI) (n=3), DLI + HSCT (n=1) or a 2nd HSCT (n=1).
Conclusions: We present the largest single center series of HSCT in PTCL. This study suggests existence of GvL effects in patients with PTCL regardless of conditioning intensity or depth of remission at HSCT. Mismatched HSCTs were associated with higher TRM; mainly GvHD. Events were not seen beyond 36 months. This data supports the curative potential of HSCT in a patient group with otherwise poor survival.
Patient Characteristics
| Disease Type (N) . | Median (range) Age . | Median (range) HCT-CI . | Remission Status . | Median (range) Prior Regimens/ N prior auto . | Regimen Intensity . | 2-yr PFS (95%CI) . |
|---|---|---|---|---|---|---|
| PTCL NOS (n=15) | 52 (30-67) | 3 (0-7) | 12 CR 3 PR | 3 (1-6) 1 | 7 MA 4 NMA 4 RIC | 45% (20%-68%) |
| AITL (n=11) | 52 (30-70) | 1 (0-8) | 8 CR 3 PR | 3 (1-5) 5 | 2 MA 4 NMA 5 RIC | 81% (44%-95%) |
| ALCL (n=5) | 47 (28-69) | 1 (0-5) | 4 CR 1 PR | 3 (2-8) 2 | 2 MA 2 NMA 1 RIC | 2 DF 24 & 89 mo; 3 TRM by 15 mo |
| CTCL (n=10)/ SPTCL (n=4) | 47.2 (21-61) | 1 (0-5) | 6 CR 8 PR | 3 (2-8) 0 | 3 MA 5 NMA 6 RIC | 43% (17%-66%) |
| ATLL (n=8) | 50 (34-68) | 1.5 (0-6) | 5 CR 3 PR | 1 (1-6) 0 | 2 MA 3 NMA 3 RIC | 37% (8%-67%) |
| HSTCL (n=7) | 28 (18-64) | 1 (0-4) | 4 CR 2 PR 1 S | 1 (1-4) 1 | 4 MA 1 NMA 2 RIC | 38% (6%-71%) |
| NK (n=3) | 42 (24-47) | 0 (0-1) | 2 CR 1 PR | 1 (1-2) 0 | 3 MA | 1 DF 59 mo 1 TRM 1 Disease |
| TPLL (n=1) | 56 | 4 | CR | 1/0 | RIC | 1 Disease |
| EATL (n=1) | 52 | 5 | CR | 3/1 | NMA | DF 24 mo |
PTCL- peripheral T cell lymphoma (TCL); AITL- angioimmunoblastic TCL,; ALCL- anaplastic large cell lymphoma; CTCL- cutaneous TCL; ATLL- adult TCL; SPTCL- subcutaneous panniculitis TCL; HSTCL- hepatosplenic gamma delta TCL; NK- natural killer TCL; TPLL-prolymphocytic TCL; EATL- enteropathy TCL; CR - complete remission; PR - partial remission; S - stable disease; MA- myeloablative; RI- reduced intensity; NMA- non-myeloablative; mo- month; DF Disease-free
Perales:NMDP: Membership on an entity's Board of Directors or advisory committees; Amgen: Honoraria; Astellas: Honoraria; Merck: Honoraria; Takeda: Honoraria.
Author notes
Asterisk with author names denotes non-ASH members.


This feature is available to Subscribers Only
Sign In or Create an Account Close Modal