Abstract

Background
There is an increasing amount of data showing that tumor microenvironment, host immunity and inflammatory responses play an important role in determining the clinical course and outcome in patients with malignant lymphoma. Several investigators have considered the absolute monocyte count (AMC) as a surrogate biomarker of tumor associated macrophages within the tumor microenvironment, the absolute lymphocyte count (ALC) as an important biomarker of tumor infiltrating lymphocytes, reflecting host immunity status, and the absolute neutrophil count (ANC) as indicative of the systemic inflammatory response to malignancy. All the above parameters have been suggested as significant prognostic factors in Hodgkin lymphoma (HL). The aim of the present retrospective study was to verify in whether neutrophil : lymphocyte ratio (NLR) can be utilized as an independent prognostic factor in a large cohort of patients with nodular sclerosis (NS) subtype HL.
Patients and Methods
This retrospective analysis included data from 1017 patients diagnosed with NS HL according to the WHO criteria. We reviewed the clinical and laboratory data of consecutive "therapy-naïve" patients, treated in different centers in Italy and in Israel between 1993-2012, after approval by local institutional review boards.
Patients had received different combination chemotherapy regimens : doxorubicin, bleomycin, vinblastine and darcarbacine (ABVD), mechlorethamine, vincristine, procarbazine, and prednisone (MOPP)/epidoxirubicin, bleomycin, and vinblastine (EBV)/lomustine (CCNU), doxorubicin, and vindesine (CAD), Vinblastine, bleomycin, and methotrexate (VBM), bleomycin, etoposide, doxorubicin, cyclophosphamide, vincristine, procarbazine, and prednisone (BEACOPP) and Stanford V.
The cut-off for NLR was determined from the analysis of the log (HR) as a function of NLR, using Cox cubic spline regression. The importance of the covariate was examined using the bootstrap inclusion frequency (BIF) with log-likelihood ratio test, (cut-off of 0.05), over 1000 resample of hierarchical Cox PH model, where NLR was added to IPI.
Progression free survival (PFS) and overall survival (OS) were determined by Kaplan-Meier estimates and risk groups compared using the log-rank test .We also performed Cox proportional hazard analysis. The effect size of risk was reported as a hazard ratio (HR) with the associated 95% confidence interval (CI95).
Results
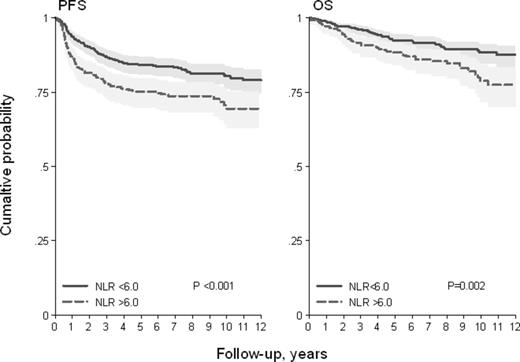
Of the 1017 patients, 990 (97%) had data on both IPS and NLR. Median age was 31 years (range 17-69) and 49% were males. The 5-yr PFS and OS after median follow-up of 85 months (range 1-244 months) were 81% (95CI 78-84) and 91% (95CI 89-93), respectively, for all patients. The log(HR) for PFS and OS varied linearly for the function of NLR and the cut-off was selected at 6 for both outcomes. Patients with NLR >6 had a worse PFS and OS compared to NLR ≤6 (84% vs 75% and 92% vs 88% at 5-years, respectively). Figure 1). For PFS the HR for patients with NLR>6 was 1.65 (CI95 1.25-2.18, p<0.001), while for OS the HR was 1.82 (CI95 1.25-2.65, p=0.002). When adjusted in Cox PH regression by IPS score, NLR >6 maintained it's prognostic value in both PFS (HR 1.49, CI95 1.12-1.98, p=0.006; with a BIF of 76%) and OS (HR 1.56, CI95 1.06-2.29, p=0.023; with a BIF of 64%). This was also evident in continuous form for NLR both s in PFS (HR adjusted by IPS 1.02, CI95 1.01-1.04, p=0.010) and OS (HR adjusted by IPS 1.02, CI95 1.01-1.05, p=0.039).
Conclusion.
Although the majority of patients with HL can be cured, about 1/3 of those with advanced stage disease relapse or progress after first line therapy. Several approaches have been employed to recognize high risk patients, including gene expression profiling and positron emission tomography. However these procedures are expensive and not always easy to perform and interpret. In conclusion, despite it is retrospective nature, our study shows that NLR can reliably identify high risk patients at the time of diagnosis. This easily obtainable simple prognostic parameter could well be utilized to improve the discriminating power of the IPS score in patients with NS HL.
No relevant conflicts of interest to declare.
Author notes
Asterisk with author names denotes non-ASH members.

This icon denotes a clinically relevant abstract


This feature is available to Subscribers Only
Sign In or Create an Account Close Modal