Abstract
Background and Aim: Diffuse large B-cell lymphoma (DLBCL) is the most common type of non-Hodgkin lymphoma. Currently, the standard of care in DLBCL patients (pts) is rituximab-CHOP immunochemotherapy (R-CHOP) and the prognostic stratification is performed by the Revised International Prognostic Index (R-IPI), identifying 3 distinct prognostic groups with a very good, good and poor outcome. A lot of new prognostic markers have been introduced into the clinical practice to perform better pts' stratification. Particular prognostic relevance has been attributed to serum albumin (SA), β2-microglobulin (B2M), peripheral blood lymphocyte/ monocyte ratio (LMR), neutrophil/lymphocyte ratio (NLR) etc. However the data of these prognostic factors across the different R-IPI prognostic groups are limited. Therefore, we decided to access whether SA, B2M, LMR and NLR were predictors of overallsurvival (OS) across the different R-IPI groups of R-CHOP treated DLBCL pts.
Patients and Methods: We retrospectively reviewed the clinical outcome of 281 R-CHOP treated DLBCL pts with median age 58 years and 51.8 % male. According to the R-IPI score, the pts in very good, good and poor risk were 24.2%, 54.8% and 21%, respectively. Laboratory levels of albumin, absolute lymphocyte, monocyte and neutrophil count were recorded, and LMR and NLR - calculated. Serum B2M levels were measured by radioimmunoassay. A receiver operating characteristic (ROC) curve analysis was used to illustrate in our data set the best cut off values of SA, B2M, LMR and NLR to predict OS by Kaplan-Meier method. Univariate analysis to evaluate differences between variables was performed by the log rank. A multivariate analysis was performed by Cox proportional-hazards models.
Results: The estimated 5-year OS was 87.1%, 74% and 31% for R-IPI very good, good and poor-risk patients, respectively. The median values of SA, B2M, LMR and NLR were 40.7 g/L, 2.9 mg/L, 2.95 and 2.86, respectively. Our data showed that on univariate analysis inferior OS was associated with decreased SA (≤39.4 g/L; 95% confidence interval (CI) 0.70-0.82, p=<0.001), elevated B2M (>2.6 mg/L; 95% CI 0.68-0.80, p=<0.001), reduced LMR (≤2.16; 95% CI 0.71-0.81, p=<0.001) and increased NLR (>2.61; 95% CI 0.66-0.77, p=<0.001), presented as dichotomized variables. On multivariate analysis the independent prognostic significance was confirmed only for SA and LMR, with hazard ratios of 0.23 (95% CI 0.11-0.49, p<0.001) and 0.41 (95% CI 0.21-0.81, p=0.011), respectively.
Based on the dichotomized SA and LMR values a SA/LMR prognostic index (PI) was created stratifying patients into 3 risk groups: very good (SA >39.4 g/L and LMR >2.16; n=75), good (SA ≤39.4 g/L or LMR ≤2.16; n=52) and poor-risk (SA ≤39.4 g/L and LMR ≤2.16; n=41) populations. The estimated 5-year OS was 88.7% for very good, 51.7% for good, and 8.8% for poor SA/LMR PI group (p<0.001). Median OS for poor-risk patients was 1.1 years (95% CI 1.03-1.72 years) and not reached for both the very good and good-risk groups.
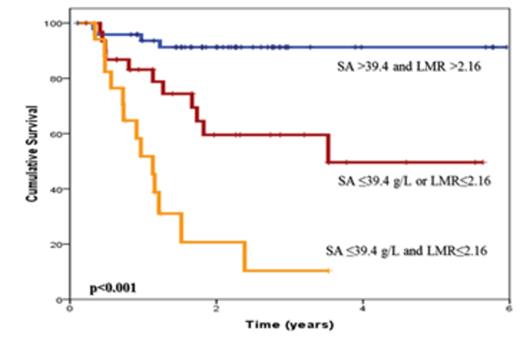
We sought to determine whether the SA/LMR PI may provide additional prognostic information within the R-IPI risk groups. Due to low number of deaths - 4.4% (3/68), no statistics could be calculated in very good R-IPI risk group. Within the R-IPI good risk patients SA/LMR PI allowed us to discriminate 3 subgroups, characterized by significant differences in 3-year and median OS (Figure 1): a SA/LMR PI poor risk subgroup (n=18) with 10.4% 3-years OS and 1.13 years (95% CI 0.82-1.44 years) median OS; a SA/LMR PI good risk subgroup (n=32) with 59.5% 3-years OS and median not reached; and a SA/LMR PI very good risk subgroup (n=50) with not reached median OS and 91.3% 3-years OS comparable to the OS in R-IPI very good patients (p=0.229). Only SA retained its independent prognostic significance in R-IPI poor risk group.
Conclusion: SA and LMR are independent prognostic markers to predict survival in DLBCL pts. Adding these variables to prognostic models such as the R-IPI score might improve their predictive ability, providing particularly relevant information within the R-IPI good risk group. A subgroup of R-IPI good risk pts with a very good SA/LMR PI was identified, comparable to the R-IPI very good risk category in terms of OS.
Overall survival of R-CHOP treated R-IPI good risk DLBCL patients according to SA and LMR at diagnosis
Overall survival of R-CHOP treated R-IPI good risk DLBCL patients according to SA and LMR at diagnosis
No relevant conflicts of interest to declare.
Author notes
Asterisk with author names denotes non-ASH members.


This feature is available to Subscribers Only
Sign In or Create an Account Close Modal