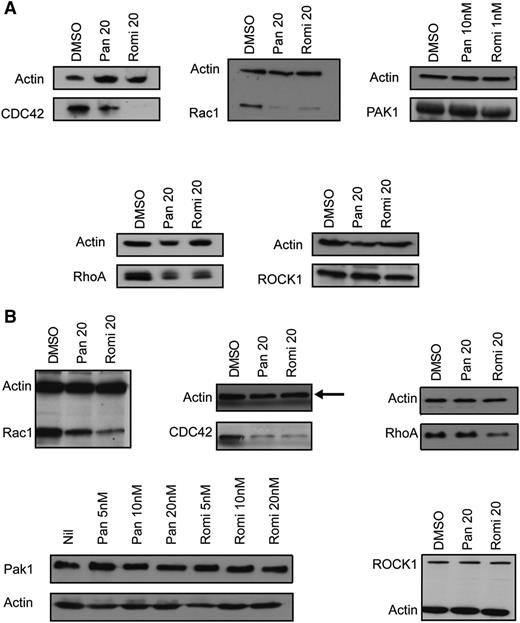
On page 3665 in the 31 March 2011 issue, Figure 5B contains a panel (actin control, middle panel, top row) that is a duplicate of one in Figure 5A (actin control, left panel, top row). On page 3666, an incorrect loading control, MLC, was used for Figure 6A. An institutional investigation of the primary workbooks associated with the study revealed that the corrected Figure 5B and Figure 6A are accurate and representative of the data the study produced. Multiple individual experiments have been performed to generate reproducible findings depicted in the revised figures. None of these changes alters the conclusions drawn from the study. The corrected Figure 5 and Figure 6 are shown below with updated figure legends. The authors apologize for these mistakes.
HDACIs reduce the levels of Rho-GTPase family members in murine fetal liver–derived megakaryocytes and the human megakaryoblastic cell line Meg-01. (A) Western blot performed on fetal liver cell–derived megakaryocytes treated for 48 hours with 10 nM panobinostat (Pan) and 1 nM romidepsin (Romi) showing a reduction in CDC42, Rac1, and RhoA, but no change in PAK1 or ROCK1 levels. (B) Western blot performed on Meg-01 cells treated for 24 hours with 20 nM panobinostat and 20 nM romidepsin showing a reduction in CDC42, Rac1, and RhoA, but no change in PAK1 or ROCK1 levels. The arrow indicates the corrected loading control.
HDACIs reduce the levels of Rho-GTPase family members in murine fetal liver–derived megakaryocytes and the human megakaryoblastic cell line Meg-01. (A) Western blot performed on fetal liver cell–derived megakaryocytes treated for 48 hours with 10 nM panobinostat (Pan) and 1 nM romidepsin (Romi) showing a reduction in CDC42, Rac1, and RhoA, but no change in PAK1 or ROCK1 levels. (B) Western blot performed on Meg-01 cells treated for 24 hours with 20 nM panobinostat and 20 nM romidepsin showing a reduction in CDC42, Rac1, and RhoA, but no change in PAK1 or ROCK1 levels. The arrow indicates the corrected loading control.
Pak1 and RAC1 inhibition phenocopies the effects of HDACIs on pMLC levels. (A) Western blot performed on Meg-01 cells treated for 24 hours with 10 μM of the PAK1 inhibitor WR PAK18 showing an increase in pMLC levels. The arrow indicates the corrected loading control. (B) Western blot performed on Meg-01 cells transduced with a constitutively activate (CA Rac1) or dominant-negative (DN Rac1) Rac1, showing a decrease and increase, respectively, in pMLC levels compared with empty vector (murine stem cell virus [MSCV]) alone.
Pak1 and RAC1 inhibition phenocopies the effects of HDACIs on pMLC levels. (A) Western blot performed on Meg-01 cells treated for 24 hours with 10 μM of the PAK1 inhibitor WR PAK18 showing an increase in pMLC levels. The arrow indicates the corrected loading control. (B) Western blot performed on Meg-01 cells transduced with a constitutively activate (CA Rac1) or dominant-negative (DN Rac1) Rac1, showing a decrease and increase, respectively, in pMLC levels compared with empty vector (murine stem cell virus [MSCV]) alone.


![Figure 6. Pak1 and RAC1 inhibition phenocopies the effects of HDACIs on pMLC levels. (A) Western blot performed on Meg-01 cells treated for 24 hours with 10 μM of the PAK1 inhibitor WR PAK18 showing an increase in pMLC levels. The arrow indicates the corrected loading control. (B) Western blot performed on Meg-01 cells transduced with a constitutively activate (CA Rac1) or dominant-negative (DN Rac1) Rac1, showing a decrease and increase, respectively, in pMLC levels compared with empty vector (murine stem cell virus [MSCV]) alone.](https://ash.silverchair-cdn.com/ash/content_public/journal/blood/125/24/10.1182_blood-2015-04-643619/4/m_3824f6.jpeg?Expires=1767968662&Signature=P3r57BsMOdr-KtHq08tO~I45z7Xlz43o7~obD8GzEIRMF2oy~~P9qVP63LzEsyAQYXiuNbXy5TRBYE2bbmmxt-D2Dm67MEUJ6scVHuAs7aB4SHWTtUMyG~5FF6OYKHu7lzc~T1USKATwcdO3TIbhNP~~IFwh1QP-NkgsgsIqqz~Q5ZwaII44vuS6j2G3mSUuNDUFrMIwGykpLs0BWYC7ChbzRwXJX2vxPWPnEfV~pxk-97tq798VG-LqpW75GOVeH8V8DEJDMfryeEh6OVUFtkOYRptXdzl3x5KuQe5DXq9lTylqfrwnMd~FzPMMxn3XNyaDo4wG3U37WbzvwV2~KA__&Key-Pair-Id=APKAIE5G5CRDK6RD3PGA)
This feature is available to Subscribers Only
Sign In or Create an Account Close Modal