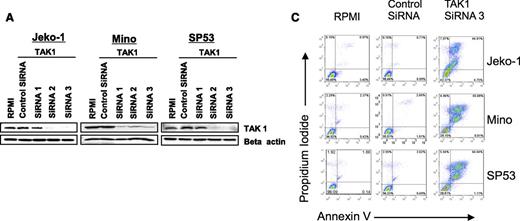
On page 350 in the 12 July 2012 issue, in Figure 2A, beta actin panels of Jeko1 and SP53 cells were inadvertently duplicated. Similarly, in Figure 2C, the RPMI panels of Mino and SP53 cells and the Control SiRNA panels of Jeko-1 and Mino cells were inadvertently duplicated. The corrected panels for Figure 2A and 2C are shown. The authors apologize for these mistakes.
Biological and molecular consequences of silencing TAK1 expression in lymphoma. (A) A representative experiment of TAK1 gene silencing with the use of 3 different siRNAs in lymphoma cell lines. TAK1 protein levels were determined by western blot after 48 hours of transfection. Similar results were obtained in 2 additional independent experiments. (B) TAK-1 gene silencing decreased the phosphorylation of p38 and IКBα without affecting ERK phosphorylation. Results are shown after 48 hours of transfection. (C) TAK1 gene silencing resulted in induction of apoptosis in lymphoma cell lines, as determined by the Annexin V/propidium iodide staining method and FACS analysis. This is a representative experiment performed after 48 hours of transfection with TAK1 siRNA or control siRNA. (D) Summary results of TAK1 siRNA–induced cell death. Each value is the mean of 3 independent experiments performed in triplicate (±SEM). **P < .005. Open bars indicate RPMI, gray bars indicate control siRNA, and black bars indicate TAK1 siRNA3.
Biological and molecular consequences of silencing TAK1 expression in lymphoma. (A) A representative experiment of TAK1 gene silencing with the use of 3 different siRNAs in lymphoma cell lines. TAK1 protein levels were determined by western blot after 48 hours of transfection. Similar results were obtained in 2 additional independent experiments. (B) TAK-1 gene silencing decreased the phosphorylation of p38 and IКBα without affecting ERK phosphorylation. Results are shown after 48 hours of transfection. (C) TAK1 gene silencing resulted in induction of apoptosis in lymphoma cell lines, as determined by the Annexin V/propidium iodide staining method and FACS analysis. This is a representative experiment performed after 48 hours of transfection with TAK1 siRNA or control siRNA. (D) Summary results of TAK1 siRNA–induced cell death. Each value is the mean of 3 independent experiments performed in triplicate (±SEM). **P < .005. Open bars indicate RPMI, gray bars indicate control siRNA, and black bars indicate TAK1 siRNA3.


This feature is available to Subscribers Only
Sign In or Create an Account Close Modal