Abstract
Introduction. An essential role for the B-cell receptor (BCR) has been shown in multiple types of B-cell lymphoma by studies of cell lines and clinical responses to inhibitors of SYK or BTK. Diffuse large B-cell lymphoma (DLBCL) lines of the germinal center B-cell (GCB) type express a BCR, which can signal after crosslinking, but are unaffected by BCR pathway targeting toxic to lines of the activated B-cell (ABC) DLBCL subtype: knockdown of BCR signaling mediators (BTK, CD79A, and CD79B) by shRNA, and small-molecule inhibition of BTK by ibrutinib. GCB-DLBCL lines (and primary samples) also lack constitutive NF-kB activity and mutations in ITAM domains of CD79A or CD79B, BCR-related features of ABC-DLBCL. Most GCB-DLBCL patients resist BTK inhibition by ibrutinib, further suggesting that BCR signaling is not a feature of GCB-DLBCL.
Methods. In 8 GCB-DLBCL lines (OCI-Ly7, OCI-Ly19, SUDHL-4, SUDHL-6, SUDHL-10, DB, BJAB, and HT) and one ABC-DLBCL line (HBL-1), we used electroporation to deliver a plasmid expressing Cas9 protein and a guide RNA (gRNA) targeting one of these: constant exons of IGHM, IGHG, or Igκ; the cell line-specific IgH hypervariable region (HVR); or CXCR4. Knock-in (KI) of mouse CD8a (mCD8a), after the HVR V segment leader sequence and followed by a polyA signal, was used as a positive marker of BCR knockout (KO) in HBL-1 and OCI-Ly19 cell lines. Surface BCR, CXCR4, and mCD8a were detected by flow cytometry (FACS). BCR KO cells were viably sorted 4-6 days after electroporation, cultured 1-3 days more, and studied by whole-genome gene expression profiling (GEP) on Illumina HT12v4 arrays and Western blotting.
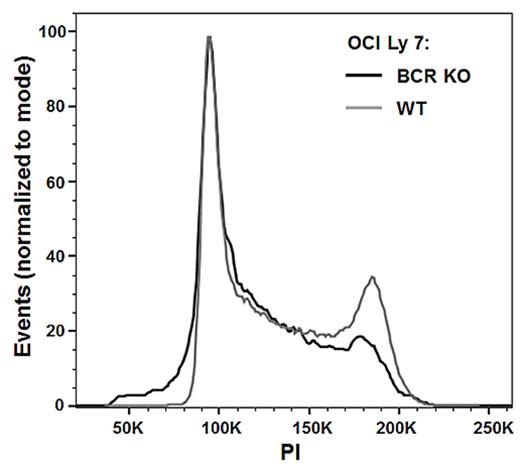
Results. Only 2 days after electroporation, FACS showed cells with correlated loss of surface BCR proteins (IgH, Igκ or Igl, and CD79B), which eventually declined to undetectable levels. Forward and side scatter showed that BCR KO cells were smaller. The proportion of BCR KO (or mCD8a KI/KO) cells declined over time, steadily after complete BCR elimination (Fig. 1A). BCR KO cells in GCB-DLBCL lines grew more slowly than BCR-replete cells but variably, from almost no difference in BJAB to growth cessation in SUDHL-4, SUDHL-10 and HBL-1 (Fig. 1B). CXCR4 KO cells were a stable proportion (Fig. 1A) with a normal growth rate (Fig. 1B), indicating that growth reduction by BCR KO is specific. Continued expression of mCD8a indicated viability and sustained IgH transcription in BCR KO cells. Cell cycle analysis showed lower proportions of S and G2/M phases in BCR KO cells, proportional to growth retardation, and sub-G1 cells in OCI-Ly7 (Fig. 2), SUDHL-4 and SUDHL-10. Apoptosis in OCI-Ly7 BCR KO cells was confirmed with a caspase-3 fluorogenic substrate. Igκ KO similarly caused complete BCR loss and growth retardation, in OCI-Ly7 cells even more than with IgH KO. In the HT cell line, which lacked BCR expression due to a single-nucleotide deletion in its IgH HVR, KI repaired the HVR and caused expression of surface BCR (IgM with Igκ and CD79B) but no change in growth rate, suggesting BCR-proximal activators of BCR signaling pathways. Targeted BCR KO is not currently a therapeutic option, but BCR KO cells were relatively more sensitive to an in vitro regimen modeling the non-prednisone drugs of CHOP. No change in drug sensitivity was observed with BCR KO in BJAB, or in CXCR4 KO cells.
GEP showed that BCR KO downregulated several genes characteristically expressed by GCB-DLBCL, and genes associated with negative regulation of BCR signaling. Pathway analysis with Gene Set Enrichment Analysis (GSEA) showed that BCR KO reduced expression of proliferation-related signatures, and produced changes associated with B-cell differentiation stages lacking a mature BCR, either early (pre-B cells) or late (plasma cells). GSEA implicated loss of MAPK/ERK and PI3K/AKT signaling pathways as mediators of BCR KO-induced changes, confirmed by Western blotting showing loss of phosphorylation of SYK, AKT and ERK after BCR KO.
Conclusions. Complete BCR KO by Cas9/gRNA showed that GCB-DLBCL lines require the BCR for optimal viability, cell growth, and chemotherapy resistance. BCR KO-induced changes are mediated by MAPK/ERK and PI3K/AKT signaling pathways.
BCR KO cells (distinguished from BCR-replete cells by FACS), but not CXCR4 KO cells, show relative decline (A) and slower absolute growth (B) in mixed cultures.
BCR KO cells (distinguished from BCR-replete cells by FACS), but not CXCR4 KO cells, show relative decline (A) and slower absolute growth (B) in mixed cultures.
Cell cycle changes with BCR KO in OCI-Ly7.
No relevant conflicts of interest to declare.
Author notes
Asterisk with author names denotes non-ASH members.


This feature is available to Subscribers Only
Sign In or Create an Account Close Modal