Abstract
Myelodysplastic syndrome (MDS) and chronic myelomonocytic leukaemia (CMML) are haematological disorders that develop in haematopoietic stem or progenitor cells (HSPCs) and are characterised by ineffective haematopoiesis. 5'-Azacitidine (AZA) is a DNA demethylating agent that is effective in treating MDS and CMML. However, response rates are less than 50% and the basis for poor response is currently unknown. A patient's potential to respond cannot be currently determined until after multiple cycles of AZA treatment and alternative treatment options for poor responders are limited. To address these fundamental questions, we enrolled patients on a compassionate access program prior to the listing of AZA on the pharmaceuticals benefit scheme in Australia. We have collected bone marrow from 18 patients (10 MDS, 8 CMML) at seven different stages of treatment, starting from before treatment until after six cycles of AZA treatment, and isolated high-purity CD34+ HSPCs at each stage. 10 of these patients (5 MDS and 5 CMML) responded completely to AZA while 8 did not achieve complete response.
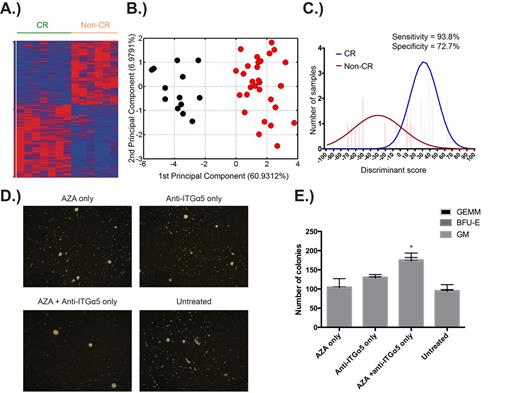
We performed next-generation sequencing (RNA-seq) of these HSPCs to identify the basis of poor response to AZA therapy. Analysis of the RNA-seq data from pre-treatment HSPCs has revealed a striking differential expression of 1148 genes between patients who were subsequently complete (CR) or non-complete responders (non-CR) to AZA therapy (Figure 1A). Using a Fluidigm nanofluidic system, we have validated the differential expression of a subset of these genes between CR and non-CR patients in two independent cohorts, totalling 67 patients, from the U.K. and Sweden. We have additionally confirmed that our gene signature does not simply segregate patients based on disease severity or poor overall survival, but rather uniquely prognosticates best AZA response. Pathway analyses of the differentially expressed genes indicates that the HSPCs of non-CR patients have decreased cell cycle progression and DNA damage pathways, while concomitantly possessing increased signalling through integrin and mTOR/AKT pathways.
Using computational methods, we have determined that the expression of 15 genes (within the 1148 gene set) is sufficient to separate CRs from non-CRs across independent cohorts (Figure 1B). We have also developed a predictive AZA response algorithm that utilises the expression of these genes to identify potential complete and non-complete responders to AZA with high specificity and sensitivity (Figure 1C). Furthermore, we have identified statistically significant correlations between recurrent DNA mutations in MDS and our prognostic gene signature (SF3B1 & TET2 with CR, STAG2 and NUP98 with non-CR, p<0.05).
We have used these findings to first, develop a clinically useful method to predict the likelihood of AZA response and second, use targeted therapies to promote AZA response in likely poor responders. To predict AZA response, we assess cell cycle progression of MDS/CMML CD34+ subsets by flow cytometry using unfractionated bone marrow aspirates. To improve drug response in predicted non-CR patients, we have performed combinatorial drug testing experiments with AZA using primary MDS/CMML CD34+ HSPCs, in a co-culture system using MS5 stromal cells, targeting up-regulated pathways identified from our RNA-seq data. (Figures 1D, 1E).
Our findings have immediate clinical utility to both prospectively identify CR and non-CR patients prior to AZA therapy and to improve AZA response in the latter by using combination therapy targeting specific pathways.
A.) Differential expression of 1148 genes in pre-treatment HSPCs of patients who were subsequently complete (CR) or non-complete responders (non-CR) to AZA. B.) The differential expression of a subset of 15 genes is sufficient to separate the two groups. C.) A predictive AZA response algorithm that utilises gene expression data to prospectively identify patients. D.) Representative images of CFU colonies illustrating improved colony formation following combination drug treatment. E.) Improved CFU colony counts following combination drug treatment. * p <0.05
A.) Differential expression of 1148 genes in pre-treatment HSPCs of patients who were subsequently complete (CR) or non-complete responders (non-CR) to AZA. B.) The differential expression of a subset of 15 genes is sufficient to separate the two groups. C.) A predictive AZA response algorithm that utilises gene expression data to prospectively identify patients. D.) Representative images of CFU colonies illustrating improved colony formation following combination drug treatment. E.) Improved CFU colony counts following combination drug treatment. * p <0.05
Lynch:Celgene Pty Ltd: Employment, Equity Ownership. Mufti:Celgene: Honoraria, Membership on an entity's Board of Directors or advisory committees, Research Funding. Pimanda:Celgene Pty Ltd: Research Funding.
Author notes
Asterisk with author names denotes non-ASH members.


This feature is available to Subscribers Only
Sign In or Create an Account Close Modal