Abstract
Background: The majority of multiple myeloma (MM) patients receiving autografts ultimately relapse, and tumor cell contamination of autografts may be a contributing factor. A clinical trial to assess tandem chemo-mobilization with the goal of reducing the myeloma cell burden in the patient and in the apheresis product was conducted and outcomes were previously reported (Chen et al., Bone Marrow Transplant 2012). The effect of myeloma cell depletion using tandem mobilization has not been previously quantified; however, clinical outcomes are comparable with other autotransplant regimens. Here we utilize a sequencing-based minimal residual disease (MRD) technology, termed the LymphoSIGHT™ platform, to assess the effect of tandem chemo-mobilization on myeloma cell contamination in apheresis collections. This sequencing-based method has a sensitivity to detect one tumor-associated immune receptor gene rearrangement molecule per million leukocytes and can be used for MRD quantification in lymphoid neoplasms (Faham et al., Blood 2012; Martinez-Lopez et al., Blood 2014). We analyzed cryopreserved apheresis samples from 19 MM patients to quantify the clonotypicmyeloma cell burden in tandem mobilized apheresis products.
Methods: In the two-step chemo-mobilization process, MM patients were first treated with cyclophosphamide (4g/m2) followed by G-CSF (10mcg/kg/day) and an apheresis product collected at hematopoietic recovery was stored ("Cycle 1" apheresis sample). Following subsequent treatment with etoposide (2g/m2) followed by G-CSF (10mcg/kg/day), a second apheresis product was collected ("Cycle 2" apheresis sample). Using universal primer sets, we assessed clonal rearrangements at the immunoglobulin (IGH-VDJ, IGH-DJ and IGK) loci in diagnostic bone marrow aspirate (BMA) slides. Myeloma clonotypes were identified in the diagnostic BMA sample of each patient based on high-frequency within the B-cell repertoire. The level of the myeloma clonotype was then quantified in banked aliquots from the Cycle 1 and Cycle 2 apheresis products.
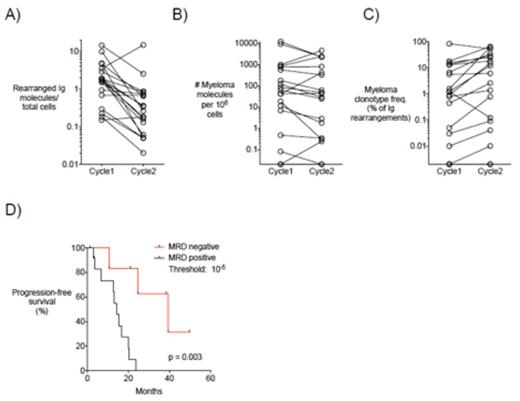
Results: Paired Cycle 1 and Cycle 2 apheresis samples were analyzed, and the total number of rearranged immunoglobulin (Ig) molecules, an approximation of total B-cells, was calculated. An average 5.3 fold reduction in rearranged Ig molecules as a fraction of total cells was observed from Cycle 1 to Cycle 2 (p = 0.004, 2-tailed Wilcoxon) (Figure 1A). Myeloma cell contamination was present at a median level of 62.7 myeloma molecules/million PBMCs (range 0-11,951) after Cycle 1 and 43.6 myeloma molecules/million PBMCs (range 0-4,489) after Cycle 2. Quantitative comparison of MRD levels revealed no significant difference in the absolute number of myeloma molecules/million PBMCs between Cycle 1 and Cycle 2 apheresis products (p = 0.276) (Figure 1B). Analysis of the myeloma clonotype frequency illustrated an average 3.0-fold increase in myeloma clonotype frequency relative to total Ig rearrangements from Cycle 1 to Cycle 2 (p = 0.011) (Figure 1C). MRD levels less than 10-5 in autograftapheresis samples were associated with significantly longer PFS (40 vs 14.3 months, p = 0.003) (Figure 1D).
Conclusions: Tandem mobilization fails to decrease myeloma contamination in the second apheresis product, and this practice has been discontinued based on this analysis. Highly sensitive quantification of myeloma clonotype levels in autograft samples may provide improved clinical prognostic information, complement post-transplant MRD quantification, and potentially informtreatment decisions about the timing and intensity of post-transplant maintenance therapies.
Comparison of Cycle 1 and Cycle 2 apheresis products and clinical outcome data in MM patients. In Panels A-C, paired Cycle 1 and Cycle 2 values for each patient are connected by a line. Open circles represent A) Total rearranged Ig molecules (an approximation of total B-cells) as a fraction of total cells, B) Number of myeloma molecules per million PBMCs, and C) Myeloma clonotype frequency relative to total Ig rearrangements for each patient in the Cycle 1 and Cycle 2 apheresis products. D) Kaplan-Meier analysis of progression-free survival for 7 MRD negative (<10-5) and 12 MRD positive (>10-5) patients.
Comparison of Cycle 1 and Cycle 2 apheresis products and clinical outcome data in MM patients. In Panels A-C, paired Cycle 1 and Cycle 2 values for each patient are connected by a line. Open circles represent A) Total rearranged Ig molecules (an approximation of total B-cells) as a fraction of total cells, B) Number of myeloma molecules per million PBMCs, and C) Myeloma clonotype frequency relative to total Ig rearrangements for each patient in the Cycle 1 and Cycle 2 apheresis products. D) Kaplan-Meier analysis of progression-free survival for 7 MRD negative (<10-5) and 12 MRD positive (>10-5) patients.
Klinger:Sequenta, Inc.: Employment, Equity Ownership. Kong:Sequenta, Inc.: Employment, Equity Ownership. Faham:Sequenta, Inc.: Employment, Equity Ownership, Membership on an entity's Board of Directors or advisory committees.
Author notes
Asterisk with author names denotes non-ASH members.


This feature is available to Subscribers Only
Sign In or Create an Account Close Modal