Abstract
CD4+ T cells hold a central role in tumor immunity by orchestrating and regulating antitumor responses. Azacytidine can apparently modulate tumor immunity in myelodysplastic syndrome (MDS) patients and affect CD4+ cell polarization, mainly in responding patients. Signal transducer and activator of transcription (STAT) proteins have essential roles in the epigenetic control of T helper (TH) cell differentiation and aberrant STAT signaling is involved in the pathobiology of numerous malignancies by compromising tumor immunity. MDS have a strong immunopathogenetic component, but the CD4+ cell STAT signaling network and the effect of hypomethylating therapy on the former have not yet been investigated. We applied phospho-specific flow cytometry to explore the alterations of STAT signaling in CD4+ cells during azacytidine treatment and addressed their association with clinical and biological parameters.
Peripheral blood mononuclear cells of 26 late-stage MDS and low blast count AML (LBC-AML) patients and 7 age-matched healthy individuals were obtained before and 15 days after azacytidine initiation. According to WHO classification, two patients had RCMD (8%), 10 (38%) had RAEB-II, 8 (31%) CMML-II and 6 (23%) LBC-AML. Based on the IWG criteria patients were divided into responders (CR, PR and hematologic improvement, n=12) and non-responders (stable disease and failure, n=14). We applied a modified protocol of phospho-specific flow cytometry to measure either basal (untreated) or potentiated (after stimulation with IL-6, IFNá and IL-2 for 15') phospho-STAT1, 3 and 5 levels with simultaneous staining for CD3 and CD4. The following potentiated, i.e. target/stimuli, nodes were studied: pSTAT1/IL-6, pSTAT1/IFNá, pSTAT3/IL-6, pSTAT5/IFNá and pSTAT5/IL-2. In the same patients TH cell subsets were measured by intracellular staining with IFNã, IL-4, FOXP3 and IL-17A along with CD3 and CD4. Comparisons were performed by Mann Whitney, Kruskal Wallis or Wilcoxon Signed-Rank test as appropriate. Clustering of signaling profiles (SPs) was performed with hierarchical cluster analysis and correlations by using ÷2 or Fisher Exact tests.
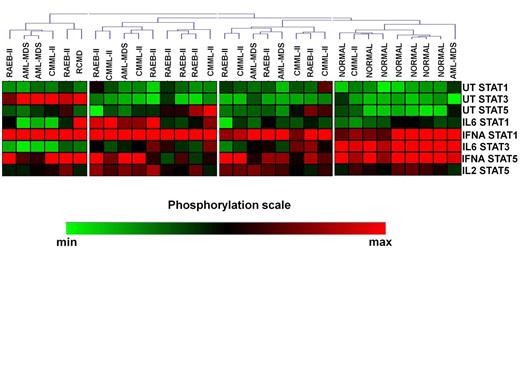
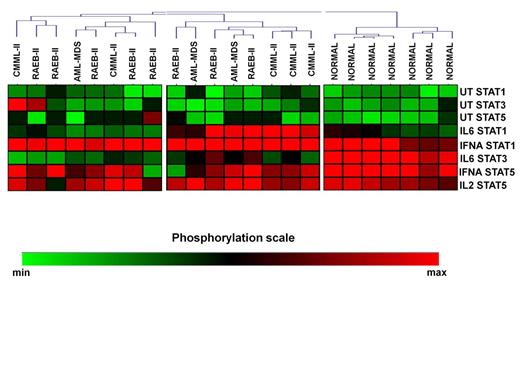
Unsupervised clustering of the CD4+ SPs in MDS patients and controls revealed 4 signaling clusters (SC1-4, figure 1). No differences were noticed among the SCs in relation to treatment response, cytogenetics, IPSS, WPSS and IPSS-R and transfusion requirements. By contrast, the disease subtypes were nonrandomly distributed among the clusters (p=0.036). Most RAEB-II patients segregated in cluster 2, which displayed high basal levels of pSTAT5 and intense response of pSTAT1 to IL-6 and IFNá and of pSTAT5 to IFNá, whereas all healthy subjects were enclosed in SC4 which was characterized by low basal levels of all pSTATs and powerful response of pSTAT1 and 5 to IFNá and of pSTAT3 to IL-6. Also, SCs showed similar levels of TH cells, with the exception of SC1 which was associated with markedly higher levels of FOXP3+/IL-17+ cells both on day 0 (0.29% of total CD4+ cells, range 0.04%-0.54%, p=0.04) and day15 (0.31%, range 0.12%-0.35%, p=0.04) after azacitidine administration compared to other SCs. Interestingly, the levels of FOXP3+/IL-17+ cells downregulated significantly on day 15 in responders (0.07%, range 0.04%-0.4% vs 0.04%, range 0.02%-0.16%, p=0.03), whereas non responders showed a non-significant decrease (0.13%, range 0.01%-0.54% vs 0.08%, range 0.04%-0.31, p=0.2). We further performed cluster analysis of patients SPs 15 days after azacytidine initiation. Patients were separated in two SCs, while normal controls still formed a different cluster (SC3, Figure 2), indicating that, at least on day 15, azacytidine was not able to restore the abnormal STAT signaling in CD4+ cells.
In conclusion, we demonstrate that the STAT signaling biosignature of CD4+ cells in late stage MDS patients is abnormal and also differs among the various disease subtypes. Moreover, consistent with recent data (Bontkes HJ, 2012, Constantini B et al, 2012), azacytidine treatment appears to affect mainly the FOXP3/TH17 axis, particularly in responders. Our results further suggest a clinically relevant immunomodulatory activity of azacytidine.
Heatmap of pretreatment signaling clusters (SC) in CD4+ cells of patients and normal subjects.
Heatmap of pretreatment signaling clusters (SC) in CD4+ cells of patients and normal subjects.
Heatmap of SCs in CD4+ cells of patients and normal subjects on day 15 after azacytidine initiation.
Heatmap of SCs in CD4+ cells of patients and normal subjects on day 15 after azacytidine initiation.
Kotsianidis:Genesis Pharma Hellas: Honoraria.
Author notes
Asterisk with author names denotes non-ASH members.


This feature is available to Subscribers Only
Sign In or Create an Account Close Modal