Abstract
Background: Extranodal NK/T-cell lymphoma, nasal type (ENKTL) is an aggressive disease with a poor prognosis. The prognostic nutritional index (PNI) is reported to be associated with survival in several types of tumors. The prognostic value of PNI in lymphoma remains unclear. The aim of the present study is to evaluate the prognostic significance of PNI in patients with ENKTL.
Methods: 157 patients with newly diagnosed ENKTL were retrospectively evaluated between August 2000 and October 2011 at the Sun Yat-sen University Cancer Center. Patients in whom the combined albumin (g /l) +5x total lymphocyte count x 109/l ≥45 were allocated a PNI score of 0. Patients in whom this total was < 45 were allocated a score of 1.
Overall survival (OS) and progression free survival (PFS) were estimated using the Kaplan-Meier method. The significance of differences between survival curves was tested using the log-rank test. Significant variables in the univariate analysis were considered variables for the multivariate survival analysis, which was performed using Cox regression mode.
Results: Four-nine patients (31.2%) had an abnormal PNI (PNI=1). The characteristics of both groups are given in Table 1.
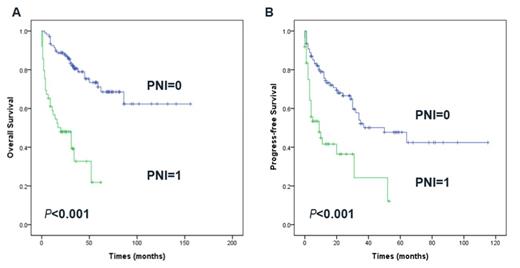
After a median follow-up duration of 31.0 months, an estimated 5-year OS and PFS rate in 157 patients was 58.4% and 39.4%, respectively. Patients with pretreatment PNI score=1 had lower complete remission rates (P= 0.018) and worse OS (5-year OS: 71.7% vs 21.8.0%,P<0.001) and PFS (P<0.001) compared with PNI score=0 patients. The survival curves according to PNI are shown in Fig. 1.
Using the International Prognostic Index (IPI) and peripheral T-cell lymphoma (PIT) scoring systems, more than 70% of all cases were in the low-risk category (with no or one adverse factor), but these two prognostic models failed to differentiate between patients with different outcomes in the low-risk group. PNI could differentiate low-risk patients using IPI and PIT scoring (all P< 0.05).
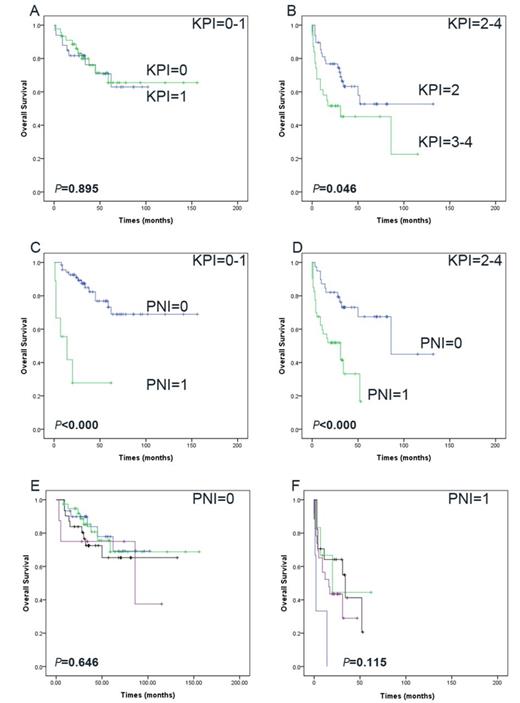
The Korean Prognostic Index (KPI) model balanced distribution of patients into different risk groups better than the IPI and PIT models. However, the KPI model also failed to significantly differentiate between patients with different outcomes in low and low intermediate risk group (P=0.859). PNI also helped to differentiate between patients with different prognosis in low and low intermediate risk group (P=0.000).However, the KPI prognostic model failed to show significant prognostic value among patients with PNI=0 (P=0.646) or among the patients with PNI=1 (P=0.115). The survival curves according to KPI and PNI are shown in Fig. 2.
Conclusions: PNI is an independent predictor of survival in ENKTL and is superior to IPI, PIT and KPI.
Baseline Characteristics of Patients by PNI Level
| Characteristics . | PNI score =0 . | PNI score =1 . | P . |
|---|---|---|---|
| 108 | 49 | ||
| Age (median [range], yr) | 42(9-77) | 45(12-76) | 0.031 |
| <60 | 96(88.9) | 37(75.5) | |
| >60 | 12(11.1) | 12(24.5) | |
| Gender | 0.444 | ||
| Female | 33(30.6) | 18(36.7) | |
| Male | 75(69.4) | 31(63.3) | |
| ECOG PS | <0.001 | ||
| 0-1 | 107(99.1) | 40(81.6) | |
| 2-3 | 1(0.9) | 9(18.4) | |
| B symptoms (yes) | 45(41.7) | 36(73.5) | <0.001 |
| LDH >245 U/L | 19(17.6) | 29(59.2) | <0.001 |
| Mass ≥5 cm | 12(11.1) | 6(12.2) | 0.836 |
| Extranodal sites ≥2 | 30(27.8) | 27(55.1) | 0.001 |
| Regional LN involvement | 60(55.6) | 40(81.6) | 0.002 |
| Bone marrow involvement | 0(0.0) | 3(6.1) | 0.009 |
| Primary sites | 0.006 | ||
| Nasal/nasopharynx area | 93(86.1) | 33(67.3) | |
| Extra-nasal/nasopharynx | 15(13.9) | 16(32.7) | |
| Ann Arbor stage | 0.001 | ||
| I/II | 93(86.1) | 31(63.3) | |
| III/IV | 15(13.9) | 18(36.7) | |
| IPI score | <0.001 | ||
| 0-1 | 91 (84.3) | 24(49.0%) | |
| 2-5 | 17(15.7) | 25(51.0%) | |
| PIT score | <0.001 | ||
| 0-1 | 106(98.1) | 36(73.5) | |
| 2-4 | 2(1.9) | 13(26.5) | |
| KPI score | <0.001 | ||
| 0-1 | 69(63.9) | 9(18.4) | |
| 2-4 | 39(36.1) | 40(81.6) |
Overall survival (A) and progression free survival (B) based on the PNI for patients with extranodal natural killer/T¨Ccell lymphoma, nasal type.
Overall survival (A) and progression free survival (B) based on the PNI for patients with extranodal natural killer/T¨Ccell lymphoma, nasal type.
KPI model differentiate between patients with different outcomes in low and low intermediate risk group (A) and high and high intermediate risk group (B). PNI differentiate between patients with KPI=0-1 (C) and KPI=2-4(D). KPI model differentiate between patients with PNI=0(E) and PNI=1 (F).
KPI model differentiate between patients with different outcomes in low and low intermediate risk group (A) and high and high intermediate risk group (B). PNI differentiate between patients with KPI=0-1 (C) and KPI=2-4(D). KPI model differentiate between patients with PNI=0(E) and PNI=1 (F).
No relevant conflicts of interest to declare.
Author notes
Asterisk with author names denotes non-ASH members.


This feature is available to Subscribers Only
Sign In or Create an Account Close Modal