Abstract

Background: In the current ELN recommendations (Baccarani et al., Blood 2013) the optimal time point to achieve major molecular remission (MMR) is defined at 12 months after diagnosis of CML. MMR is not a failure criterion at any time point leading to uncertainties when to change therapy in CML patients not reaching MMR after 12 months.
Aims: We sought to evaluate a failure time point for MMR using data of the CML-Study IV, a randomized five-arm trial designed to optimize imatinib therapy alone or in combination. In addition the optimal time-point to achieve a MMR should be evaluated.
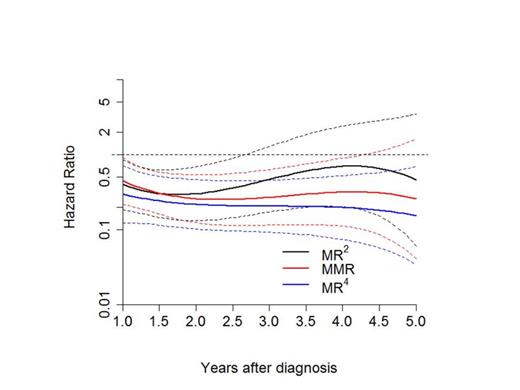
Methods: Patients with valid molecular analysis on MR4 level were divided randomly into a learning (LS) and a validation sample (VS). For the LS, MR2 (defined as BCR-ABL<1% which corresponds to complete cytogenetic remission (Lauseker et al. 2014)), MMR and deep molecular remission levels (MR4 or deeper) monthly landmarks were defined between one and five years after diagnosis. A patient was considered to be in MR2, MMR or MR4 from the first diagnosis of the corresponding remission level and could only change to a higher level of response. Patients were censored after SCT. The best prediction time was found via dynamic prediction by landmarking (van Houwelingen, Scand J Stat 2007). For the failure time point analysis, for each of the resulting 48 landmarks, a Cox model was used to define the time to progression with age and EUTOS score as additional prognostic factors. Additionally, the regression coefficients of the model of one landmark were converted to hazard ratios (HR) and treated as dependent on the HRs of the other landmarks, using a cubic smoothing function (see Fig 1). The minimum of this function was considered to be the optimal landmark point for the prediction of progression-free survival (PFS). For the calculated time point, landmark analysis for probability of PFS (defined as appearance of accelerated phase, blast crisis or death) was performed in the VS. For the evaluation of the optimal time point of achieving a MMR the same analysis was done from 0.25 to 5 years to define the time to MR4 or deeper.
Results: 1551 patients were randomized from 2002 to 2012, 1358 had a valid molecular analysis on the MR4 level. 114 patients in the imatinib after IFN arm and 16 patients with missing EUTOS score were excluded. Of the 1228 evaluable patients two thirds were randomly allocated to the LS (n=818) and one third to the VS (n=410). Percentage of patients of the LS in MR2, MMR and MR4 or deeper at one year was 28%, 29% and 14%, and at 5 years 5%, 21% and 71%, respectively. Monthly time points in between were also calculated. 44 patients of the LS reached MMR on second generation tyrosine kinase inhibitors.. The minimum of the cubic function of the HRs was found for MMR at 2.34 years with a HR of 0.25 (compared to patients without any remission) and 0.75 compared to those in MR2. For MR4 or deeper no exact time point could be calculated (see Fig. 1), although it was shown that the risk of progression was slightly lower for MR4 than for MMR. Since the time interval for molecular evaluation in the study is 3 months, the validation was done with 2.25 instead of 2.34 years. 364 of the 410 of the VS were still at risk at this time point and evaluable. A significant PFS advantage for patients in MMR could be demonstrated (p=0.018). At 8 years, the probability of PFS for patients in MMR was 90.8% (confidence interval 87.0-93.7%) vs. 80.5% (confidence interval 70.2-88.6%) for patients not in MMR (see Fig 2).
For the optimal MMR analysis no singular time point could be calculated as the earlier a MMR was reached the higher was the chance to achieve a MR4.
Conclusions: In this model, an optimal time point to predict PFS in patients with MMR was defined at 2.25 years after diagnosis and could be validated as significant. Nevertheless, patients being in MMR had a lower risk of progression than patients not being in MMR on any other time point as well. With this model we can give hints when to define MMR as failure and a change in therapy should be considered. Despite this we should keep in mind that the earlier MMR was achieved the higher was the chance to achieve deep molecular response later during therapy.
Cubic smoothing function of the HR to predict PFS with confidence intervals
Cubic smoothing function of the HR to predict PFS with confidence intervals
Landmark analysis at 2.25 years for PFS of the VS
Saussele:Novartis: Honoraria, Research Funding, Travel Other; Bristol-Myers Squibb: Honoraria, Research Funding, Travel, Travel Other; Pfizer: Honoraria, Travel, Travel Other. Hehlmann:Bristol-Myers Squibb: Research Funding; Novartis: Research Funding. Schnittger:MLL Munich Leukemia Laboratory: Equity Ownership. Hanfstein:Novartis: Research Funding; Bristol-Myers Squibb: Honoraria. Neubauer:MedUpdate: Honoraria, Speakers Bureau. Kneba:Novartis: Consultancy, Equity Ownership, Honoraria, Membership on an entity's Board of Directors or advisory committees, Research Funding. Pfirrmann:Novartis: Consultancy; Bristol-Myers Squibb: Honoraria. Hochhaus:Novartis: Consultancy, Honoraria, Research Funding; Bristol-Myers Squibb: Consultancy, Honoraria; ARIAD: Honoraria, Research Funding; Pfizer: Consultancy, Research Funding. Müller:Novartis: Honoraria, Research Funding; Bristol Myers Squibb: Honoraria, Research Funding; ARIAD: Honoraria, Research Funding; Pfizer: Honoraria, Research Funding.
Author notes
Asterisk with author names denotes non-ASH members.

This icon denotes a clinically relevant abstract


This feature is available to Subscribers Only
Sign In or Create an Account Close Modal