Abstract

Background: Availability of cardiac magnetic resonance imaging (CMR) to evaluate myocardial T2* (hereafter mT2*) in the management of cardiac siderosis is restricted in certain regions of the world. Hence, identifying predictors of mT2* changes would be valuable. Although appropriate chelation therapy is shown to reduce cardiac iron overload, data linking mT2* response to patient characteristics and other clinical measurements is limited. The objective of this analysis was to identify a model of the strongest predictors of mT2*, which did not require magnetic resonance imaging (MRI). A multivariate analysis on the 3-year EPIC (ICL670A2409) cardiac data was performed, using serum ferritin (SF) and other clinical characteristics.
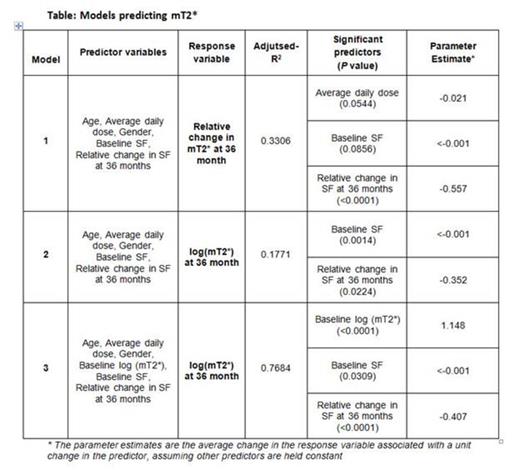
Methods: EPIC cardiac 3 year sub-study evaluating thalassemia major patients, has been described previously (Pennell et al., 2012). All patients included in this analyses, received deferasirox and had at least one mT2* value during the second of year of the extension. Two response variables were analyzed: mT2* (normalized by log transformation) at end of study (EOS) and relative change (%) in mT2*. Predictor variables were selected based on potential clinical impact on mT2*, assuming limited MRI availability, and included age at baseline (BL), gender, average drug dose, SF at BL, relative change in SF, and log (mT2*) at BL. Pairwise correlations were evaluated to assist in the model development. Multiple linear regression (MLR) analysis using forward selection, backward elimination and stepwise, was performed to identify the best model and those variables significantly contributing to the model to predict relative change in mT2* and EOS mT2*. Results are presented (Table) as adjusted R2 (adj-R2) indicative of predictive ability of the model (higher the better), variables significantly contributing to the model (at a significance level of 0.1 used in the model selection process), and parameter estimates which assess the influence of each of the variables tested, has on the overall model. SAS PROC GLM and GLMSELECT were used for analysis.
Results: Of the 71 patients who continued into 3rd year of this study, 64 patients were evaluable for this analysis. Pearson univariate correlation analyses evaluating relative change in mT2* and a number of variables, demonstrated the strongest correlation with relative change in SF (r=-0.5067; P <0.001). Using MLR, 3 models were evaluated and are presented (Table). Model 1 was designed to evaluate relative change in mT2* as the response variable, and included the following predictor variables: age at BL, gender, average drug dose, SF at BL, relative change in SF and resulted in an adj-R2=0.33. Of these variables, average daily dose, SF at BL and relative change in SF were significant predictors. Models 2 and 3 were designed to predict absolute mT2* at EOS. Model 2 incorporated the same predictor variables as Model 1, and resulted in a low adj-R2 (0.177). Of the variables included, significant contributors to the model were SF at BL and relative change in SF. Adding mT2* at BL as shown in Model 3, considerably increased the predictability of the model (adj-R2 =0.768). Across the models, relative change in SF had a strong influence on the predictability as well as BL mT2* when included, as shown by the higher parameter estimates compared to the other variables.
Discussion: Previous publications have evaluated the relationship between absolute value of SF and mT2* and have demonstrated a relatively weak correlation (Anderson et al., 2001; Eghbali et al., 2014). The current analyses, further evaluates this relationship but considers relative change in SF as a predictor of mT2* response as well as the potential influence of other clinical characteristics. This analysis is the first to demonstrate a moderate correlation between relative change in SF and relative change in mT2*. Within the MLR Model 1, considering other clinical characteristics, relative change in SF had the most influence on the predictability of relative change in mT2*. Hence, there appears to be a relationship between the trajectory in the change in SF and relative change in mT2* which has not been previously identified, although, the overall model accounted for only 33% of the variability. Further analyses of shorter time points of SF would be helpful in providing more information on utility of SF change as a useful parameter in monitoring mT2* in absence of CMR.
Porter:Novartis: Consultancy, Honoraria, Research Funding; Shire: Consultancy, Honoraria; Celgene: Consultancy; Cerus: Membership on an entity's Board of Directors or advisory committees; Alnylam: Membership on an entity's Board of Directors or advisory committees. Taher:Novartis Pharma: Honoraria, Research Funding. Aydinok:Novartis: Membership on an entity's Board of Directors or advisory committees, Research Funding, Speakers Bureau. El-Ali:Novartis: Employment. Chakravarty:Novartis: Employment. Cappellini:Novartis Pharma: Honoraria, Speakers Bureau; Genzyme: Honoraria.
Author notes
Asterisk with author names denotes non-ASH members.

This icon denotes a clinically relevant abstract


This feature is available to Subscribers Only
Sign In or Create an Account Close Modal