In this issue of Blood, An et al provide human and murine transcriptome data revealing significant stage- and species-specific differences in gene expression during erythroblast maturation.1
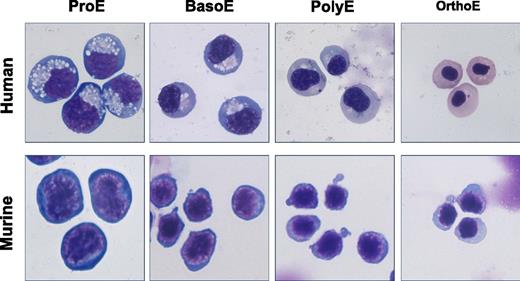
Human and murine erythroblasts undergo comparable progressive stages of maturation characterized by changes in cell size, nuclear condensation, and loss of cytoplasmic basophilia. These features are used to classify the cells as proerythroblasts (ProE), basophilic erythroblasts (BasoE), polychromatophilic erythroblasts (PolyE), and orthochromatic erythroblasts (OrthoE). All erythroblast images were kindly provided by Dr Xiuli An, New York Blood Center, with mouse erythroblast images adapted from Liu et al.8 All images were color corrected and cropped by J.P.
Human and murine erythroblasts undergo comparable progressive stages of maturation characterized by changes in cell size, nuclear condensation, and loss of cytoplasmic basophilia. These features are used to classify the cells as proerythroblasts (ProE), basophilic erythroblasts (BasoE), polychromatophilic erythroblasts (PolyE), and orthochromatic erythroblasts (OrthoE). All erythroblast images were kindly provided by Dr Xiuli An, New York Blood Center, with mouse erythroblast images adapted from Liu et al.8 All images were color corrected and cropped by J.P.
The process of erythroblast maturation is characterized by a progressive decrease in cell size, nuclear condensation and ultimate extrusion (in mammals), and the loss of cytoplasmic basophilia due, in part, to the accumulation of hemoglobin. As shown in the figure, these striking morphological features have been used by hematologists in the clinic to classify erythroblasts in disease states and by investigators in the laboratory to study erythroid maturation both during development and across species. The overarching similarities of this morphological process both in humans and in mice have implied the existence of similar molecular mechanisms regulating erythropoiesis in these organisms and has helped to justify the use of mouse models to study gene function and erythroid cell maturation.
Over the last decade, global gene expression studies have been carried out to better understand the processes associated with the synthesis of red cells. These have included, among several, the characterization of genes expressed in cultured human erythroblasts found in Hembase2 and the Human Erythroblast Maturation database,3 in a cultured murine erythroid cell line following expression of the transcriptional regulator Gata1 in G1EDb,4 and in primary murine erythroblasts directly isolated from embryos,5,6 as well as from fetal liver and adult bone marrow in erythronDB.6
Although many of these studies have relied on flow cytometry to isolate pure populations of staged erythroblasts, the erythroid lineage, unlike its lymphoid and myeloid cousins in the marrow, has lacked a plethora of cell surface markers to help distinguish progressive stages of maturation. Expression of glycophorin A (CD235/Ter119) and the transferrin receptor (CD71) has been widely used to analyze erythroblast progression by flow cytometry. Recent refinements by the authors have brought band 3 and α4-integrin to the flow cytometry-based isolation of staged human erythroblasts7 and CD44 expression to the isolation of their murine counterparts.8
Using these novel flow cytometric approaches, An et al analyzed the global gene expression of cultured human erythroblasts and primary murine erythroblasts, as they mature (see figure) from proerythroblast to orthochromatic erythroblast stages. Importantly, they find that each specific stage of erythroblast maturation is characterized by a unique transcriptome, which complements the well-recognized morphological differences evident in these populations. These findings also support the concept that erythroid maturation is characterized by cell divisions that result in 2 daughter cells that differ markedly from their parent cell. Clearly erythroblasts can walk (proliferate) and chew gum (differentiate) at the same time.
The authors also compare the human and murine erythroid transcriptomes and find both broad similarities, as well as marked differences, eg, in the expression of genes associated with the mitogen-activated protein kinase pathway and the E3 ubiquitin ligase family of genes. These dissimilarities add to previously identified differences between mouse and human erythropoiesis, most notably the lack of a fetal form of hemoglobin in the mouse. A similar conclusion regarding the marked differences in gene expression between human and mouse erythropoiesis has also been reached by an independent analysis of previously published gene expression data of human and mouse erythroblasts isolated by flow cytometry.9
These marked differences in mouse and human erythroid transcriptomes are surprising given the morphological similarities that occur in both species to ultimately form a biconcave disc containing mostly hemoglobin. There certainly can be different pathways that achieve the same end result. However, a caveat of both studies1,9 is that the mouse erythroblasts were isolated directly from the bone marrow, whereas the human erythroblasts were derived from prolonged in vitro culture of neonatal or adult CD34-positive cells that mature as a cohort. Because mammalian erythroblasts normally mature attached to macrophage cells within erythroblastic islands, it remains to be determined how many of the species-specific differences in gene expression might be due to the in vitro microenvironment of the cultured human erythroblasts.
Most studies of global erythroid gene expression have relied on chip-based technologies. A significant strength of this study is the use of RNA-Seq (RNA Sequencing) to generate the gene expression data. For example, this approach has now permitted the global analysis of ribosomal genes, which surprisingly make up a significant proportion of the most abundantly expressed genes present in human proerythroblasts and basophilic erythroblasts. In addition, this approach offers the possibility of analyzing the expression of splice variants, including the identification of novel erythroid-specific variants, as well as noncoding RNAs during erythroid maturation. Such analyses of these databases are eagerly awaited and should certainly lead to new insights regarding the regulation of human erythropoiesis, as well as that of its closest model organism.
Conflict-of-interest disclosure: The author declares no competing financial interests.

