Key Points
IRP1 controls HIF2α mRNA translation in vivo and thereby acts as an upstream regulator of Epo expression.
IRP1 deficiency leads to age-dependent erythropoietic abnormalities and misregulation of body iron metabolism via the HIF2α/Epo pathway.
Abstract
Hypoxia inducible factor 2α (HIF2α) transcriptionally activates several genes in response to hypoxia. Under normoxic conditions, it undergoes oxygen-dependent degradation by the prolyl hydroxylase (PHD)/von Hippel-Lindau (VHL) system. The presence of an iron-responsive element (IRE) within the 5′ untranslated region of HIF2α mRNA suggests a further iron- and oxygen-dependent mechanism for translational regulation of its expression via iron regulatory proteins 1 and 2 (IRP1 and IRP2, respectively). We show here that the disruption of mouse IRP1, but not IRP2, leads to profound HIF2α-dependent abnormalities in erythropoiesis and systemic iron metabolism. Thus, 4- to 6-week-old IRP1−/− mice exhibit splenomegaly and extramedullary hematopoiesis, which is corrected in older animals. These erythropoietic abnormalities are caused by translational de-repression of HIF2α mRNA and subsequent accumulation of HIF2α, which induces expression of erythropoietin (Epo). Increased levels of circulating Epo lead to reticulocytosis, polycythemia, and suppression of hepatic hepcidin mRNA. This in turn promotes hyperferremia and iron depletion in splenic macrophages due to unrestricted expression of ferroportin. Our data demonstrate that IRP1 is the principal regulator of HIF2α mRNA translation in vivo and provide evidence that translational control of HIF2α expression dominates over PHD/VHL-mediated regulation of HIF2α stability in juvenile IRP1−/− mice.
Introduction
Hypoxia inducible factor (HIF) is a phylogenetically conserved transcriptional regulator that orchestrates homeostatic remodeling under hypoxia.1 It consists of an inducible α subunit (HIF1α, HIF2α, or HIF3α), which heterodimerizes with constitutive HIF1β (also known as ARNT1) for binding to hypoxia response elements within the promoters of genes involved in angiogenesis, erythropoiesis, energy metabolism, iron homeostasis, inflammation, and tumorigenesis. Transcriptional activation is mediated by the N- and C-terminal transactivation domains of the HIFα subunits. HIF1α and HIF2α (encoded by the EPAS1 gene) are paralogs and regulate common but also distinct sets of genes, whereas HIF3α mostly acts as a dominant negative inhibitor.2 In oxygenated cells, both HIF1α and HIF2α are unstable and undergo rapid degradation by the proteasome following oxygen- and iron-dependent prolyl hydroxylation, which is essential for their recognition by the von Hippel-Lindau protein (pVHL), an E3 ubiquitin ligase.3 Hypoxia (or iron deficiency) inhibits prolyl hydroxylases (PHDs), resulting in HIF1α and HIF2α accumulation.
HIF2α but not HIF1α mRNA harbors a stem-loop structure within its 5′ untranslated region (UTR) with the hallmarks of an atypical iron-responsive element (IRE),4 suggesting posttranscriptional regulation of its expression via the IRE/iron regulatory protein (IRP) system. In iron-deficient cells, the iron regulatory proteins IRP1 and IRP2 bind with high affinity to 5′ UTR IREs, thereby inhibiting mRNA translation.5 IRPs are homologous and exhibit partial redundancy in target specificity but are regulated by distinct mechanisms. In iron-replete cells, IRP1 assembles a 4Fe-4S cluster that converts it to cytosolic aconitase at the expense of its RNA-binding activity, whereas IRP2 undergoes proteasomal degradation following ubiquitination by FBXL5. This E3 ubiquitin ligase senses iron and oxygen levels via an Fe-O-Fe center.6,7 Lack of iron or oxygen inactivates FBXL5 by loss of its Fe-O-Fe center, which leads to accumulation of IRP2 and induction of its RNA-binding activity. By contrast, hypoxia inhibits the RNA-binding activity of IRP1 by protecting its 4Fe-4S cluster and maintaining the protein in the cytosolic aconitase form.8
The oxygen-dependent regulation of IRPs and the presence of a functional IRE in the 5′ UTR of HIF2α mRNA links oxygen and iron metabolism. A further link is provided by the hypoxic suppression of hepcidin, an iron regulatory hormonal peptide.9 Hepcidin acts by binding to the sole iron exporter ferroportin and promotes its lysosomal degradation, thereby limiting iron efflux from cells.9 Interestingly, ferroportin encoded by an IRE-containing mRNA isoform is also regulated by IRPs.5
Even though purified recombinant IRP1 and IRP2 bind with similar affinities to radiolabeled HIF2α IRE probes,4 the expression of HIF2α mRNA is exclusively regulated by IRP1 in cells.10 We demonstrate herein that IRP1 specifically regulates HIF2α mRNA translation and HIF2α-dependent physiological responses in mice. Thus, IRP1−/− but not IRP2−/− mice develop splenomegaly, extramedullary hematopoiesis, reticulocytosis, and polycythemia due to increased expression of Epo, a known transcriptional target of HIF2α.11 Moreover, IRP1−/− mice manifest translational de-repression of HIF2α mRNA and misregulate hepcidin expression and systemic iron homeostasis. Our data suggest that IRP1 operates as a key upstream regulator of HIF2α in vivo.
Methods
Animals
IRP1−/− and IRP2−/− mice on a C57BL/6 background12 were kindly provided by Dr M. W. Hentze (EMBL, Heidelberg, Germany). Wild-type (WT) isogenic littermates were generated by breeding IRP1+/− or IRP2+/− animals. For liver-specific disruption of HIF2α, IRP1−/− mice were crossed with EPAS1 floxed mice (Epas1tm1Mcs/J) and then crossed with Albumin-cre [B6.Cg-Tg(Alb-cre)21Mgn/J] mice, both purchased from Jackson Laboratory. All animals were housed in macrolone cages (up to 5 mice per cage, 12:12-hour light-dark cycle: 7:00 am to 7:00 pm; 22 ± 1°C, 60 ± 5% humidity) according to standard institutional guidelines. Only males were used for experiments. At the end point, the animals were euthanized by CO2 inhalation. Experimental procedures were approved by the Animal Care Committee of McGill University (protocol 4966).
CBC measurements
Blood was collected via cardiac puncture and stored in a microvette (Sarstedt) for less than 2 hours before analysis. Complete blood count (CBC) values were acquired using 12 μL of whole blood per sample and the Scil Vet-ABC hematology analyzer.
Serum biochemistry
Blood was collected via cardiac puncture, clotted at room temperature for 30 minutes, and centrifuged at 2000g for 10 minutes, and serum was collected for analysis. Serum iron, transferrin saturation, and ferritin were determined as previously described.13
Measurement of serum Epo
Serum erythropoietin (Epo) levels were quantified by using the DuoSet mouse Epo enzyme-linked immunosorbent assaykit (R&D Systems).
Histology
Tissue specimens were fixed in 10% buffered formalin and embedded in paraffin. De-paraffinized tissue sections were stained with hematoxylin and eosin to assess tissue architecture and with Perls’ Prussian blue to visualize ferric iron deposits.13
Immunohistochemistry
Tissue samples were cut at 4 µm, placed on SuperFrost/Plus slides (Fisher), and dried overnight at 37°C. The slides were then loaded onto the Discovery XT Autostainer (Ventana Medical System). Solutions used for automated immunohistochemistry were from Ventana Medical System. Slides underwent de-paraffinization and heat-induced epitope retrieval. Immunostaining was performed by using a 1:500 dilution of rabbit polyclonal ferroportin antibody14 and an appropriate detection kit (Omnimap anti-Rabbit HRP Ref: 760-4311 and ChromoMap-DAB Ref: 760-159). A negative control was performed by the omission of the primary antibody. Slides were counterstained with hematoxylin for 4 minutes, blued with Bluing Reagent for 4 minutes, removed from the autostainer, washed in warm soapy water, dehydrated through graded alcohols, cleared in xylene, and mounted with Permount (Fisher). Sections were analyzed by conventional light microscopy.
Fluorescence-activated cell sorting
Cells were freshly isolated from the spleen or bone marrow of mice. Spleen cell suspensions were filtered with a cell strainer. Cells counts were obtained with a Coulter Counter (Beckman). Cells (2 × 10⁶) were washed with phosphate buffered saline (PBS) and incubated on ice for 30 minutes with PBS containing 20% fetal bovine serum. Staining buffer (PBS containing 5% fetal bovine serum) was used for incubation with antibodies. Unstained cells were used as controls and isotype controls. Cells were incubated with 0.5 μg CD71-FITC and/or 0.2 μg TER119-PE (eBioscience) or with isotype controls (PE or FITC; BioLegend) in the dark, at 4°C, for 30 minutes. Subsequently, the cells were washed 3 times with PBS and fixed, in the dark, at 4°C, for 15 minutes in fixation solution (1% paraformaldehyde in PBS). Following 2 final washes, the cells were resuspended in staining buffer for analysis by BD FACS Calibur.
Polysome fractionation
RNA was freshly prepared from kidneys as previously described.15 Samples were centrifuged at 13 000g for 10 minutes at 4°C. Supernatants were removed, and 100 μg/mL of heparin was added to each sample. Fifteen OD254 of rRNA was loaded on 5% to 50% sucrose gradients, made by using the Gradient master 108 (Biocomp). Sucrose solutions contained 20 mM N-2-hydroxyethylpiperazine-N'-2-ethanesulfonic acid (pH 7.6), 100 mM KCl, 5 mM MgCl2, 10 mg/mL cycloheximide, protease inhibitor mix, 10 U/mL RNasin (Promega), and 0.1 mM dithiothreitol. Fractionation was accomplished by centrifugation at 190 000g for 2 hours at 4°C via a SW41Ti swinging rotor (Beckman). Fractions were separated and collected by the BR-188 Density Gradient Fractionation System (Brandel).
Quantitative real-time polymerase chain reaction analysis from polysomal fractions
RNA was extracted from pooled polysomal fractions by using the TRIzol Reagent (Life Technologies) with the addition of 2 μL of Pellet Paint Co-Precipitant (Novagen) per extraction. RNA (1 μg) was reverse transcribed by using the QuantiTect Reverse Transcription Kit (Qiagen). Primers pairs (supplemental Table 2, available on the Blood website) were validated by dissociation curve analysis and demonstrated amplification efficiency between 90% and 110%. RNA was analyzed by the absolute quantification method, as described previously.16
Analysis of tissue mRNA
RNA was extracted from tissues with the TRIzol Reagent (Life Technologies). cDNA was synthesized by using either the QuantiTect Reverse Transcriptase kit (Qiagen) or the SuperScript First Strand Synthesis System (Invitrogen). Hepcidin and Epo mRNAs were quantified by quantitative polymerase chain reaction.13 Primers are shown in supplemental Table 2.
Western blotting
Tissue samples were homogenized as previously described.17 Protein extracts (30 μg) were resolved by sodium dodecyl sulfate-polyacrylamide gel electrophoresis on 10% gels and transferred onto nitrocellulose membranes (BioRad). The blots were blocked in 10% bovine serum albumin in PBS containing 0.1% (v/v) Tween-20 (PBS-T) and probed overnight with antibodies against IRP1,18 HIF2α (Novus), TfR1 (Zymed), or β-actin (Sigma-Aldrich). Following a 3× wash with PBS-T, the membranes were incubated with peroxidase-coupled secondary antibodies for 1 hour. Immunoreactive bands were detected by enhanced chemiluminescence with either the Western Lightning ECL Kit (PerkinElmer) or the SuperSignal West Femto Maximum Sensitivity Substrate (Thermo) and quantified by densitometric scanning.
Cell culture experiments
Lentiviral silencing of IRP1 in cultured human 786-O renal carcinoma cells was performed as previously described.10
Statistical analysis
Data are expressed as mean ± standard error mean. Statistical analysis was performed by using the Prism GraphPad software (version 5.0d). Analysis of multiple groups was done by 1-way ANOVA and for only 2 groups by the Student t test. A probability value P < .05 was considered to be statistically significant.
Results
Juvenile IRP1−/− mice exhibit extramedullary hematopoiesis and polycythemia
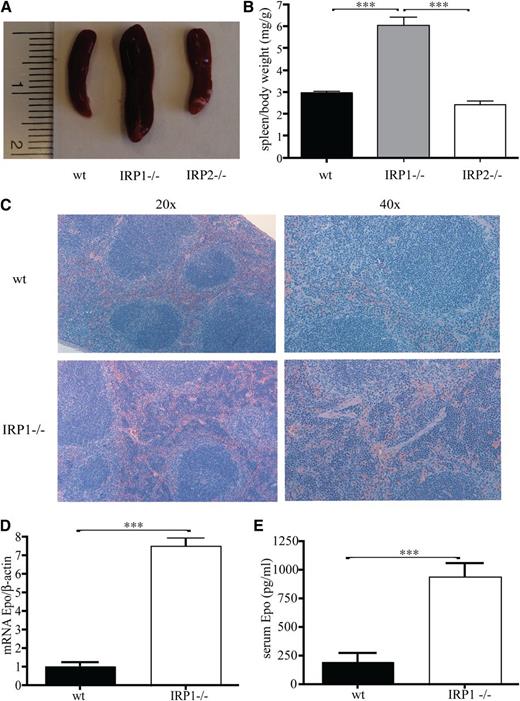
Having established the critical function of IRP1 in controlling HIF2α mRNA translation in cultured cells,10 we used 4- to 6-week-old male IRP1−/− mice to address how the targeted disruption of IRP1 affects HIF2α-dependent physiological responses. We noted that the spleens of the IRP1−/− mice are considerably enlarged (Figure 1A), whereas spleen to body weight exhibits a marked twofold (P < .001) increase compared with that of age- and sex-matched isogenic wild-type and IRP2−/− counterparts (Figure 1B). Histological analysis revealed that splenomegaly is associated with expansion of the splenic red pulp, which indicates extramedullary hematopoiesis (Figure 1C). Importantly, this phenotype is linked to a dramatic sevenfold (P < .001) induction in renal Epo mRNA expression (Figure 1D) and a fourfold (P < .001) increase in circulating Epo levels (Figure 1E).
Juvenile IRP41−/− mice present with splenomegaly, extramedullary hematopoiesis, and increased Epo expression. WT, IRP1−/−, and IRP2−/− mice (n = 7) were euthanized at the age of 4 to 6 weeks. (A) Spleen size. (B) Spleen to body weight ratios. (C) Hematoxylin and eosin staining of spleen sections; magnifications at (left) 20× and (right) 40×. (D) Epo mRNA expression in the kidneys (n = 5). (E) Serum Epo levels (n = 5). ***P < .001.
Juvenile IRP41−/− mice present with splenomegaly, extramedullary hematopoiesis, and increased Epo expression. WT, IRP1−/−, and IRP2−/− mice (n = 7) were euthanized at the age of 4 to 6 weeks. (A) Spleen size. (B) Spleen to body weight ratios. (C) Hematoxylin and eosin staining of spleen sections; magnifications at (left) 20× and (right) 40×. (D) Epo mRNA expression in the kidneys (n = 5). (E) Serum Epo levels (n = 5). ***P < .001.
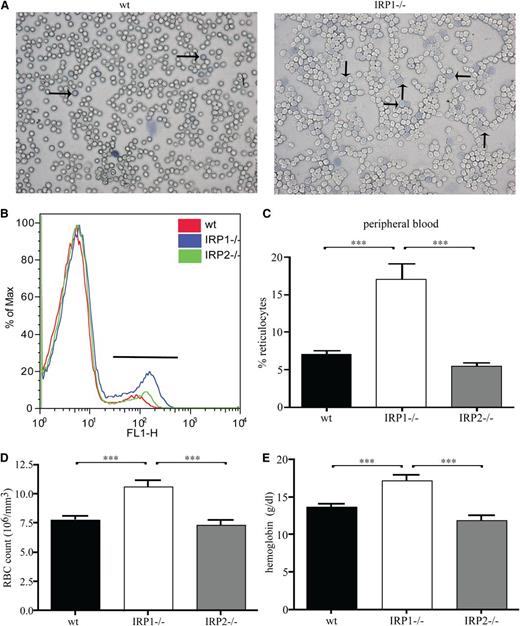
These findings suggest that the lack of IRP1 leads to stress erythropoiesis. In fact, analysis of peripheral blood smears by Diff-Quick staining documented pathologically increased numbers of reticulocytes in IRP1−/− mice compared with WT controls (Figure 2A). Reticulocytosis was further confirmed by flow cytometric analysis with the thiazole orange dye that binds to DNA of reticulocytes (Figure 2B). Quantification of the data shows that IRP1−/− mice contain 2.5 times more reticulocytes (P < .001) in their peripheral blood compared with WT and IRP2−/− animals (Figure 2C). Furthermore, they develop polycythemia, with a 37% (P < .001) increase in red blood cell content (Figure 2D). In addition, IRP1−/− mice have increased hemoglobin values (by 35%, P < .001 vs WT and by 43%, P < .001 vs IRP2−/−; Figure 2E), without any alterations in mean corpuscular volume and mean corpuscular hemoglobin (supplemental Table 1). CBC values are shown in supplemental Table 1.
IRP1 deficiency leads to reticulocytosis and polycythemia. WT, IRP1−/−, and IRP2−/− mice (n = 7) were euthanized at the age of 4 to 6 weeks. (A) Peripheral blood smear stained for reticulocytes (indicated by arrows). (B) Fluorescence-activated cell sorter analysis of peripheral blood stained with thiazole orange. (C) Percentage of reticulocytes in peripheral blood. (D) Red blood cell (RBC) count. (E) Hemoglobin values. ***P < .001.
IRP1 deficiency leads to reticulocytosis and polycythemia. WT, IRP1−/−, and IRP2−/− mice (n = 7) were euthanized at the age of 4 to 6 weeks. (A) Peripheral blood smear stained for reticulocytes (indicated by arrows). (B) Fluorescence-activated cell sorter analysis of peripheral blood stained with thiazole orange. (C) Percentage of reticulocytes in peripheral blood. (D) Red blood cell (RBC) count. (E) Hemoglobin values. ***P < .001.
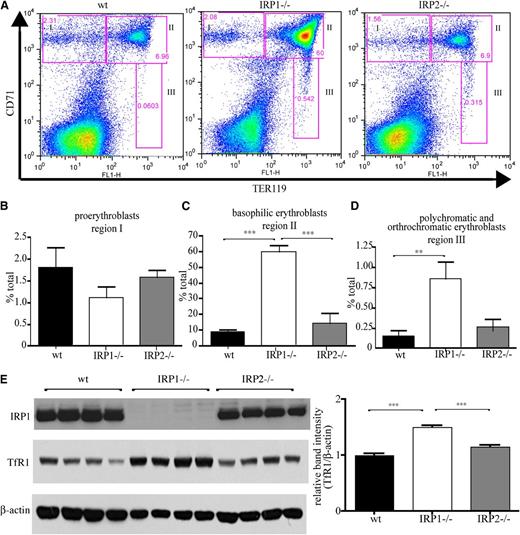
Flow cytometric analysis of erythroid differentiation with the Ter119 and CD71 (TfR1) markers (Figure 3A) uncovers that spleens of IRP1−/− mice contain significantly increased populations of late stage basophilic erythroblasts (6.8-fold, P < .001 vs WT; Figure 3C), as well as polychromatic and orthochromatic erythroblasts (5.8-fold, P < .01 vs WT; Figure 3D). Numbers of early stage proerythroblasts did not differ significantly among IRP1−/−, WT, and IRP2−/− animals (Figure 3B). Similar results were obtained by analysis of erythroid differentiation in the bone marrow, yet the differences were less pronounced (supplemental Figure 1). The gating used in the flow cytometry experiments is shown in supplemental Figure 2. Induction of TfR1 in the spleens of IRP1−/− mice is also documented by western blotting (Figure 3E).
IRP1 deficiency stimulates erythroid cell differentiation in the spleen. WT, IRP1−/−, and IRP2−/− mice (n = 7) were euthanized at the age of 4 to 6 weeks, and splenic cells were analyzed by fluorescence-activated cell sorter. (A) CD71 and TER119 staining. (B) Region I: the proerythroblast population (CD71high TER119low). (C) Region II: the basophilic erythroblast population (CD71high TER119high). (D) Region III: the hemoglobin producing polychromatic and orthochromatic erythroblasts (CD71low-medium TER119high). (E) (Left) Western blots of IRP1, TfR1, and β-actin in splenic tissue from WT, IRP1−/−, or IRP2−/− mice (n = 4). (Right) Densitometric quantification of TfR1 expression. **P < .01; ***P < .001.
IRP1 deficiency stimulates erythroid cell differentiation in the spleen. WT, IRP1−/−, and IRP2−/− mice (n = 7) were euthanized at the age of 4 to 6 weeks, and splenic cells were analyzed by fluorescence-activated cell sorter. (A) CD71 and TER119 staining. (B) Region I: the proerythroblast population (CD71high TER119low). (C) Region II: the basophilic erythroblast population (CD71high TER119high). (D) Region III: the hemoglobin producing polychromatic and orthochromatic erythroblasts (CD71low-medium TER119high). (E) (Left) Western blots of IRP1, TfR1, and β-actin in splenic tissue from WT, IRP1−/−, or IRP2−/− mice (n = 4). (Right) Densitometric quantification of TfR1 expression. **P < .01; ***P < .001.
We conclude that the disruption of IRP1 stimulates late erythroid differentiation in response to induction of Epo expression. Nevertheless, we noted that the hematopoietic abnormalities of IRP1−/− mice are corrected with age. Thus, after 8 to 10 weeks of age, IRP1−/− mice exhibit normal CBC values (supplemental Table 1) and spleen to body weight (supplemental Figure 3), suggesting that compensatory mechanism(s) reverse and neutralize the pathology caused by the lack of IRP1.
IRP1 deficiency leads to translational de-repression of renal HIF2α mRNA
Under physiological conditions, circulating Epo is primarily derived from renal intestitial fibroblasts and is transcriptionally activated by HIF2α in response to hypoxia.11,19 Considering that IRP1 is highly expressed in the kidneys20 and IRP1 acts as a specific suppressor of HIF2α synthesis in 786-O renal carcinoma cells,10 we hypothesized that increased Epo expression in juvenile IRP1−/− mice is caused by translational de-repression of HIF2α mRNA. First, we further validated that IRP1 specifically controls HIF2α levels in 786-O cells, which express an inactive pVHL mutant and thus fail to mount oxygen- and iron-dependent HIF2α degradation.10 Treatment of these cells with the iron chelator desferrioxamine inhibits HIF2α expression, whereas knockdown of IRP1 by RNA interference fully restores HIF2α levels (supplemental Figure 4). This result suggests that desferrioxamine inhibits HIF2α mRNA translation by inducing IRP1 for IRE binding.
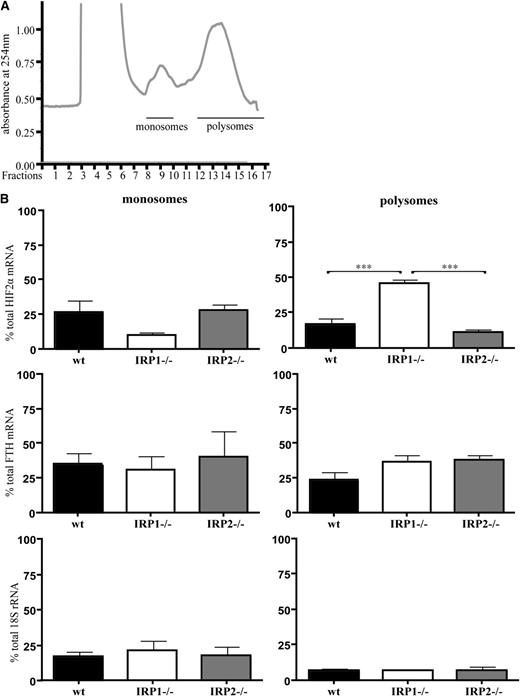
Next, we analyzed how IRP1 deficiency affects HIF2α mRNA translation in mouse tissues. Kidneys from 6-week-old WT, IRP1−/−, and IRP2−/− mice were homogenized, and extracts were fractionated on sucrose gradients to separate translationally silent monosomes from actively translating polysomes. The distribution of HIF2α mRNA, H-ferritin mRNA, and 18S rRNA within the different fractions was monitored by quantitative polymerase chain reaction. The data in Figure 4 show a substantial shift of HIF2α mRNA from monosomes to polysomes in IRP1−/− kidneys. Furthermore, levels of polysome-associated HIF2α mRNA were significantly higher in IRP1−/− kidneys compared with those of the other genotypes (2.7-fold, P < .001 vs WT and 4-fold, P < .001 vs IRP2−/−). On the other hand, polysomes from WT and IRP2−/− kidneys contained lower levels of HIF2α mRNA than monosomes. Notably, the polysomal association of HIF2α mRNA in IRP1−/− kidneys was more pronounced compared with that of H-ferritin mRNA, which was used as a positive control because it is expected to be translationally active in IRP1−/− and IRP2−/− tissues. A trend for enrichment of H-ferritin mRNA in polysomal fractions of IRP1−/− and IRP2−/− kidneys is apparent; however, it did not reach statistical significance. As expected, there was no difference in the 18S rRNA content among polysomal fractions from WT, IRP1−/−, and IRP2−/− kidneys. Taken together, these data demonstrate that the lack of IRP1 leads to translational de-repression of renal HIF2α mRNA.
Translational de-repression of HIF2α mRNA in IRP1−/− kidneys. WT, IRP1−/−, and IRP2−/− mice were euthanized at the age of 6 weeks. RNA was prepared from kidneys and analyzed by sucrose gradient fractionation. (A) A typical kidney polysomal profile from 6-week-old mice. Pooled monosomes (fractions 9 and 10) and polysomes (fractions 12-17) are shown. (B) Distribution of HIF2α mRNA, H-ferritin (FTH) mRNA, and 18S rRNA among monosomal and polysomal fractions. Relative quantities of target genes were normalized to the internal control β-actin that was then normalized to the level of input mRNA. Data were obtained from n = 6 mice. ***P < .001.
Translational de-repression of HIF2α mRNA in IRP1−/− kidneys. WT, IRP1−/−, and IRP2−/− mice were euthanized at the age of 6 weeks. RNA was prepared from kidneys and analyzed by sucrose gradient fractionation. (A) A typical kidney polysomal profile from 6-week-old mice. Pooled monosomes (fractions 9 and 10) and polysomes (fractions 12-17) are shown. (B) Distribution of HIF2α mRNA, H-ferritin (FTH) mRNA, and 18S rRNA among monosomal and polysomal fractions. Relative quantities of target genes were normalized to the internal control β-actin that was then normalized to the level of input mRNA. Data were obtained from n = 6 mice. ***P < .001.
HIF2α accumulates in kidneys of juvenile IRP1−/− mice.
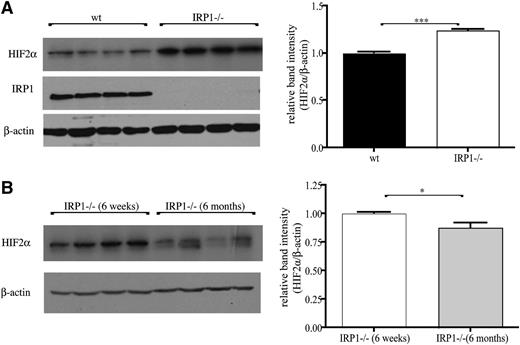
Kidneys of 6-week-old IRP1−/− mice exhibited a significant 25% increase (P < .001) in HIF2α protein levels compared with age-matched WT controls (Figure 5A), suggesting that the unimpeded translation of renal HIF2α mRNA leads to protein accumulation. Interestingly, HIF2α overexpression was diminished in 6-month-old IRP1−/− mice, and HIF2α levels recovered to normal (Figure 5B; note that recovery was complete in some animals and partial in others). Assuming that the lack of IRP1 allows efficient HIF2α mRNA translation without temporal restrictions, the observed age-dependent differences in HIF2α steady-state levels likely reflect alterations in protein stability. The normalization of renal HIF2α expression in 6-month-old IRP1−/− is consistent with the correction of the hematological abnormalities in these animals.
Accumulation of HIF2α protein in the kidneys of IRP1−/− mice is age dependent. (A) (Left) Western blots of IRP1, HIF2α, and β-actin in kidneys of 6-week-old WT and IRP1−/− mice (n = 4). (Right) Densitometric quantification of HIF2α expression. (B) (Left) Comparative western blot and (right) densitometric quantification of HIF2α expression in kidneys of 6-week- and 6-month-old IRP1−/− mice (n = 4). *P < .05; ***P < .001.
Accumulation of HIF2α protein in the kidneys of IRP1−/− mice is age dependent. (A) (Left) Western blots of IRP1, HIF2α, and β-actin in kidneys of 6-week-old WT and IRP1−/− mice (n = 4). (Right) Densitometric quantification of HIF2α expression. (B) (Left) Comparative western blot and (right) densitometric quantification of HIF2α expression in kidneys of 6-week- and 6-month-old IRP1−/− mice (n = 4). *P < .05; ***P < .001.
IRP1 deficiency leads to HIF2α-dependent induction of hepatic Epo mRNA.
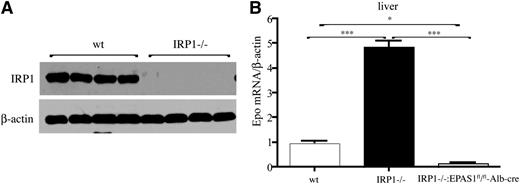
Hepatocytes are a secondary source of Epo production.11 We therefore compared Epo mRNA expression in the livers of WT and IRP1−/− mice. Moreover, we generated IRP1−/− mice bearing hepatocyte-specific disruption of the Epas1 gene to explore the role of HIF2α in IRP1-dependent regulation of Epo. IRP1 deficiency in the liver (shown in Figure 6A) promoted a 4.5-fold increase (P < .001) in hepatic Epo mRNA levels, and this response was completely abrogated in double IRP1−/− and hepatocyte-specific HIF2α−/− mice (Figure 6B). These findings provide genetic evidence that IRP1 controls Epo expression by regulating HIF2α mRNA translation.
Induction of hepatic Epo mRNA in IRP1−/− mice is mediated by HIF2α. (A) Western blot analysis of IRP1 and β-actin in livers of 6-week-old WT and IRP1−/− mice (n = 4). (B) Analysis of Epo mRNA expression by quantitative polymerase chain reaction in livers of 6-week-old WT IRP1−/−, and IRP1−/−:EPAS1fl/fl-Alb-cre mice (n = 6). *P < .05; ***P < .001.
Induction of hepatic Epo mRNA in IRP1−/− mice is mediated by HIF2α. (A) Western blot analysis of IRP1 and β-actin in livers of 6-week-old WT and IRP1−/− mice (n = 4). (B) Analysis of Epo mRNA expression by quantitative polymerase chain reaction in livers of 6-week-old WT IRP1−/−, and IRP1−/−:EPAS1fl/fl-Alb-cre mice (n = 6). *P < .05; ***P < .001.
Juvenile IRP1−/− mice exhibit suppressed hepcidin expression and misregulate systemic iron homeostasis
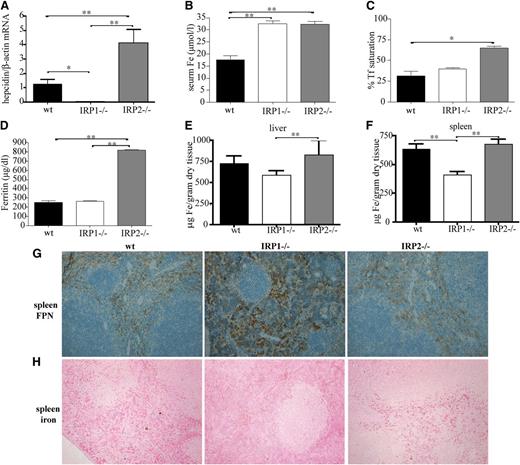
Enhanced erythropoietic activity requires high iron supply to erythroid progenitor cells for heme biosynthesis. This is achieved by suppression of hepcidin, which allows iron fluxes to the plasma via ferroportin.9 Livers of 6-week-old IRP1−/− mice express negligible levels of hepcidin mRNA (Figure 7A). This leads to significant increases in serum iron (P < .01) compared with WT animals (Figure 7B) but not in hepatic iron (Figure 7E). Moreover, hepcidin suppression promotes accumulation of ferroportin in splenic macrophages of IRP1−/− mice (Figure 7G) and depletion of iron stores from these cells (Figure 7F,H). These results link IRP1 with regulation of body iron homeostasis.
IRP1 deficiency leads to suppressed hepcidin expression in the liver, hyperferremia, and depletion of splenic macrophages from iron due to accumulation of ferroportin. WT, IRP1−/−, and IRP2−/− mice (n = 6) were euthanized at the age of 4 to 6 weeks. (A) Analysis of liver hepcidin mRNA expression by quantitative polymerase chain reaction. (B-D) Analysis of serum iron, transferrin (Tf) saturation, and serum ferritin levels. (E-F) Quantification of hepatic and splenic iron by the ferrozine assay. (G) Immunohistochemical detection of splenic ferroportin (FPN). (H) Assessment of splenic iron deposits by Perls’ Prussian blue staining. *P < .05; **P < .01.
IRP1 deficiency leads to suppressed hepcidin expression in the liver, hyperferremia, and depletion of splenic macrophages from iron due to accumulation of ferroportin. WT, IRP1−/−, and IRP2−/− mice (n = 6) were euthanized at the age of 4 to 6 weeks. (A) Analysis of liver hepcidin mRNA expression by quantitative polymerase chain reaction. (B-D) Analysis of serum iron, transferrin (Tf) saturation, and serum ferritin levels. (E-F) Quantification of hepatic and splenic iron by the ferrozine assay. (G) Immunohistochemical detection of splenic ferroportin (FPN). (H) Assessment of splenic iron deposits by Perls’ Prussian blue staining. *P < .05; **P < .01.
Interestingly, 6-week-old IRP2−/− mice exhibit a previously unnoticed significant 3.5-fold induction (P < .05 vs WT) of hepcidin mRNA, which correlates with increased serum iron and transferrin saturation, hyperferritinemia, and a tendency for increased hepatic iron (Figure 7A-E). Ferroportin expression (Figure 7G) and iron content of splenic macrophages (Figure 7F,H) did not appear to differ between IRP2−/− and WT animals.
Discussion
We demonstrate here that juvenile IRP1−/− mice exhibit stress erythropoiesis and develop polycythemia due to increased expression of Epo. In addition, we provide evidence that renal Epo is transcriptionally induced by HIF2α, following translational de-repression of HIF2α mRNA as a result of IRP1 deficiency. The above responses correlate with suppression of liver hepcidin and accumulation of ferroportin in splenic macrophages, which promote iron mobilization from the spleen and hyperferremia.
The phenotype of juvenile IRP1−/− mice is highly reminiscent to diseases etiologically linked to unregulated HIF2α overexpression. These include Chuvash polycythemia, which is caused by pVHL mutations,21-23 and familial erythrocytosis with paraganglioma caused by inactivating mutations in PHD224-26 or gain-of-function HIF2α mutations that prevent its interaction with pVHL.27 Similar phenotypes are also observed in mice where HIF2α is stabilized due to targeted disruption of PHDs28-30 and in mice expressing an Epo transgene.31
IRP1−/− mice were previously reported to lack any discernible pathology but fail to suppress ferritin expression in IRP1-enriched tissues such as kidneys and brown fat.12,20 Conversely, IRP2−/− mice develop microcytic anemia and tissue iron overload,32,33 whereas double IRP1−/−IRP2−/− mice are not viable.12,20 Interestingly, IRP1 predominates in the cytosolic aconitase form and does not appear to register iron deficiency in tissues of IRP2−/− mice,20 even though it readily responds to iron in IRP2−/− cells cultured at 21% oxygen.8 These findings suggested that IRP2 is a dominant regulator of iron metabolism in tissues.
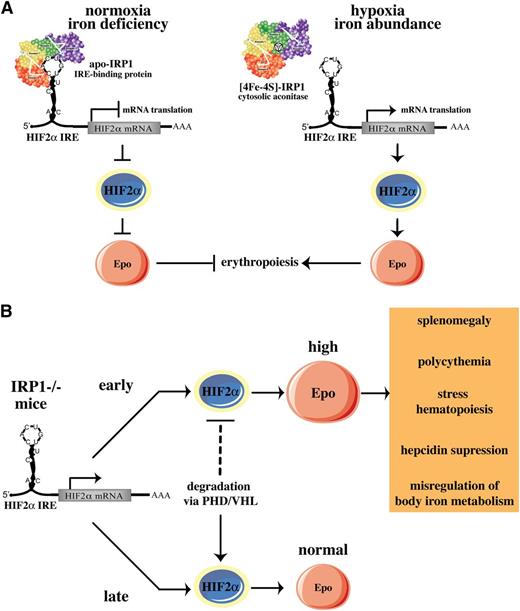
We show that IRP1 acts as a specific translational repressor of HIF2α mRNA in mice and that IRP2 cannot substitute this function. Our data are consistent with biochemical and cell culture experiments, uncovering the specificity of IRP1 in binding to the HIF2α IRE and in regulating HIF2α mRNA translation.10 We propose that IRP1 operates as an oxygen and iron sensor in tissues, according to the model shown in Figure 8A. Under normoxic conditions, the fraction of IRP1 that is present in the apo-form binds to the IRE in HIF2α mRNA and blocks its translation, keeping HIF2α and Epo levels low. Iron deficiency may further increase this fraction, as suggested by dietary experiments in rats34 and by the recently reported translational repression of HIF2α mRNA in rat livers.35 This response would further reduce Epo expression and erythropoietic activity under iron-limiting conditions. Hypoxia or increased iron supply favor conversion of apo- to [4Fe-4S]-IRP1, which acts as cytosolic aconitase and fails to bind to HIF2α mRNA, allowing HIF2α synthesis. This response would stimulate erythropoiesis following HIF2α-dependent transcriptional activation of Epo to meet tissue needs for oxygenation and to consume abundant iron. Regulation of HIF2α IRE by IRP2 would be counterintuitive, considering that IRP2 is stabilized and exhibits high RNA-binding activity under hypoxia.6,7 This scenario is excluded by the previous in vitro findings10 and the in vivo data presented here.
Models for pathophysiological responses mediated by the IRP1/HIF2a pathway. (A) Translational regulation of HIF2α mRNA by IRP1. (B) Age-dependent erythropoietic abnormalities of IRP1−/− mice. See Discussion for details.
Models for pathophysiological responses mediated by the IRP1/HIF2a pathway. (A) Translational regulation of HIF2α mRNA by IRP1. (B) Age-dependent erythropoietic abnormalities of IRP1−/− mice. See Discussion for details.
Notably, the HIF2α-related erythropoietic abnormalities of IRP1−/− mice develop early in life and recover after 8 to 10 weeks. We provide evidence that this is causally linked to differential expression of HIF2α, which is pathologically elevated in juvenile animals and returns to normal values in adults. HIF2α steady-state levels depend on the rates of HIF2α synthesis and degradation. Normoxic degradation of HIFα subunits is mediated by the proteasome and involves ubiquitination of HIFα by pVHL, following prolyl hydroxylation by PHDs.3 We speculate that HIF2α degradation is limiting in juvenile IRP1−/− mice, and therefore, HIF2α accumulates in the kidneys (Figure 5) and possibly other tissues, due to de-repression of its synthesis. This leads to erythropoietic abnormalities and misregulation of body iron homeostasis via induction of Epo (Figure 8B). According to this model, HIF2α degradation may become more efficient in older IRP1−/− animals. This would offset the increased HIF2α synthesis, reduce HIF2α steady-state levels, and correct HIF2α-related pathology, thereby compensating for the IRP1 deficiency.
We also report that IRP1 deficiency leads to increased Epo mRNA expression in the liver. Quantitatively, hepatic Epo expression is negligible compared with renal Epo, and is not expected to significantly contribute to the pathology of juvenile IRP1−/− mice. Nevertheless, the diminution of liver Epo mRNA levels in IRP1−/− mice bearing hepatocyte-specific ablation of HIF2α provides genetic support for the model depicted in Figure 8.
We further show that the loss of IRP1 misregulates body iron homeostasis via suppression of liver hepcidin. This augments ferroportin expression in splenic macrophages and promotes iron efflux from the spleen to the plasma to meet the high iron needs of the increased erythroid progenitor cell population. The relatively mild polycythemia of juvenile IRP1−/− mice compared with the degree of reticulocytosis (0.37-fold and 2.5-fold increases in numbers of red blood cells and reticulocytes, respectively, vs WT) may suggest that iron supply for terminal erythropoiesis is still limiting. The marked suppression of hepcidin in IRP1−/− mice is very likely an indirect effect of stress erythropoiesis and induction of Epo. Recent experiments clarified that the hypoxic silencing of hepcidin that was previously attributed to HIFs is caused by HIF2α-mediated induction of Epo and stimulation of erythropoiesis.36,37 Our data are consistent with these findings and highlight the role of IRP1 as an upstream regulator of systemic iron homeostasis via the HIF2α/Epo and hepcidin/ferroportin axes. IRP1 is also expected to regulate dietary iron absorption, considering that expression of the intestinal iron transporters DMT1 and ferroportin is transcriptionally activated by HIF2α.38,39
On a final note, we report that juvenile IRP2−/− mice exhibit a significant increase in hepcidin mRNA expression that has escaped previous attention. Conceivably, this is an early response to serum and hepatic iron overload, which is later neutralized by the increased erythropoietic iron requirement of microcytic anemia.32,33 Erythropoiesis-driven negative regulation of hepcidin expression appears to override positive regulation by iron.40-42
In conclusion, we describe a novel in vivo function of IRP1 as oxygen/iron sensor and regulator of HIF2α-dependent pathophysiological responses. Preliminary data of this work were disclosed earlier43 and were recently discussed.44 While this manuscript was in preparation, erythropoietic abnormalities of IRP1−/− mice were also reported by others.45,46 Ghosh et al45 further showed that IRP1−/− mice develop pulmonary hypertension, an additional pathology shared by Chuvash polycythemia patients47 and the respective mouse model.48 Together, the data reported here and elsewhere45,46 highlight the crucial role of IRP1 as an upstream regulator of erythropoiesis and systemic iron metabolism. A link of IRP1 polymorphisms with polycythemias of unknown etiology is conceivable.
The online version of this article contains a data supplement.
There is an Inside Blood commentary on this article in this issue.
The publication costs of this article were defrayed in part by page charge payment. Therefore, and solely to indicate this fact, this article is hereby marked “advertisement” in accordance with 18 USC section 1734.
Acknowledgments
The authors thank Dr Richard A. French (Becker College, Worcester, MA) for assistance with pathology, Drs Valentina Gandin and Ivan Topisirovic for help with polysome fractionation, Dr Naciba Benlimame for technical support with immunohistochemistry, Christian Young for technical support with fluorescence-activated cell sorter, and Dr Prem Ponka for critical reading of the manuscript.
This work was supported by a grant from the Canadian Institutes for Health Research (MOP-86514). K.P. holds a Chercheur National career award from the Fonds de la Recherche en Santé du Quebéc.
Authorship
Contribution: N.W. designed and performed research and analyzed data; and K.P. designed and supervised research and wrote the paper.
Conflict-of-interest disclosure: The authors declare no competing financial interests.
Correspondence: Kostas Pantopoulos, Lady Davis Institute for Medical Research, 3999 Cote-Ste Catherine Rd, Montreal, QC, H3T 1E2, Canada; e-mail: kostas.pantopoulos@mcgill.ca.

