Abstract
Liver iron concentration (LIC) represents the best surrogate of total body iron balance for guiding iron chelation therapy. Liver biopsy was formerly used to determine LIC, but has gradually been replaced by magnetic resonance imaging (MRI) relaxometry because relaxometry is noninvasive and has lower sampling variability. Since neither liver biopsy nor MRI relaxometry can be considered a “gold standard”, there is a need for an independent mechanism to validate their accuracy and reproducibility. In this study, we use serial estimates of iron chelation efficiency calculated by R2 and R2* MRI as well as simulated liver biopsy results to demonstrate that MRI is fundamentally more accurate that liver biopsy in determining iron balance.
All patients were participating in a phase 2 clinical trial of SPD602 (formerly known as FBS0701) and had strict documentation of iron chelator and blood intake. MRI R2 and R2* LIC estimates were performed at baseline, 12, 24, 48, 72, and 96 weeks. Forty-nine patients completed 24 weeks, 39 completed 48 weeks, and 26 completed 96 weeks of the trial. Liver biopsy LIC results were simulated (by Monte Carlo simulation) using sampling errors having a coefficient of variation (CoV) of 0%, 10%, 20%, 30%, and 40%, and iron assay variability of 12%. LIC estimates by R2, R2*, and simulated biopsy were used to calculate chelation efficiency estimates over time. Bland–Altman limits of agreement were compared across observation timescales of 12, 24, and 48 weeks.
Table 1 summarizes the standard deviation for chelation efficiency estimates performed at 12, 24, and 48 week intervals. For 48 week intervals, R2, R2*, and “perfect” liver biopsy exhibited statistically identical variance (indicated by italic type), and were superior to any “realistic” sampling error for liver biopsy (CoV 10–40%). At shorter measurement intervals, R2* produced the lowest variance estimates. For 12 week intervals, R2* efficiency estimates were confounded by two outliers; exclusion of these two points reduced the standard deviation of 12 week R2* efficiency estimates to 15.6% (p < 0.01).
Standard deviation of chelation efficiency across observation intervals
| . | 12 weeks . | 24 weeks . | 48 weeks . |
|---|---|---|---|
| R2 | 44.8% | 14.8% | 7.4% |
| R2* | 22.9% | 9.3% | 5.7% |
| Biopsy, Sampling Error 0% | 25.9% | 12.8% | 6.7% |
| Biopsy, Sampling Error 10% | 32.8% | 16.5% | 8.7% |
| Biopsy, Sampling Error 20% | 49.1% | 24.9% | 13.0% |
| Biopsy, Sampling Error 30% | 68.1% | 34.5% | 18.0% |
| Biopsy, Sampling Error 40% | 88.1% | 44.6% | 23.2% |
Italics indicates the most robust estimate (p < 0.05 by variance test) for each interval.
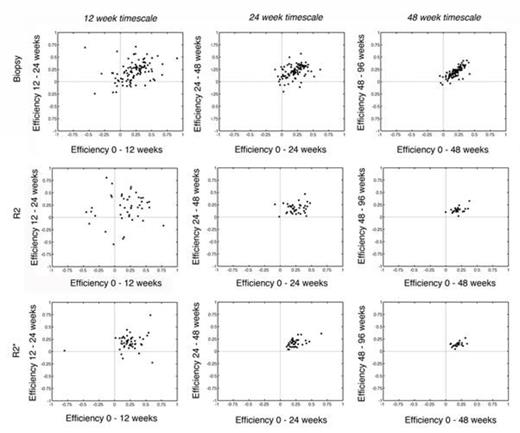
Figure 1 (top row) demonstrates simulated efficiency estimates by “perfect” liver biopsy performed on 12, 24, and 48 week timescales. While “perfect” liver biopsy approaches ideal behavior at 48 week intervals, many non-physiologic estimates (> 100%, < 0%) are produced during shorter term observations. Figure 1 (middle and bottom row) compares the identical relationships for chelation efficiency estimates generated by R2 and R2*, respectively. R2 demonstrates similar scatter as observed for liver biopsy. R2* efficiency estimates are better, with a slope near unity and all points residing in the upper right hand quadrant for 24 and 48 week timescales. Thus both R2 and R2* produce chelation efficiency estimates at least as good as “perfect” liver biopsy and better than biopsy performed with any reasonable estimate of sampling variability.
Scatterplot of estimated chelation efficiencies across different observation intervals and methods of calculation
Scatterplot of estimated chelation efficiencies across different observation intervals and methods of calculation
Discussion
Even if liver biopsy is assumed to have no sampling variation, which is unrealistic in clinical practice, MRI relaxometry is superior for tracking of total body iron balance. R2 and R2* are equally robust on annual evaluations, but R2* more closely tracks iron balance on shorter timescales. We conclude that MRI relaxometry should replace liver biopsy for the determination of LIC for both clinical and regulatory purposes.
Wood:Shire: Consultancy, Research Funding; Apopharma: Honoraria, Patents & Royalties; Novartis: Honoraria. Zhang:Shire: Employment. Rienhoff:Shire: Consultancy, Milestone Payments Other. Abi-Saab:Shire: Employment, Equity Ownership, Patents & Royalties; AbbVie: Equity Ownership, Patents & Royalties; Novartis: Equity Ownership, Patents & Royalties; Abbott: Equity Ownership, Patents & Royalties; Pfizer: Equity Ownership, Patents & Royalties. Neufeld:Shire: Consultancy.
Author notes
Asterisk with author names denotes non-ASH members.


This feature is available to Subscribers Only
Sign In or Create an Account Close Modal