

Abstract
The beneficial anti-leukemic effect of chronic GVHD (CGVHD) is offset by an increased risk of late treatment-related mortality (TRM). Several clinical risk factors have been identified as predictors of outcomes in patients with CGVHD. We previously identified 10 variables significantly associated with TRM and survival in5343 patients with CGVHD transplanted between 1995 and 2004. We then developed a CGVHD CIBMTR risk score using these variables (Arora, M., et al.: Blood, 2011; 117: 6714-6720). Variables included in the score were age, prior acute GVHD, time from HCT to CGVHD, donor type, disease status at transplant, GVHD prophylaxis, gender match, serum bilirubin and Karnofsky score and platelet count at time of diagnosis of CGVHD. Six risk-groups were identified with powerful discriminative ability to predict TRM and survival. In the current study we sought to validate this risk score in an independent dataset of 1007 patients with CGVHD transplanted between 2005 and 2007 using the same inclusion criteria and risk-score calculations. Patients were divided into 4 risk groups (RGs) according to the sum of the overall risk score: RG1 (0-2), RG2 (3-6), RG3 (7-8) and RG4 (9-10) (Table), and cumulative incidences of TRM and survival were calculated. TRM and survival at 12 and 24 months after CGVHD for each RG are shown in the Table. We found a strong correlation between CGVHD RG with TRM (p<0.0001) and survival (p<0.0001). Also, TRM and survival were significantly different between each RG (Figure and Table). Our study validates the prognostic value of the CIBMTR CGVHD RGs for OS and TRM in a contemporary transplant population. The CIBMTR CGVHD RGs can be used to predict major outcomes and tailor treatment planning.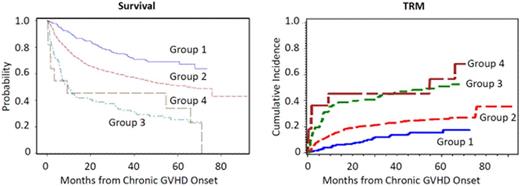

Figure 1
Table
Outcomes by Risk Group, according to CGVHD CIBMTR risk-score (RS)
| Adjusted Overall Survival, (95% CI) after CGVHD | Adjusted Cumulative Incidence, TRM, (95% CI) after CGVHD | |||||
|---|---|---|---|---|---|---|
| Risk Group | Overall RS | Patients, n (%) | 12 months | 24 months | 12 months | 24 months |
| 1 | 0-2 | 213 (21) | 88 (84-93) | 80 (75-86) | 6 (3-10) | 9 (5-13) |
| 2 | 3-6 | 684 (68) | 74 (71-77) | 64 (60-67) | 15 (18-33) | 20 (17-23) |
| 3 | 7-8 | 99 (10) | 44 (34-54) | 37 (28 -48) | 33 (24-42) | 37 (28-46) |
| 4 | 9-10 | 11 (1) | 43 (14-73) | 43 (14-73) | 39 (16-63) | 39 (16-63) |
Disclosures:
No relevant conflicts of interest to declare.

This feature is available to Subscribers Only
Sign In or Create an Account Close Modal