Abstract
Prospective clinical trials show that 5-Azicitidine (5-Aza) is superior to conventional care regimens in prolonging the survival of patients with high-risk myelodysplastic syndromes (MDS) (pts). To confirm the survival benefit of 5-Aza in daily clinical practice, we compared the survival of high-risk MDS patients who received parental treatment before 5-Aza approval to those who could be initially treated with 5-Aza.
In Japan, 5-Aza was approved in January 2011. We collected data of consecutive adult patients (pts) with high-risk MDS, namely refractory anemia with excess blasts-1 (RAEB-1), RAEB-2, and acute myeloid leukemia with MDS related features (AML/MRF), who received the first parental chemotherapy between January 2000 and April 2013. Survival was not calculated from the day on which the first chemotherapy was delivered, but from the day on which the diagnosis of high-risk MDS was established. Survival analysis was done by the Kaplan-Meier method. The Cox regression model was used for the analyses. A total of 107 pts with high-risk MDS were identified. They were divided into two groups (grps) on the basis of whether or not they could be initially treated with 5-Aza. In brief, pts who received the first parental treatment before January 2011 were categorized into the conventional care (CC) grp (N=75), and pts for whom treatment began after January 2011 were categorized in the 5-Aza grp (N=32). The following variables were also considered to affect survival in multivariate analysis: sex, age (>=65 years (yrs) old or < 65 yrs old), WHO classification, and IPSS at diagnosis of high-risk MDS.
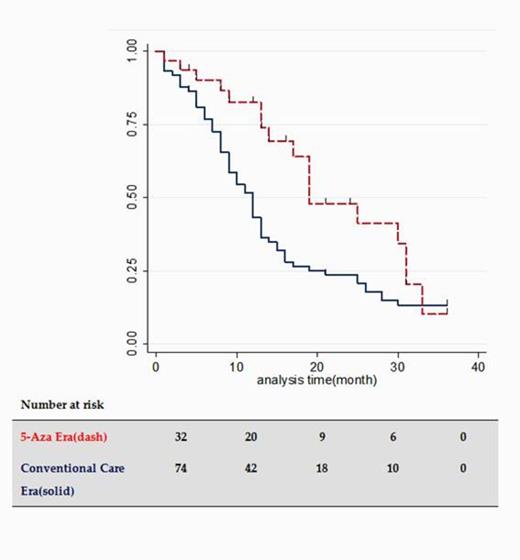
Median follow-up times of CC and 5-Aza grp were 43 and 11 months, respectively. As shown in Table 1, the distributions of sex, age, WHO classification and IPSS were nearly the same in both grps. As for initial treatment, pts in the CC group mainly received low-dose cytarabine (ld-AraC), whereas most pts in the 5-Aza grp were treated with 5-Aza. Unadjusted survival curves of the two grps are shown in Figure 1. The unadjusted 2-yr survival rate was 33% in the CC grp and 52% in 5-Aza era grp. Median survival times were 11 and 24 months in CC and 5-Aza grps, respectively. Uni-variate analysis of overall survival revealed a trend for improved survival in younger pts, but this was contradicted by the results of multi-variate analysis. In uni- and multi-variate analyses, the 5-Aza group showed an overall, and statistically significant higher survival benefit (Table 2).
Removing the 26 patients allografted after parental treatment (10 in 5-Aza grp and 16 in CC grp) at the time of alloSCT from the analyses did not modify the survival advantage of the 5-Aza grp.
This retrospective analysis confirms that the introduction of 5-Aza has certainly improved the outcome of high-risk MDS in daily clinical practice.
Patients characteristics at diagnosis of high-risk MDS
| Patients characteristics . | <=2010 (N=75) (N/%) . | >=2011 (N=32) . | Total (N=107) . |
|---|---|---|---|
| Sex(male/female) . | 57(76)/18(24) . | 28(88)/4(12) . | 85(79)/22(21) . |
| Age (median) <65 >=65 | 68 29(39) 46(61) | 68.5 14(44) 18(56) | 68 43(40) 64(60) |
| Initial treatment low-dose AraC 5-Aza intensive chemotherapy | 63(84) 0(0) 12(16) | 3(9) 26(81) 3(9) | 66(62) 26(24) 15 (14) |
| WHO Classification RAEB1, RAEB2, AML/MRF Missing/Unevaluable | 19(25) 31(42) 15(20) 10(13) | 7(22) 13(41) 8(25) 4(13) | 26(24) 44(41) 23(21) 14(13) |
| IPSS low Int-1 Int-2 high Missing/Unevaluable | 1(1) 15(20) 21(28) 24(32) 14(19) | 0(0) 7(22) 8(25) 12(38) 5(16) | 1(1) 22(21) 29(27) 36(34) 19(18) |
Uni- and multi-variate analysis of overall survival
| Variables . | . | Univariate . | Multivariate . | ||
|---|---|---|---|---|---|
| . | . | RR (95%CI) . | P . | RR (95%CI) . | P . |
| Age (vs.<65y) | >=65y | 1.5(0.98-2.41) | 0.061 | 1.5(0.94-2.5) | 0.84 |
| Sex | male | 0.92(0.53-1.60) | 0.76 | 0.73(0.39-1.4) | 0.33 |
| Disease status (vs.RAEB1) | RAEB2 AML/MRFMissing/Unevaluable | 0.73(0.42-1.3) 0.78(0.41-1.5) 0.69(0.34-1.4) | 0.27 0.450.32 | 0.72(0.37-1.4) 1.3(0.51-3.4) 0.76(0.25-2.3) | 0.33 0.580.62 |
| Treatment Era (vs. Conventional Care Era) | 5-Aza | 0.54(0.32-1.0) | 0.027 | 0.39(0.18-0.83) | 0.043 |
| IPSS (vs. Low) | Intermediate-1 Intermediate-2 High Missing/Unevaluable | 2.6(0.35-20) 2.3(0.31-17) 2.0(0.26-15) 1.9(0.24-14.) | 0.35 0.420.51 0.55 | 5.0(0.53-48) 2.5(0.22-28) 1.3(0.099-17) 3.0(0.21-44) | 0.16 0.470.84 0.42 |
No relevant conflicts of interest to declare.
Author notes
Asterisk with author names denotes non-ASH members.


This feature is available to Subscribers Only
Sign In or Create an Account Close Modal