Abstract

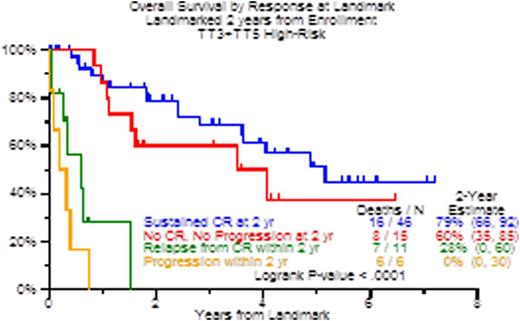
Little progress has been made in the management of the 15% of patients presenting with GEP-70-defined high risk MM. Successive TT protocols (TT3, TT5) were reviewed and clinical endpoints (CR, CR duration, PFS, OS) compared and prognostic models developed for this high-risk entity. Altogether 127 patients were identified (TT3a, 40; TT3b, 37; TT5, 50), whose baseline characteristics were similar with regard to age, B2M, CRP, creatinine, hemoglobin, platelet count, LDH, metaphase-based cytogenetic abnormalities and the recently introduced GEP-5 risk designation (Table 1
Patient characteristics, TT3 vs. TT5
| Factor . | TT3 . | TT5 . | P-value . |
|---|---|---|---|
| Age >= 65 yr | 21/77 (27%) | 14/50 (28%) | 0.929 |
| Albumin < 3.5 g/dL | 44/77 (57%) | 25/49 (51%) | 0.501 |
| B2M >= 3.5 mg/L | 57/77 (74%) | 40/49 (82%) | 0.323 |
| B2M > 5.5 mg/L | 41/77 (53%) | 22/49 (45%) | 0.361 |
| CRP >= 8 mg/L | 35/77 (45%) | 18/49 (37%) | 0.334 |
| Creatinine >= 1.5 mg/dL | 18/77 (23%) | 11/49 (22%) | 0.904 |
| Hb < 10 g/dL | 41/77 (53%) | 28/49 (57%) | 0.668 |
| LDH >= 190 U/L | 37/77 (48%) | 17/49 (35%) | 0.140 |
| Platelet Count < 150 x 10^9/L | 24/77 (31%) | 17/49 (35%) | 0.681 |
| Cytogenetic abnormalities | 57/76 (75%) | 33/49 (67%) | 0.352 |
| GEP-5 High-Risk | 58/77 (75%) | 34/50 (68%) | 0.367 |
n/N(%): n- Number with Factor, N-Number with Valid Data for Factor
N/A:All Positive or All Negative for Factor, P-value not available
* Fisher Exact Test, otherwise Chi-Square Test
Multivariate Cox Regression Analysis
| . | . | . | Overall Survival . | |
|---|---|---|---|---|
| . | Variable . | n/N (%) . | HR (95% CI) . | P-value . |
| Multivariate Model | TT5 | 48/124 (39%) | 0.29 (0.14, 0.60) | <.001 |
| Disease Progression *** | 13.13 (7.47, 23.10) | <.001 | ||
| Age >= 65 yr | 34/124 (27%) | 2.44 (1.38, 4.31) | 0.002 | |
| Multivariate Model with Additional Term for Achieving CR | TT5 | 50/127 (39%) | 0.30 (0.14, 0.64) | 0.002 |
| Achieved CR *** | 0.63 (0.35, 1.11) | 0.110 | ||
| Disease Progression *** | 11.99 (6.85, 21.00) | <.001 | ||
| Age >= 65 yr | 35/127 (28%) | 2.50 (1.41, 4.43) | 0.002 | |
HR-Hazard Ratio, 95% CI- 95% Confidence Interval, P-value from Wald Chi-Square Test in Cox Regression. All univariate pvalues reported regardless of significance.
Multivariate model uses stepwise selection with entry level 0.1 and variable remains if meets the 0.05 level.
A multivariate p-value greater than 0.05 indicates variable forced into model with significant variables chosen using stepwise selection.
*** Indicates Time-dependent variable.
Thus, GEP-70-defined high-risk MM has not yet benefited from therapeutic advances observed in low-risk disease. The superior OS in TT5 may be due to the availability of additional new agents, pomalidomide and carfilzomib, which will be incorporated into the front line management of such patients. A plateau-like shape of the PFS curve emerged at 4 years supporting previous observations in TT2 that GEP-defined high-risk MM can be cured in a fraction of patients. The GEP-5 model points to the detrimental role of a limited number of genes which, when targeted, may offer means of controlling this disease entity. We are also applying exomics to identify, in high-risk MM, early on actionable mutations for personalized therapy of such patients.
van Rhee:Jansen & Jansen: Research Funding. Barlogie:Celgene: Consultancy, Honoraria, Research Funding; Myeloma Health, LLC: Patents & Royalties.
Author notes
Asterisk with author names denotes non-ASH members.

This icon denotes a clinically relevant abstract


This feature is available to Subscribers Only
Sign In or Create an Account Close Modal